Welcome to the A Python Crawler (APyC) for HTTP Endpoints repository.
Apyc repository holds a Python program that makes it easy to crawl two HTTP endpoints at the moment. APyC offers easy way to build and deploy the Python program on Kubernetes and monitor Prometheus format metrics using Prometheus Server and Grafana Dashboards.
APyC is just a abbreviation for A Python Crawler that abstracts the complexities of configuring a test python app to crawl HTTP endpoints and emit Prometheus format metrics.
You can use this repository as a sample design to run a Python application on Kubernetes Container based environment. Below are few features of APyC,
- Simple service written in Python that queries 2 URL's (https://httpstat.us/503 & https://httpstat.us/200) every one second.
- APyC checks if external URL's are up (based on http status code 200) and returns response time in milliseconds.
- APyC runs a simple http server to emit Prometheus format metrics on path
/metricsusing Python Prometheus library.
0= down and1= up
sample_external_url_up{url="https://httpstat.us/503 "}  = 0
sample_external_url_response_ms{url="https://httpstat.us/503 "}  = [value]
sample_external_url_up{url="https://httpstat.us/200 "}  = 1
sample_external_url_response_ms{url="https://httpstat.us/200 "}  = [value]
- Docker
- make
- Kubernetes Cluster
- kubectl
- Helm version 3
- Python 3.7.4 or greater (only if Docker is not installed)
- Pip (only if Docker is not installed)
make docker-run

# OR use below command if Docker is not installed

make run
make docker-unit-test

# OR use below command if Docker is not installed

make unit-test
-
Configure kubectl configuration pointing to a Kubernetes Cluster
-
Deploy APyC using make
make k8s-deploy
-
Create a Kubernetes Cluster
-
Install Prometheus
kubectl create namespace prometheus helm install prometheus prometheus-community/prometheus \ --namespace prometheus \ --set alertmanager.persistentVolume.storageClass="gp2" \ --set server.persistentVolume.storageClass="gp2" kubectl port-forward -n prometheus deploy/prometheus-server 8080:9090 -
Install Grafana
mkdir ${HOME}/environment/grafana cat << EoF > ${HOME}/environment/grafana/grafana.yaml datasources: datasources.yaml: apiVersion: 1 datasources: - name: Prometheus type: prometheus url: http://prometheus-server.prometheus.svc.cluster.local access: proxy isDefault: true EoF kubectl create namespace grafana helm install grafana grafana/grafana \ --namespace grafana \ --set persistence.storageClassName="gp2" \ --set persistence.enabled=true \ --set adminPassword='EKS!sAWSome' \ --values ${HOME}/environment/grafana/grafana.yaml \ --set service.type=LoadBalancer export ELB=$(kubectl get svc -n grafana grafana -o jsonpath='{.status.loadBalancer.ingress[0].hostname}') echo "http://$ELB" kubectl get secret --namespace grafana grafana -o jsonpath="{.data.admin-password}" | base64 --decode ; echo -
Import APyC specific Grafana Dashboard
- click the
+icon in the side menu and then click Import. - From here you can upload the dashboard JSON file
config/grafana/APyC Metrics-dashboard.json
- click the
-
Deploy APyC on Kubernetes
kubectl apply -f apyc-k8s-deployment.yml

#OR

make k8s-deploy
-
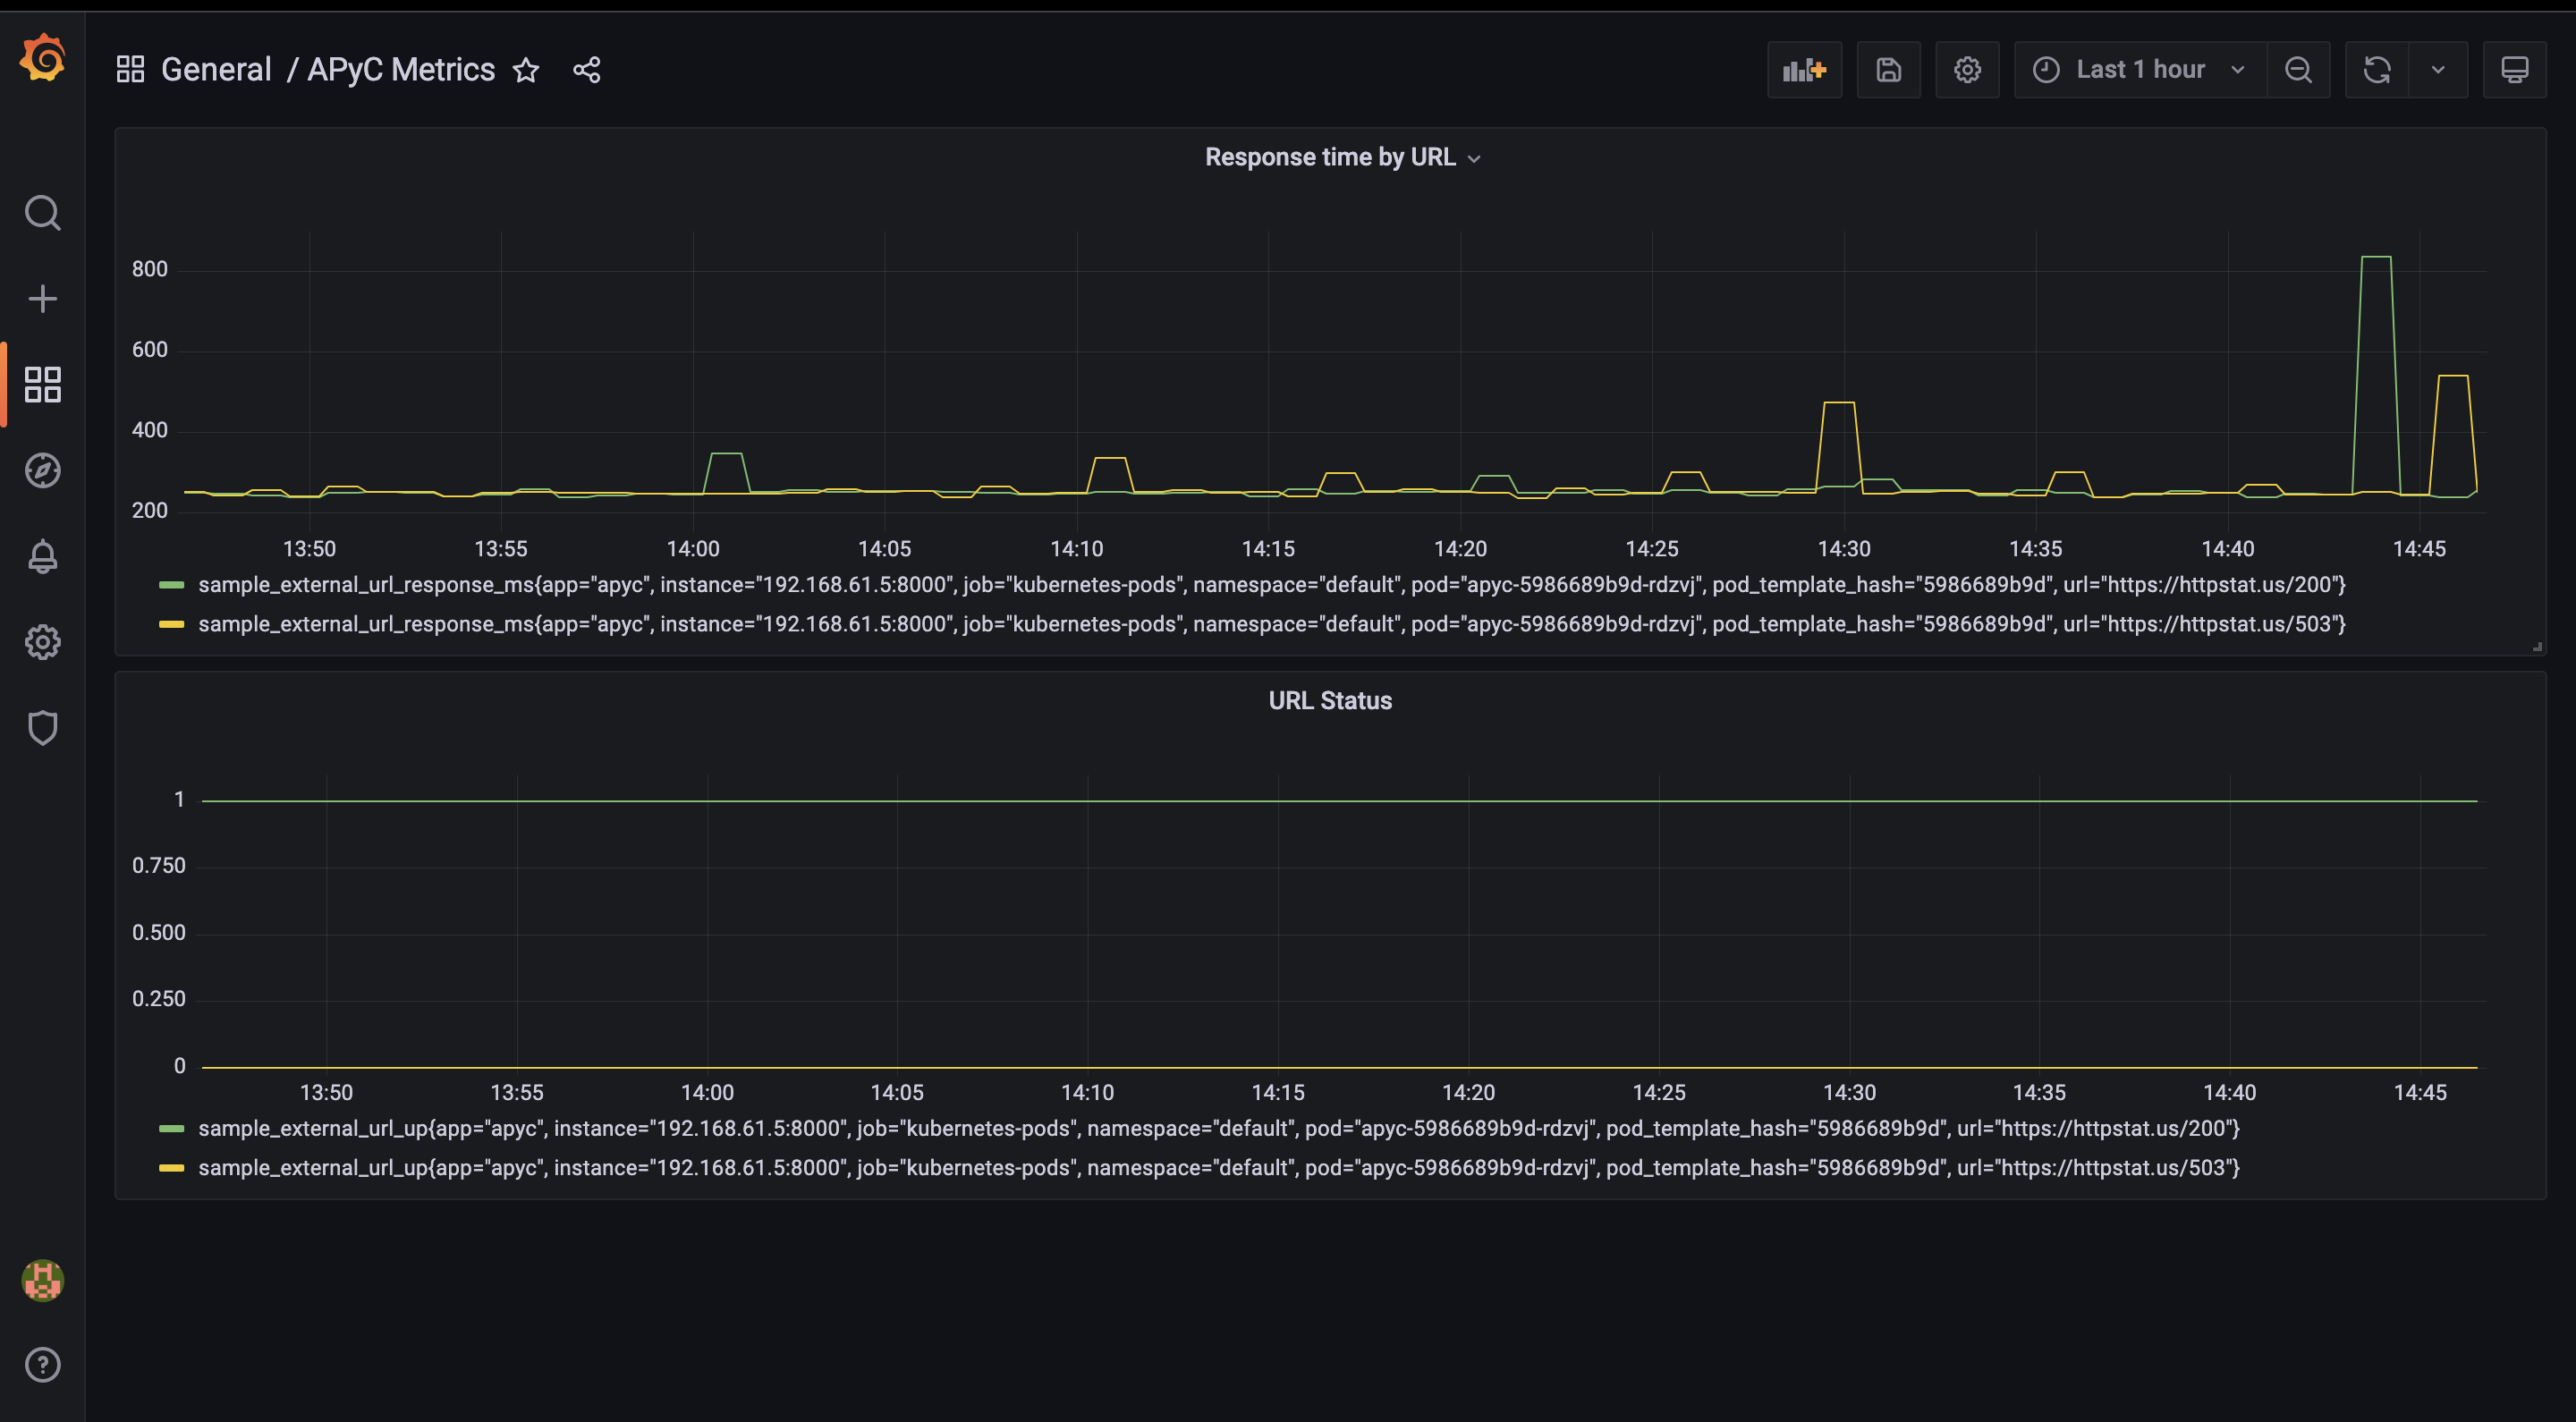
APyC Grafana Dashboardscreenshot below -
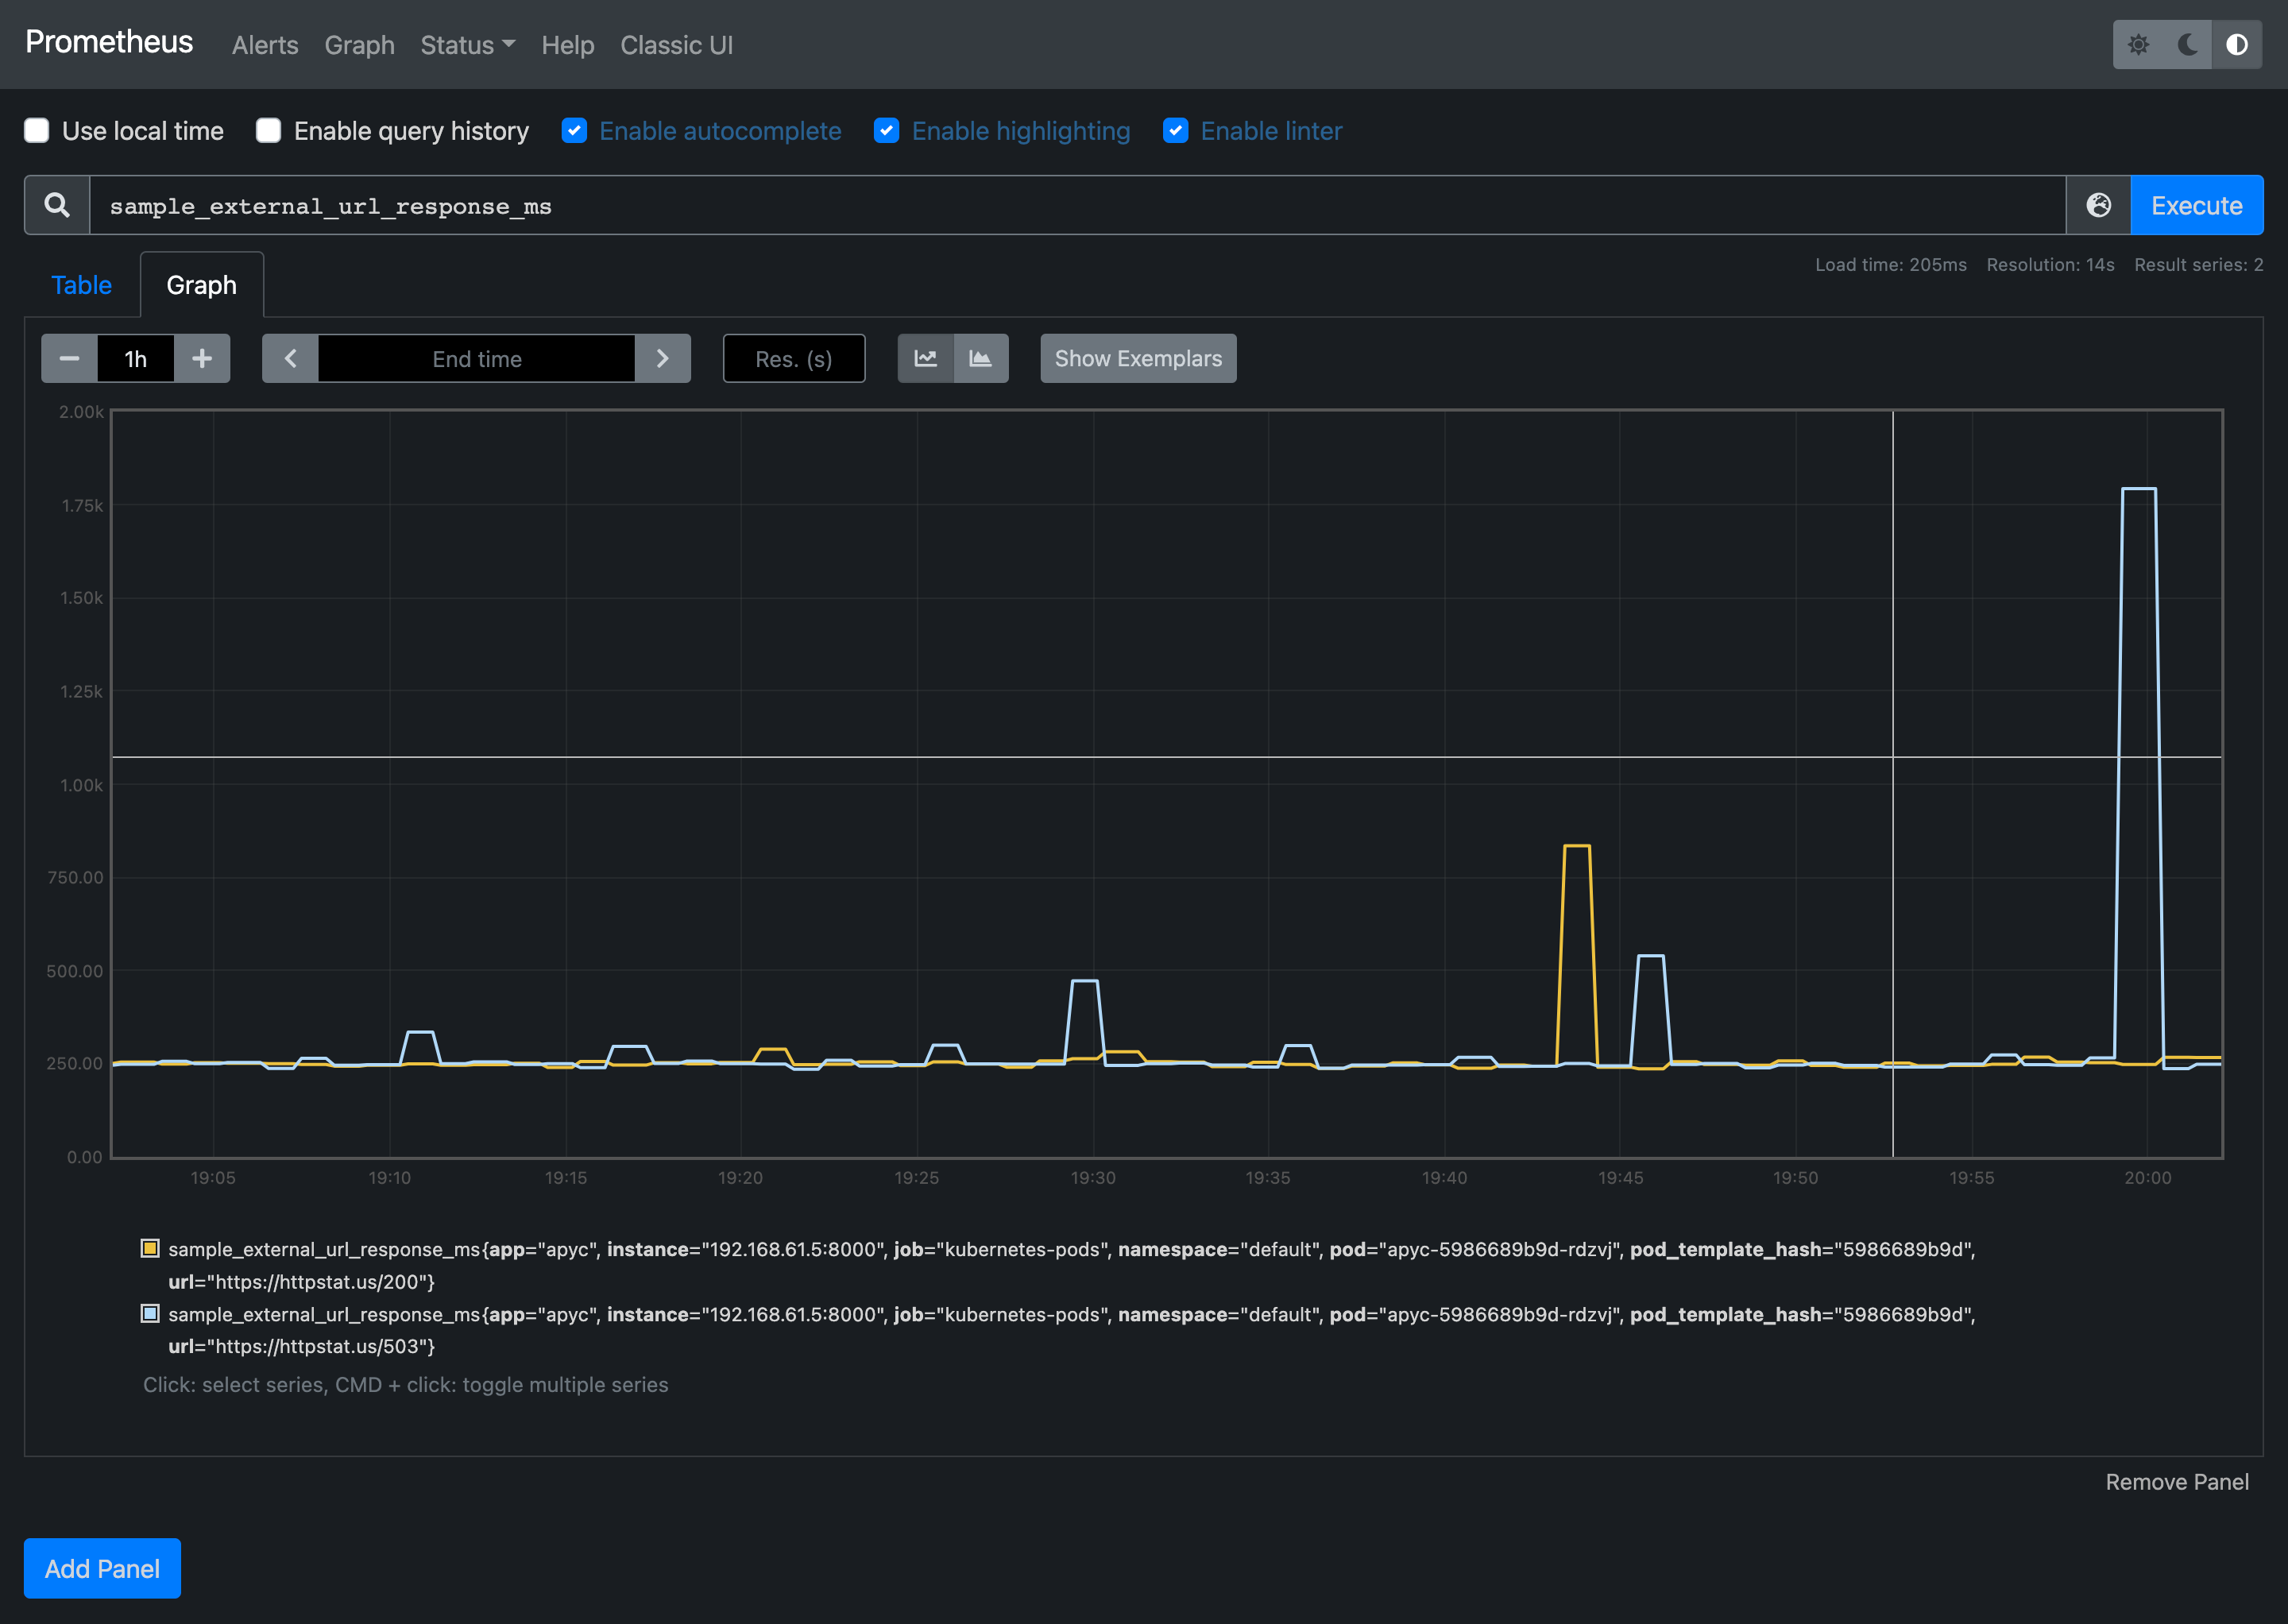
APyC Prometheus metric
sample_external_url_response_ms -
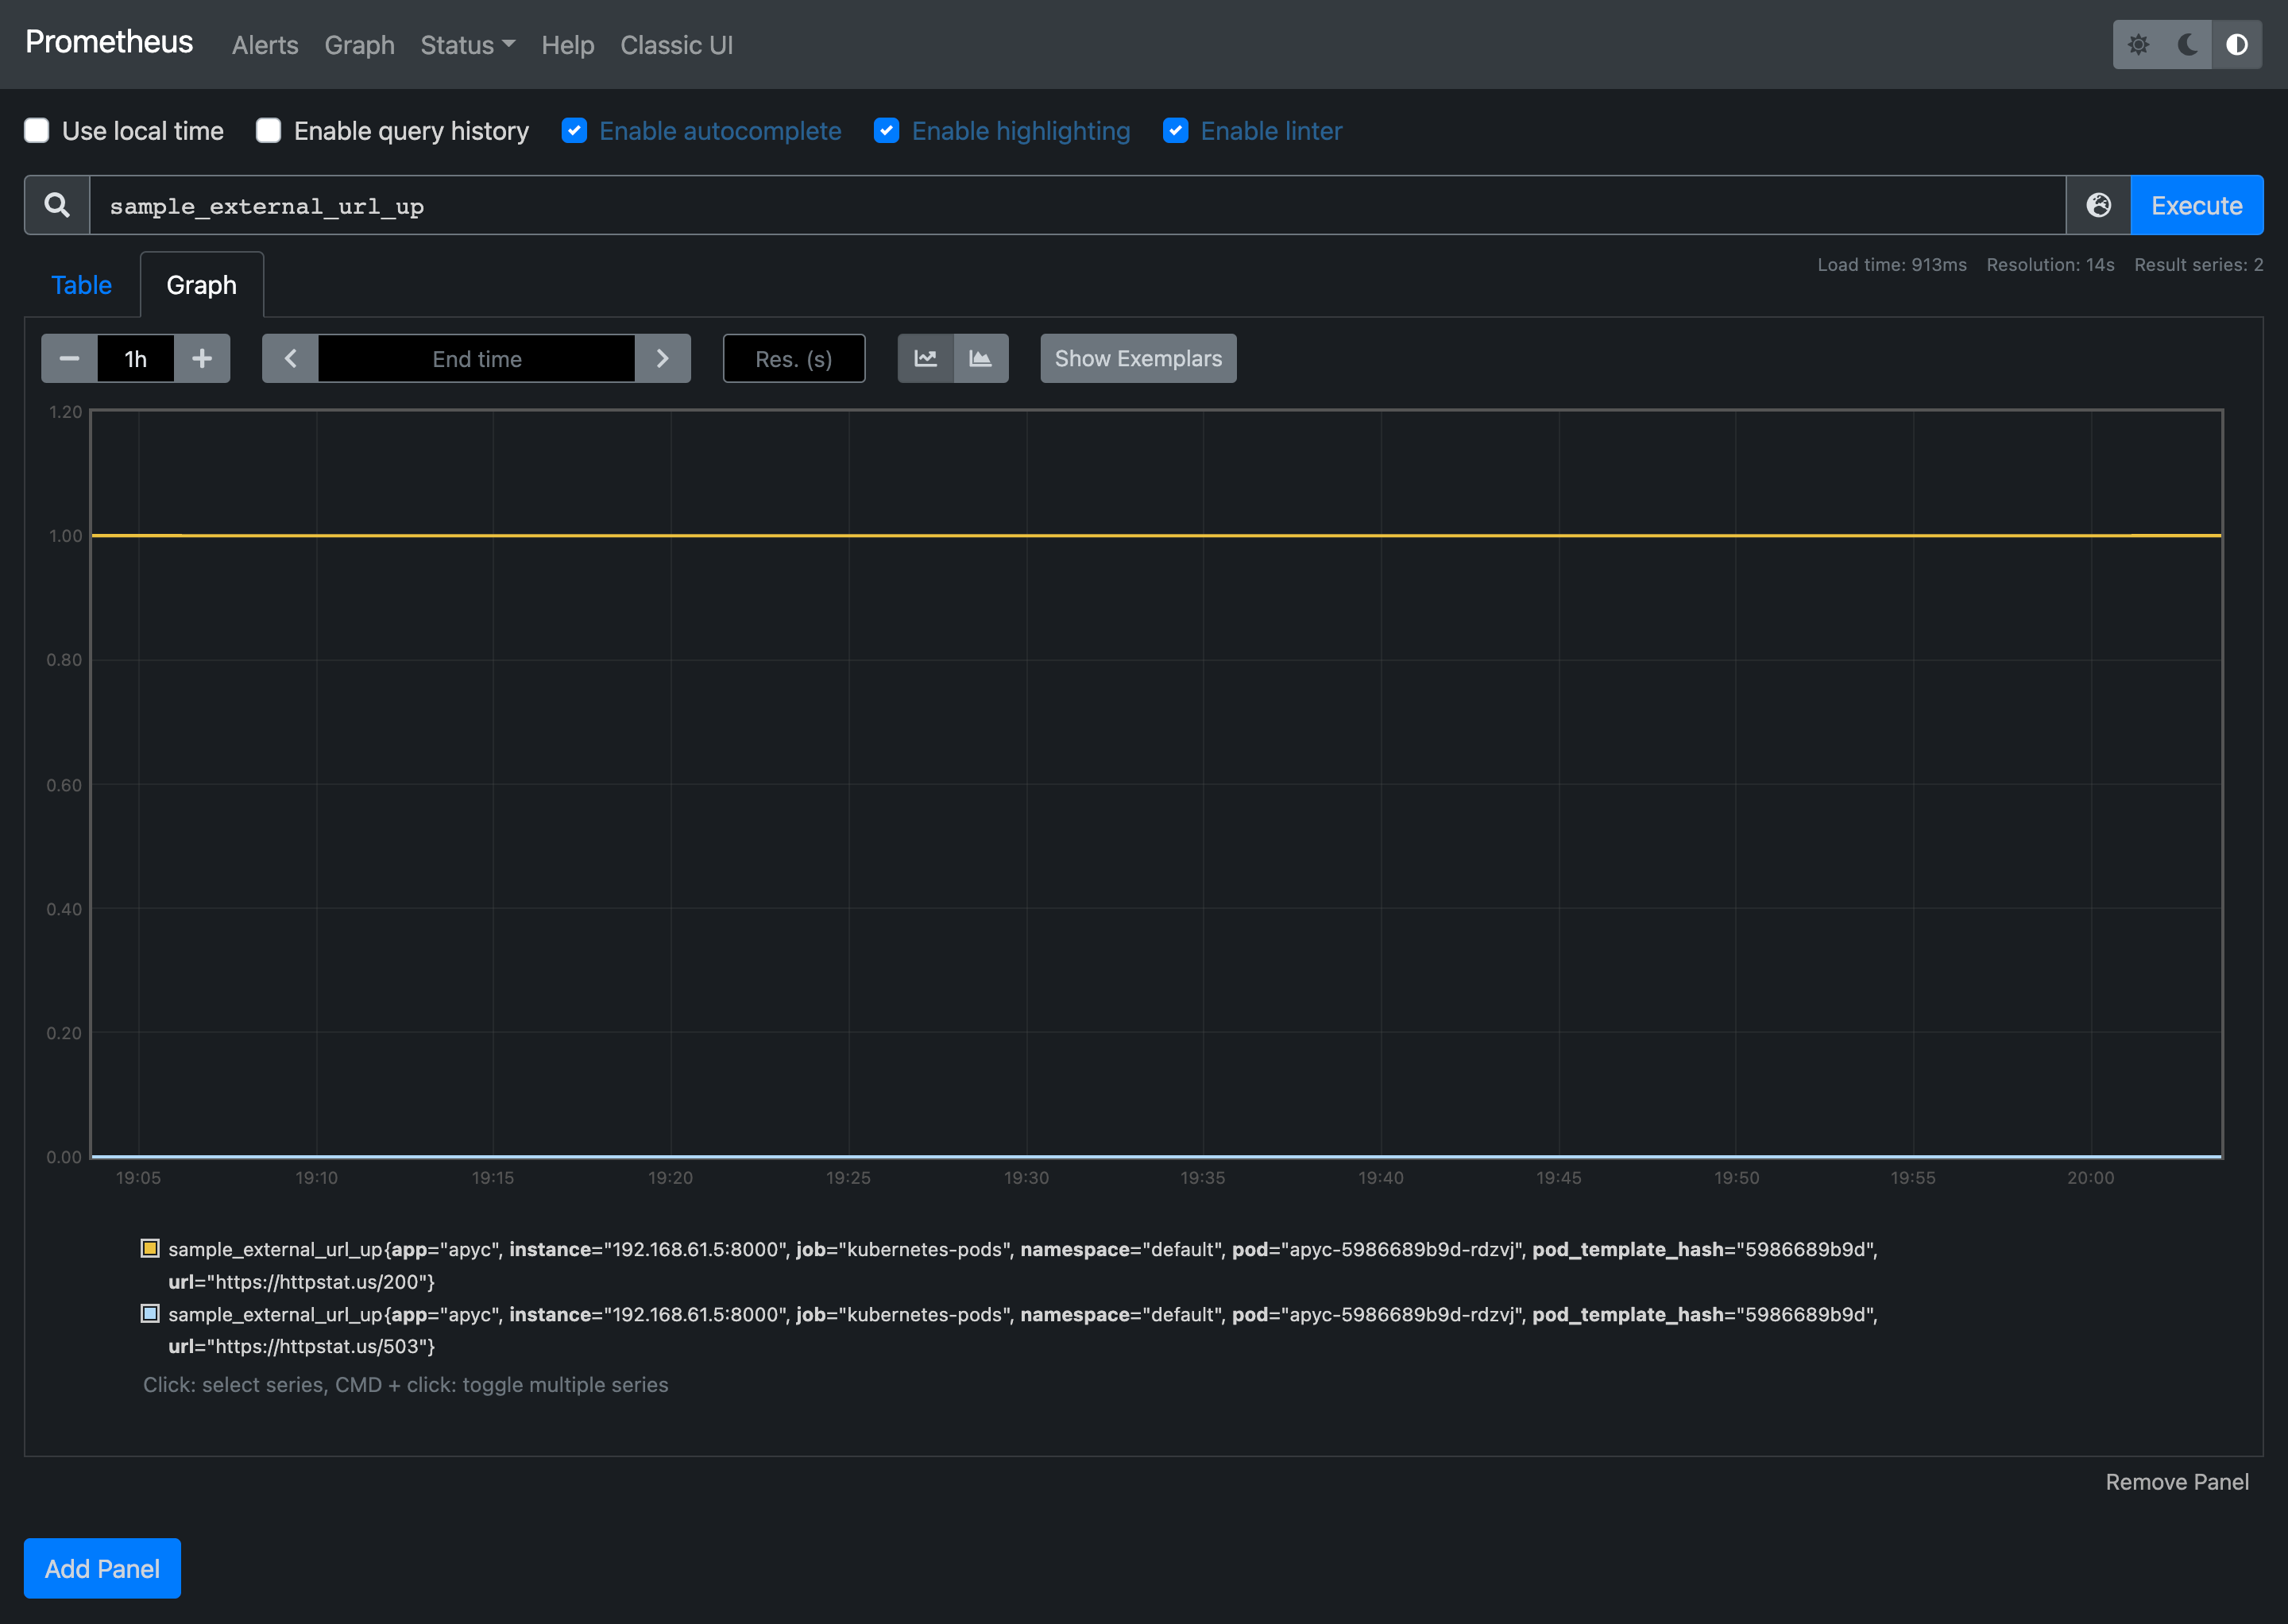
APyC Prometheus metric
sample_external_url_up -
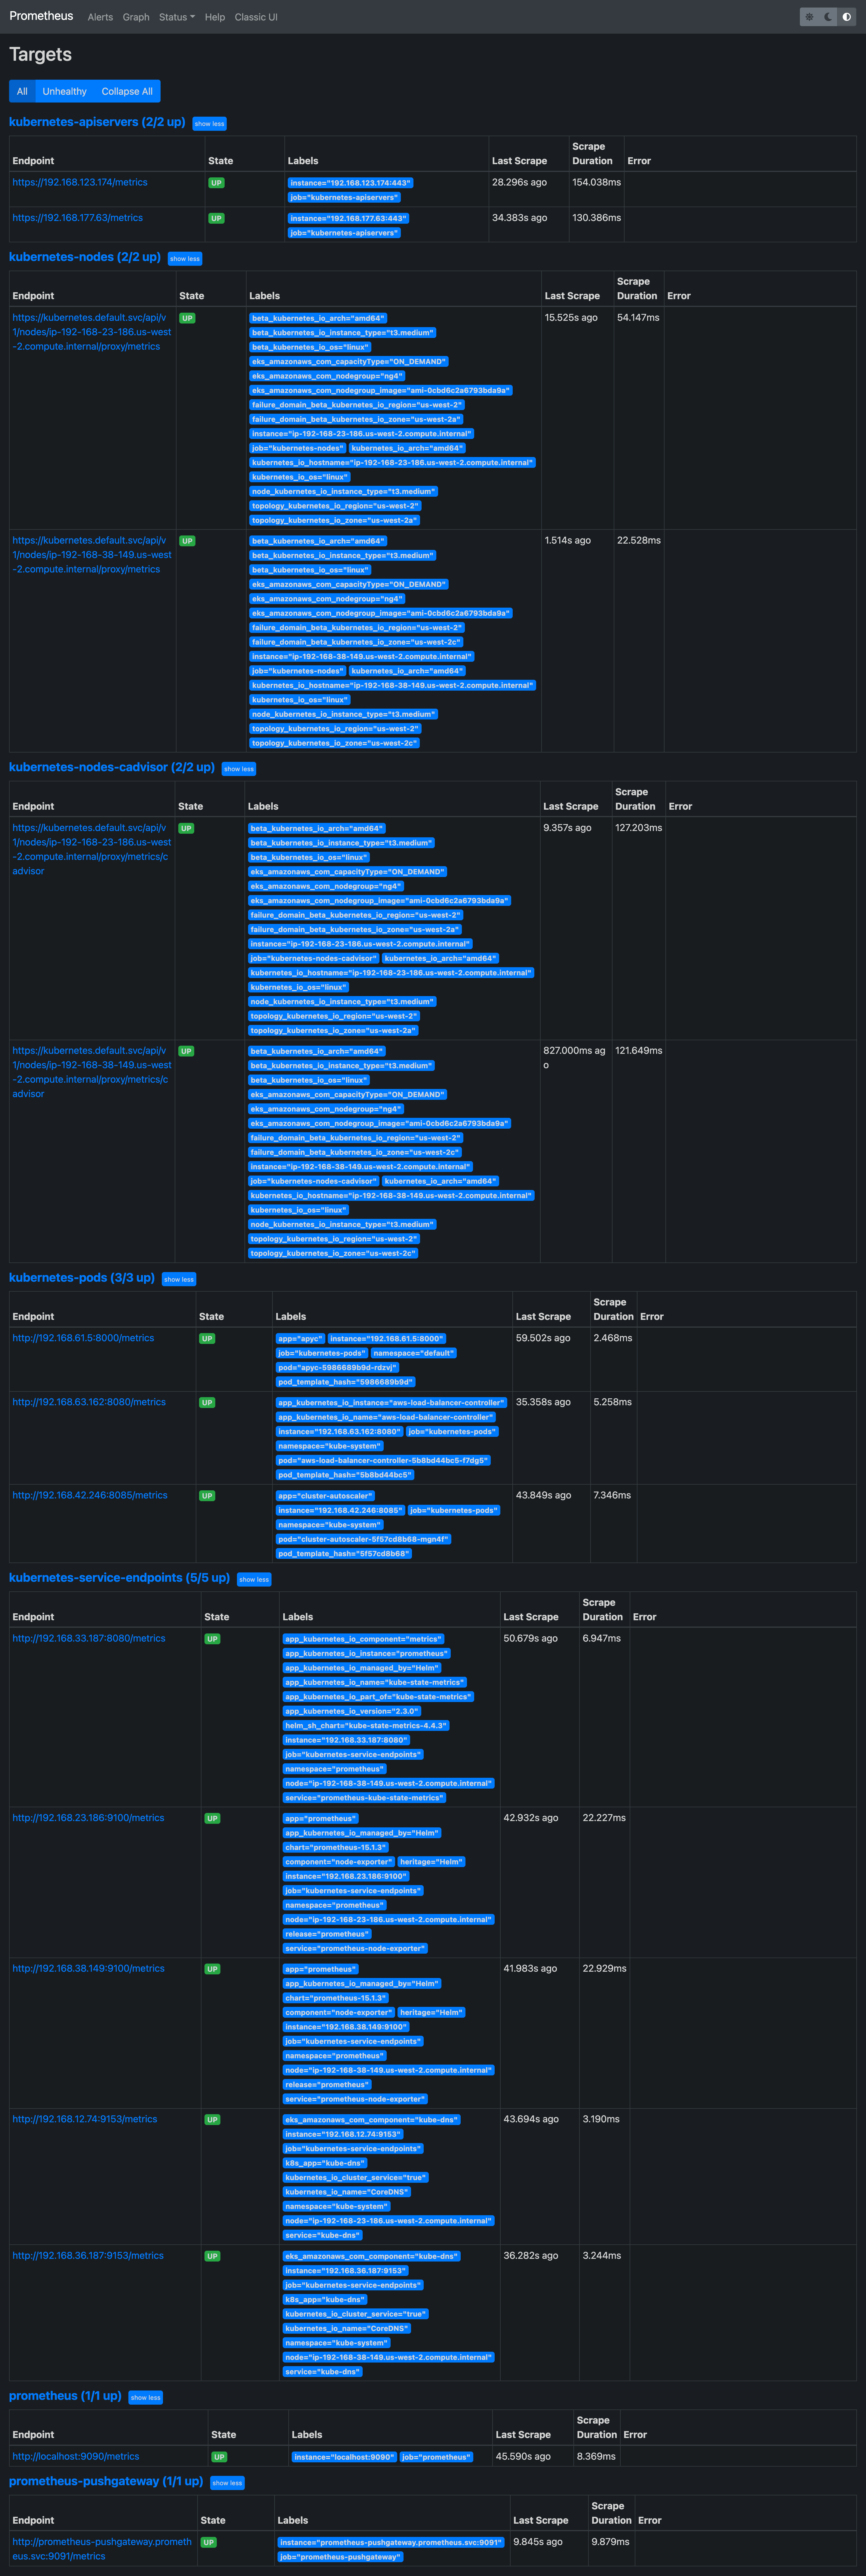
APyC as Prometheus Target
Questions or Something not working?
Please feel free to raise a GitHub issue


