Liquify: fast, multi-threaded visualization of stream data with ChartJS & Angular.
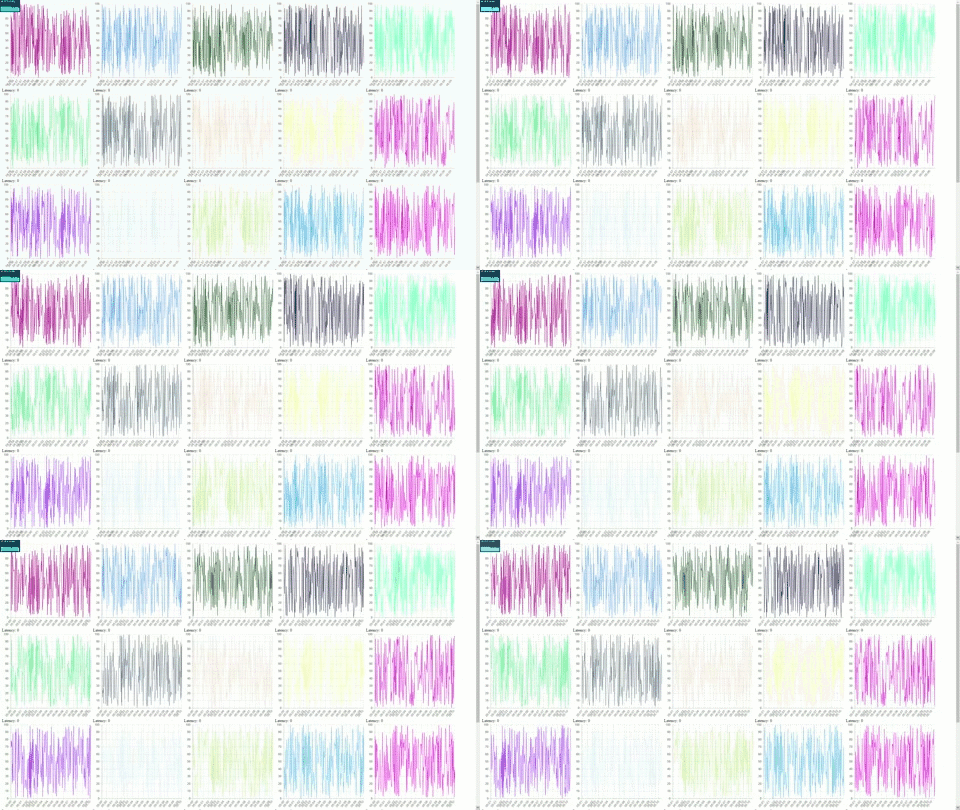
The aim of Liquify is to provide a fast, customizable and easy way to use the ChartJS library to show and update many charts that consume stream data from web socket. Liquify may display and update 50 to 100 charts with enjoyable frame rates. See performance measurements below.
Liquify is built as an Angular library, that has two main parts: the liquify component, that provides the API of the library, and the webworker, that draws the chart.
The library supports the Angular applications, and it requires the installation of the ai/offscreen-canvas library. In order to display the charts, the webpage needs to be opened in a web browser, that supports the webworker and offscreen-canvas technologies and getting the 2D rendering context of the offscreen-canvas.
To install Liquify to your application, run:
npm install @sakos95/liquify
Add LiquifyModule to your app.module.ts:
@NgModule({
...
imports: [
    ...
    LiquifyModule
],
...
})
Add lib-liquify to your html code, and specify the input and output arguments:
<lib-liquify
    [addresses]="addresses"
    [xAxisType]="'time'"
    [yAxisType]="'linear'"
    [chartType]="'line'"
    [width]="width"
    [height]="height"
    [duration]="10000"
    [suspended]="false"
    [timeBackward]="false"
    [functionSource]="functionSource"
    [dataSetIDs]="dataSetIDs"
    [colors]="colors"
    [specialMessages]="specialMessages"
    (latency)="latencyHandler($event)"
></lib-liquify>
The input arguments of Liquify are the following:
- The addresses argument contains the websocket addresses that the component should connect to. The addresses argument must be a string array. This is a required argument, has no default value.
- The width and height contain the size of the chart in pixels. The default values are 600 and 300 respectively.
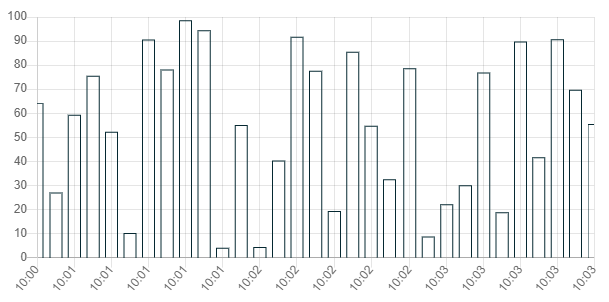
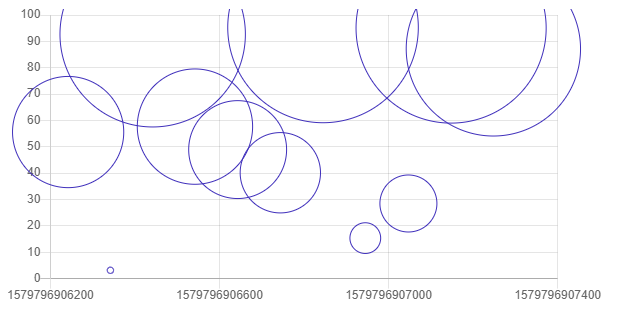
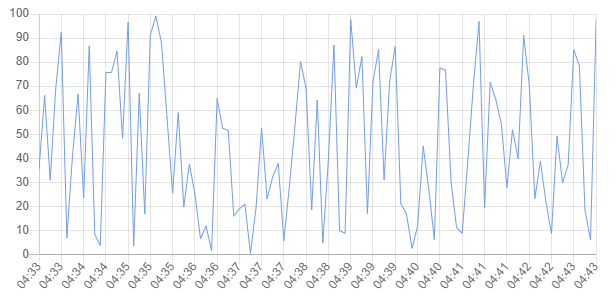
- The chartType is a string argument containing the type of the chart. There are three options to choose from: line, bar and bubble. By default "line" is used. An example for each can be seen on the images below.
-
The xAxisType and the yAxisType arguments select the type of data shown on the x-axis and y-axis:
- linear - The linear scale is used to chart numerical data. Linear interpolation is used to determine where a value lies on the axis.
- logarithmic - The logarithmic scale is used to chart numerical data. Logarithmic interpolation is used to determine where a value lies on the axis.
- time - The time scale is used to display times and dates.
By default "time" is used for the x axe and "linear" for y.
-
The timeBackward is a boolean argument, which can be used if the type of the x-axis is "time". If true the chart will show the actual time (when the data was measured), otherwise the time difference between the measurement and now. Defaults to false.
-
The suspended parameter can be used to turn off rendering, if it is not necessary. It's a boolean argument, defaults to false.
-
The dataSetIDs is an array of strings, which can be used to identify the different datasets. Since Liquify can connect to multiple websockets, and even a single websocket can send various kinds of data, dataSetIDs determine which elements belong together. The elements, that belong to the same dataset, will have the same color, and they will also form a line on the linechart. The default value is an array with a '0' string, so all elements belong together. For example, we might have sensors, that produce temperature and humidity data. The server could send those data on two websocket connections: one for the temperature and one for the humidity. In this case it would be a good idea to choose the addresses of the connections as dataSetIDs, and override the findDataSetID function to return the address, that the data element came from. But it is also possible, that both kinds of data is sent through a single websocket connection. In this case it would be a good idea to choose 'temperature' and 'humidity' as dataSetIDs, and override the findDataSetIDs to separate the received data into two datasets.
-
The colors argument is a Map, that assigns an array of numbers to each dataSetID. The arrays contain the RGB color codes: 3 numbers between 0 and 255. If this input is not specified or there is no assigned color to a dataSetID, a random color will be used.
-
The duration argument declares the time interval in which data will be visualized. It's a number argument, the user can specify in milliseconds how long should the measurements remain on the chart.
-
The specialMessages must be a Map, which can assign a string to every address. If there is a string assigned to an address, then the message will be sent to that address automatically. This can be useful, if the server can accept special commands to filter, or reduce the data, that it sends.
-
The functionSource argument must implement the FunctionOverrideInterface defined in Liquify. The user can override the convertMessageToData, checkData and findDataSetID functions.
The latency output argument can be handled by function, that takes the emitted event as an argument. The latency argument returns the time difference between the measurement time of the latest data and the current time of the computer. It can be useful to keep track of how much time it takes to an element of data to get from the server to the client. It can also be useful for debugging purposes. For example, it can reveal, if the server is slow, or sends outdated data.
I measured the performance of Liquify with the help of the stats.js library. The test project created the given number of charts on the same page. At first it used Chart.js without webworkers, and then it used Liquify with webworkers. Then the charts connected to the test server, which started sending new data points to the charts. The test server ran with two different settings. At first it was set to produce a new data point every 100 millisecond. Then it was set to produce a new data point every 10 milliseconds. After the page was loaded, all the charts connected, and the charts received more than 10 seconds of data, I measured the average frame per second (FPS) of a 10-second time interval.
The following results were measured on a HP Probook 470 G1, that had the following specs:
- CPU: Intel Core i7-4702MQ
- RAM: 8 GB
- GPU: Intel HD 4600
| Number of Charts | Data frequency | Average FPS | Average FPS |
| without worker | with worker | ||
| 1 | 100 ms | 59.9 | 60.1 |
| 2 | 100 ms | 41.7 | 59.9 |
| 3 | 100 ms | 33.3 | 59.8 |
| 5 | 100 ms | 24.1 | 59.7 |
| 10 | 100 ms | 14.2 | 59.1 |
| 20 | 100 ms | 9.3 | 50.4 |
| 30 | 100 ms | 4.7 | 50.1 |
| 50 | 100 ms | 2.2 | 43.0 |
| 100 | 100 ms | 0.8 | 17.7 |
| 1 | 10 ms | 14.1 | 60.0 |
| 5 | 10 ms | 5.1 | 59.4 |
| 10 | 10 ms | 3.9 | 55.6 |
| 20 | 10 ms | 0.6 | 45.0 |
| 30 | 10 ms | 0.4 | 38.2 |
| 50 | 10 ms | 0.09 | 35.8 |
| 100 | 10 ms | 0.01 | 15.8 |
The automated tests run in Google Chrome, so it should be installed on your computer.
Before starting the development of Liquify, the source code has to be cloned with a version control system, and its packages have to be installed by issuing the "npm install" command from the library of the workspace. There are 3 projects in the workspace:
- The liquify project contains the library itself. It is located in the projects/liquify folder. This includes the LiquifyComponent Angular component, that provides the API of the library, the ChartWorker class, that provides the code of the worker, the FunctionOverrideInterface interface, that can be overriden by the user, and its default implementation, the DefaultFunctionSources class.
- The test_server project can be found in the projects/liquify/src/test_server folder. This provides a locally runnable server, that can provide data to testing.
- The test-liquify project provides a simple Angular application, that can be found in the projects/test-liquify folder. It can be used to run tests, that include multiple charts on the same webpage.
Build and run the test server before running tests:
cd ./projects/liquify/src/test_server
npm install
npm run build
npm start
You can run automated tests with the following command
ng test liquify
For performance measurements you can use the test-liquify project:
 cd ./projects/test-liquify
 npm install
 ng serve --open
ng build liquify --prod
cd dist/liquify
npm init
npm pack
npm login
npm publish --access=public
Liquify is built as an Angular library, that has two main parts:
- The liquify component, that provides the custom HTML tag, which is basically the API of the library.
- The offscreen-canvas library is used to create the webworker.
- The webworker, responsible for drawing the chart.
- The Chart.js library is used to visualize the charts.
- The webworker connects to the data server through websockets, receives the messages and processes them and draws the chart.
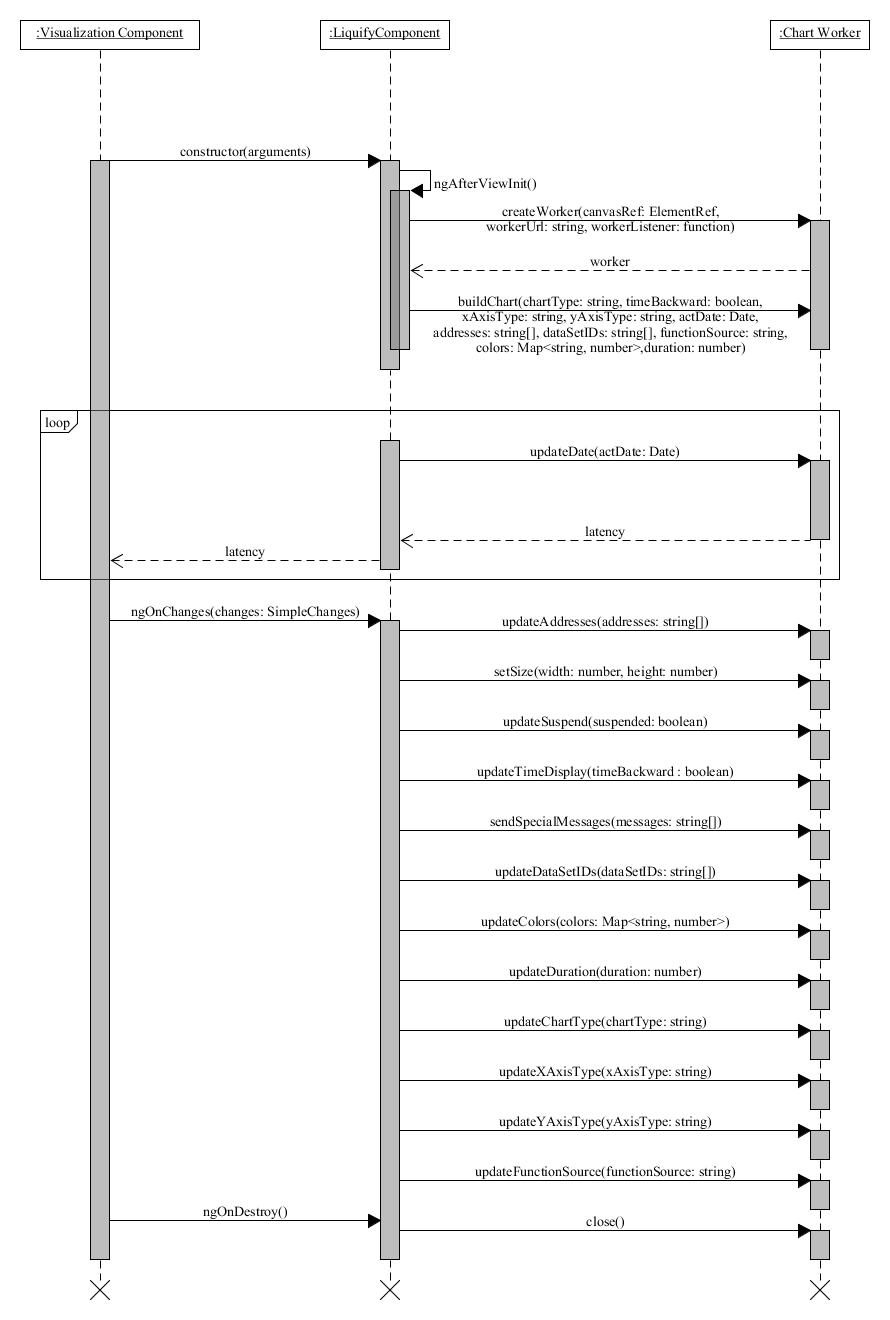
When the liquify component is created it creates a webworker with the given arguments using the offscreen-canvas library, while also sending the buildChart message, so that the worker builds the chart on the provided canvas. When the input arguments change the component sends a message to the worker containing the updated arguments. When the component is destroyed, it sends a close message to the worker.
The chart-worker part connects to the given websocket addresses, processes the received data, draws and updates the chart, handles the messages of the liquify component, and regularly sends back the latency to the liquify component.
The typical messages among a container component, the Liquify component and the worker
The worker handles the following messages:- buildChart: The worker stores the received input arguments, imports the overridden functions. Thereafter it connects to the given addresses using the connectToAddresses method, and builds the chart with the buildChart method. Finally it sets a repeating timer to render the chart every 30 millisecond using renderChart method.
- setSize: calls the setSize method to set the chart size to the given width and height.
- updateDate: updates the actDate attribute with the given value.
- updateDataSetIDs: updates the dataSetIDs attribute with the given value, and calls updateDataSetIDs method to create new datasets on the chart to the new datasets.
- updateColors: calls the updateColors function, which updates the colors on the chart.
- updateDuration: stores the new duration value.
- updateAddresses: invokes the updateAddresses function to update connections.
- updateChartType: stores the new chartType value, and changes the chartType of the chart.
- updateXAxisType: stores the new xAxisType value, and changes the xAxisType of the chart.
- updateYAxisType: stores the new yAxisType value, and changes the yAxisType of the chart.
- updateFunctionSource: imports the new overridden functions.
- renderChart: renders the chart, if it is not suspended.
- sendSpecialMessages: calls the sendSpecialMessages function, which sends the new messages to the given addresses.
- timeBackward: stores the new timeBackward value.
- suspended: stores the new suspended value.
- close: The worker clears the rendering interval, closes the connections using the closeConnections method, destroys the chart and stops the worker.
The worker uses the functions of the FunctionOverrideInterface, which can be overridden.
The FunctionOverrideInterface contains the following functions:
- checkData(latestStatus): If a message is received from a connection, the checkData function is called to check whether the received data is valid. It must return a boolean value.
- findDataSetID(latestStatus, address): If the message is valid, the findDataSetID method is invoked. It uses the received message and the address, where the message came from, to determine the dataSetID, which the message belongs to.
- convertMessageToData(data): Before the received data can be drawn on the chart, the message is converted to the proper format using the convertMessageToData function. The function returns an object with the following attributes:
- measured: the measurement time of the data
- x: the x-axis value of the data
- y: the y-axis value of the data
- r: radius of the value -- if the chart is a bubble chart
We are looking for contributors! Please consider submitting a PR or your ideas for improvement!
If you are interested in support contact hello@enliven.systems
This project received funding from the Hungarian Government through EFOP-3.6.3-VEKOP-16-2017-00002: "Integrált kutatói utánpótlás-képzési program az informatika és számítástudomány diszciplináris területein" as well as support from Enliven Systems (https://enliven.systems).
