The goal here is to setup CloudWatch metric filters to analyze the data captured by HAProxy.
The Terraform files to create the HAProxy server along with some backends and clients for testing can be found in the previous repo.
A custom JSON log format will be introduced here to take advantage of the querying syntax provided for JSON objects by CloudWatch.
Note that in this scenario HAProxy is being used in HTTP mode (mode http) which allows access to the HTTP specific variables such as request method, status code, etc.
The default HTTP format is defined this way:
log-format "%ci:%cp [%tr] %ft %b/%s %TR/%Tw/%Tc/%Tr/%Ta %ST %B %CC %CS %tsc %ac/%fc/%bc/%sc/%rc %sq/%bq %hr %hs %{+Q}r"
The HAProxy log file format will be changed to JSON format by specifying the following log-format options (nicely formatted here):
log-format '{"backend":{"name":"%b","concurrent_connections":%bc,"source_ip":"%bi","source_port":%bp,"queue":%bq},"bytes":{"read":%B,"uploaded":%U},"captured_headers":{"request":"%hr","response":"%hs"},"client":{"ip":"%ci","port":%cp},"cookie_captured":{"request":"%CC","response":"%CS"},"datetime":{"accept_date_milliseconds":%ms,"GMT":"%T","local":"%Tl","millisecond_resolution":"%t","GMT_start_of_HTTP_request":"%trg","local_start_of_HTTP_request":"%trl","timestamp":%Ts},"frontend":{"name":"%f","concurrent_connections":%fc,"ip":"%fi","port":%fp,"name_transport":"%ft","log_counter":%lc},"hostname":"%H","http":{"method":"%HM","request_uri_without_query_string":"%HP","request_uri_query_string":"%HQ","request_uri":"%HU","version":"%HV","unique_ID":"%ID","status_code":%ST,"request":"%r"},"number_of_retries":%rc,"pid":%pid,"process_concurrent_connections":%ac,"request_counter":%rt,"server":{"name":"%s","concurrent_connections":%sc,"ip":"%si","port":%sp,"queue":%sq},"ssl":{"cipher_used":"%sslc","version":"%sslv"},"termination":{"state":"%ts","state_with_cookie_status":"%tsc"},"timers":{"tr":"%tr","Ta":%Ta,"Tc":%Tc,"Td":%Td,"Th":%Th,"Ti":%Ti,"Tq":%Tq,"TR":%TR,"Tr":%Tr,"Tt":%Tt,"Tw":%Tw}}'
All the defined variables are captured in the above specified custom JSON log except for hrl and hsl which are represented by hl and hs respectively.
In addition, all the logged values are of type string except the following which are numeric (as specified in the HAProxy manual) to facilitate numeric operations on the queries (such as >=, <, =, etc.):
%bc, %bp, %bq, %B, %U, %cp, %ms, %Ts, %fc, %fp, %lc, %ST, %rc, %pid, %ac, %rt, %sc, %sp, %sq, %Ta, %Tc, %Td, %Th, %Ti, %Tq, %TR, %Tr, %Tt, %Tw
Since the JSON output could exceed the default allowed log length of 1024 characters, make sure the the haproxy.cfg file adjusts the len parameter as follows (example with 4096 chars allowed):
global
    log /dev/log len 4096 local0
    log /dev/log len 4096 local1 notice
Note: costs can be incurred when transferring data to CloudWatch. Use the following sections wisely!
In order to allow the EC2 instances to upload the HAProxy log file to CloudWatch, the following policy should be attached to the IAM role:
{
  "Version": "2012-10-17",
  "Statement": [
    {
      "Effect": "Allow",
      "Action": [
        "logs:CreateLogGroup",
        "logs:CreateLogStream",
        "logs:PutLogEvents",
        "logs:DescribeLogStreams"
    ],
      "Resource": [
        "*"
    ]
  }
 ]
}The CloudWatch Log Group /var/log/haproxy.log contains a Log Stream with the instance id (e.g. i-0405c293e05d0f5be).
May 4 20:23:01 ip-172-31-18-251 haproxy[14280]:
{
    "backend": {
        "name": "flask_app",
        "concurrent_connections": 0,
        "source_ip": "172.31.18.251",
        "source_port": 52094,
        "queue": 0
    },
    "bytes": {
        "read": 212,
        "uploaded": 125
    },
    "captured_headers": {
        "request": "{}",
        "response": "{}"
    },
    "client": {
        "ip": "172.31.13.247",
        "port": 36530
    },
    "cookie_captured": {
        "request": "-",
        "response": "-"
    },
    "datetime": {
        "accept_date_milliseconds": 529,
        "GMT": "04/May/2020:20:23:01 +0000",
        "local": "04/May/2020:20:23:01 +0000",
        "millisecond_resolution": "04/May/2020:20:23:01.529",
        "GMT_start_of_HTTP_request": "04/May/2020:20:23:01 +0000",
        "local_start_of_HTTP_request": "04/May/2020:20:23:01 +0000",
        "timestamp": 1588623781
    },
    "frontend": {
        "name": "https-in",
        "concurrent_connections": 1,
        "ip": "172.31.18.251",
        "port": 443,
        "name_transport": "https-in~",
        "log_counter": 16967
    },
    "hostname": "ip-172-31-18-251",
    "http": {
        "method": "GET",
        "request_uri_without_query_string": "/rest/user",
        "request_uri_query_string": "",
        "request_uri": "/rest/user",
        "version": "HTTP/1.1",
        "unique_ID": "-",
        "status_code": 200,
        "request": "GET /rest/user HTTP/1.1"
    },
    "number_of_retries": 0,
    "pid": 14280,
    "process_concurrent_connections": 1,
    "request_counter": 33934,
    "server": {
        "name": "flask",
        "concurrent_connections": 0,
        "ip": "172.31.36.108",
        "port": 8052,
        "queue": 0
    },
    "ssl": {
        "cipher_used": "TLS_AES_256_GCM_SHA384",
        "version": "TLSv1.3"
    },
    "termination": {
        "state": "--",
        "state_with_cookie_status": "----"
    },
    "timers": {
        "tr": "04/May/2020:20:23:01.538",
        "Ta": 5,
        "Tc": 3,
        "Td": 0,
        "Th": 9,
        "Ti": 0,
        "Tq": 9,
        "TR": 0,
        "Tr": 2,
        "Tt": 14,
        "Tw": 0
    }
}A list of defined variables that can be captured along with their types are found in the HAProxy Configuration Manual.
They are listed here for convenience.
Timings events in HTTP mode:
                 first request               2nd request
      |<-------------------------------->|<-------------- ...
      t         tr                       t    tr ...
   ---|----|----|----|----|----|----|----|----|--
      : Th   Ti   TR   Tw   Tc   Tr   Td : Ti   ...
      :<---- Tq ---->:                   :
      :<-------------- Tt -------------->:
                :<--------- Ta --------->:
Review the AWS documentation on Filter and Pattern Syntax in order to search through the log stream. Creating Metric Filters provides a good starting point on this topic as well.
The Terraform resources aws_cloudwatch_log_group and aws_cloudwatch_log_metric_filter are used to create log groups and metric filters respectively.
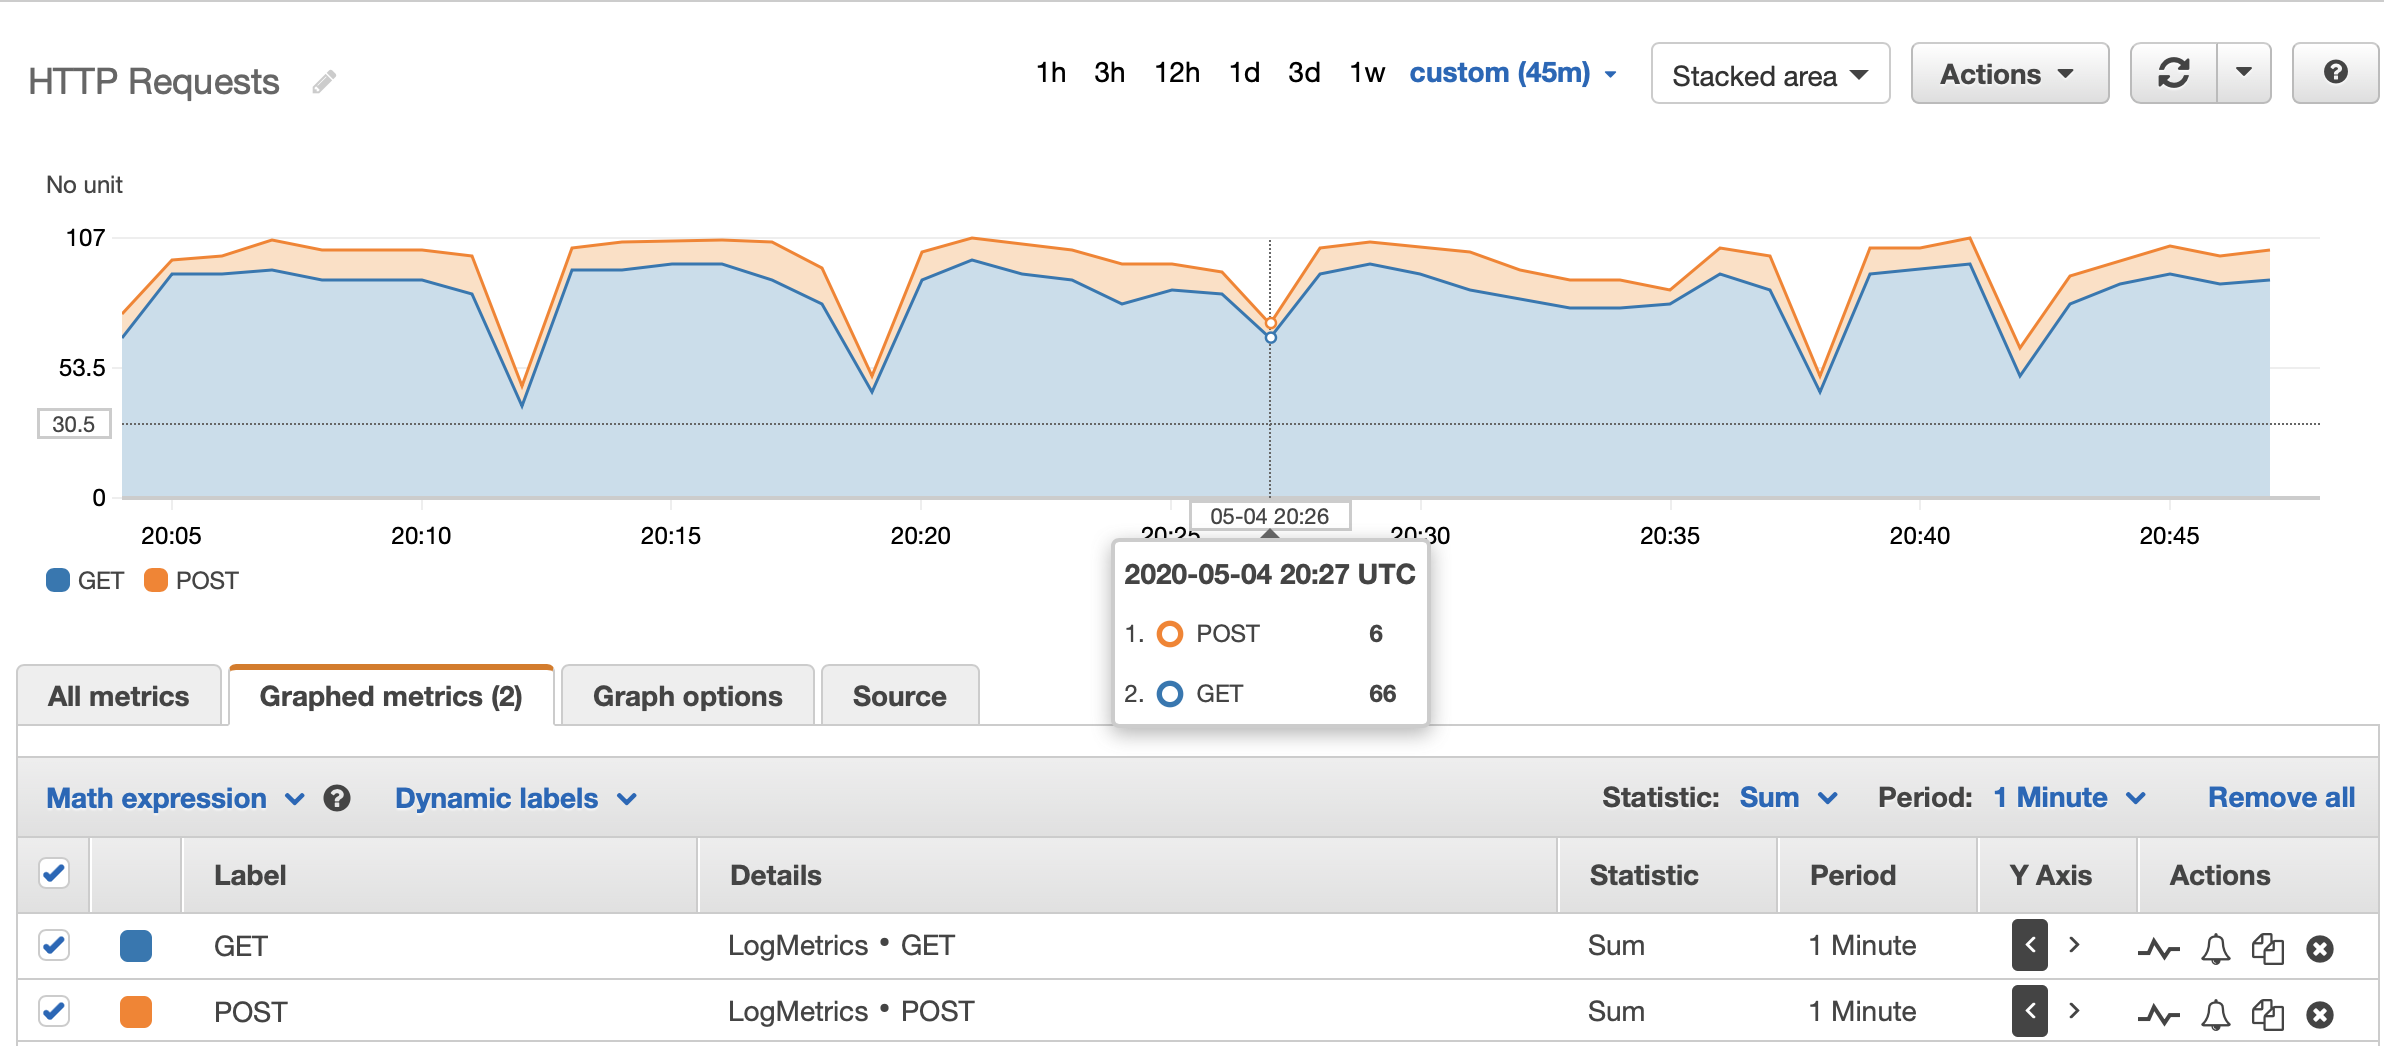
Below are some metric filters that were used (graphs shown in section below) by taking advantage of the newly formatted JSON HAProxy log:
- Number of GET HTTP requests
{ $.http.method = "GET" }
- Number of POST HTTP requests
{ $.http.method = "POST" }
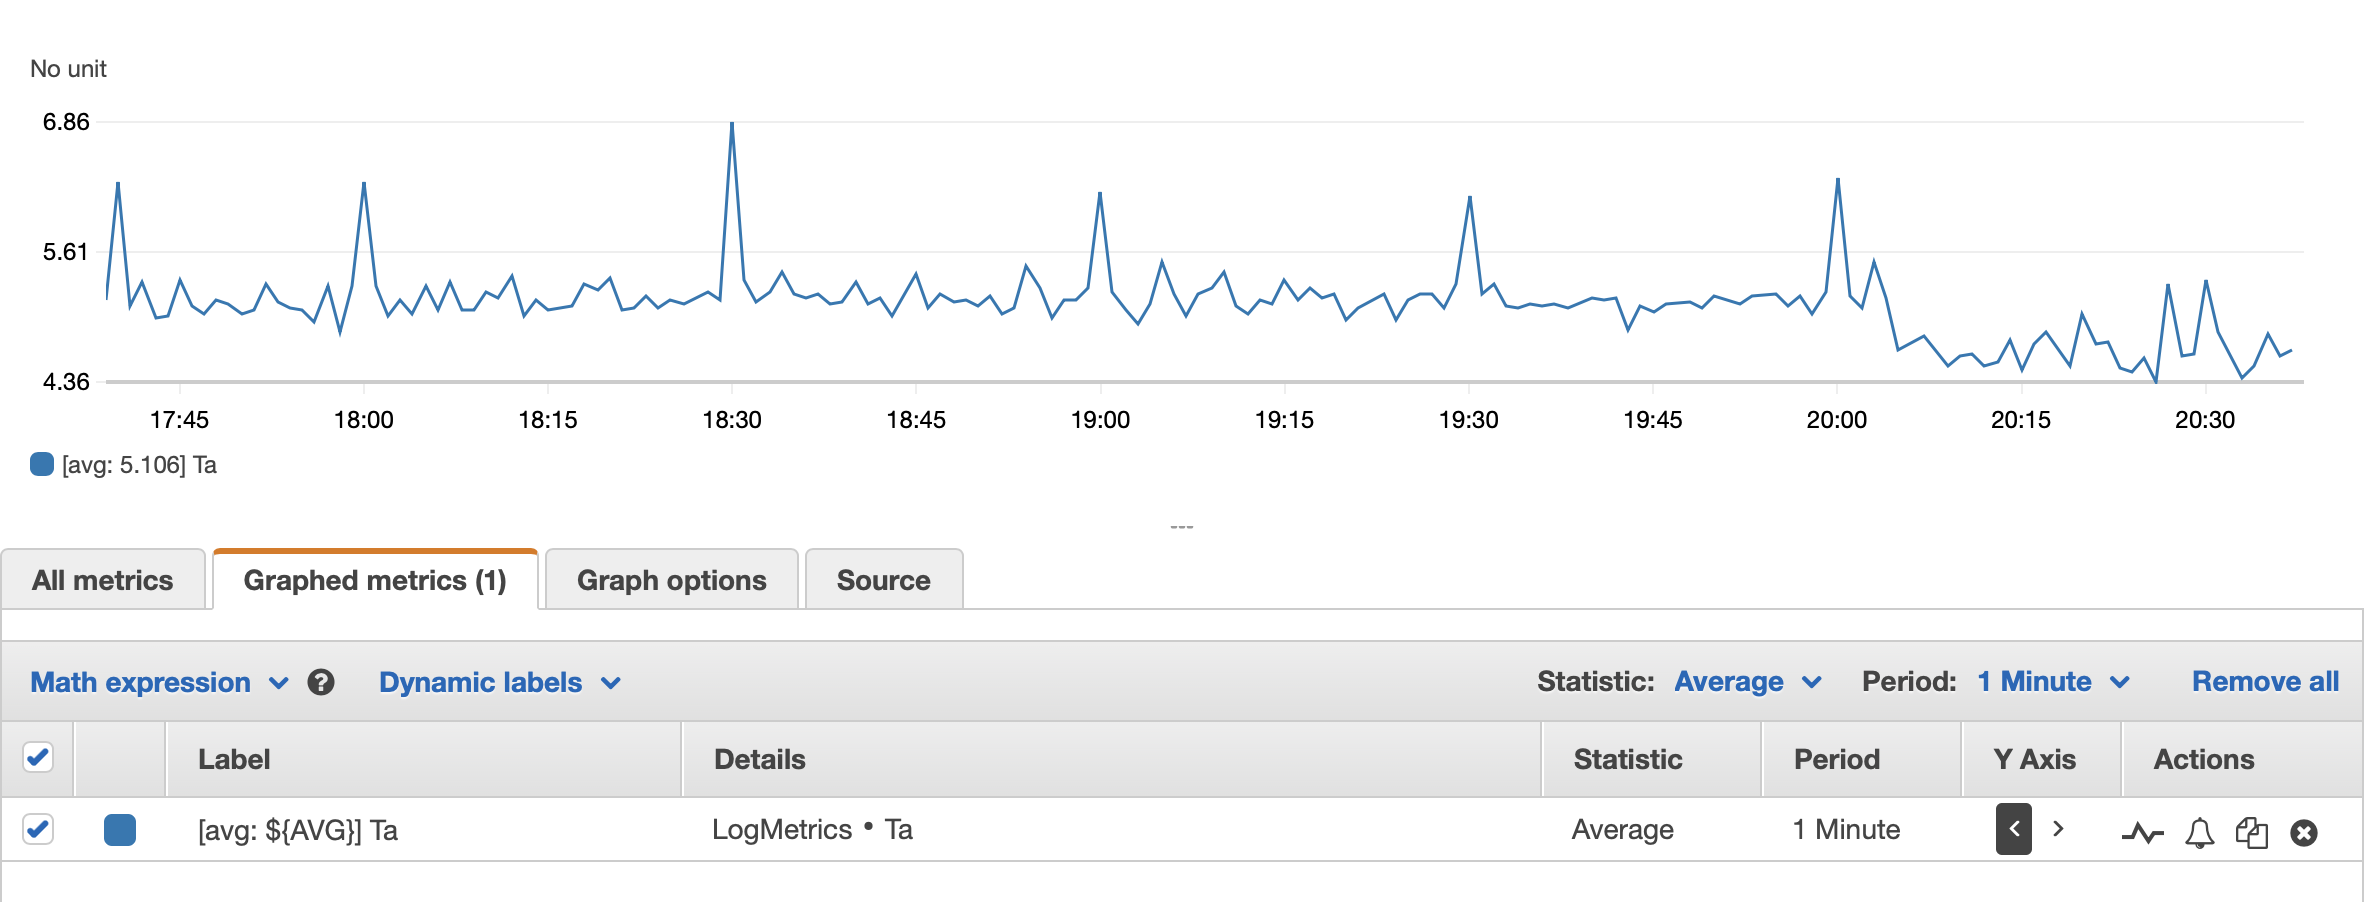
- Total active time for HTTP requests (metric value would be assigned as
$.timers.Ta)
{ $.timers.Ta = * }
Similarly, one can compose as many as needed such as:
- Number of HTTP requests with total active time > 6ms
{ $.timers.Ta > 6 }
- Number of HTTP requests with total bytes uploaded > 100
{ $.bytes.uploaded > 100 }
- Number of HTTP requests coming from internal IP addresses
{ ($.client.ip = "172.*" || $.client.ip = "10.*") }
Etc.
These are the metric filters that are implemented in this example:
Outputs:

http_method_metric_filters = [
  "GET HTTP requests.",
  "POST HTTP requests.",
  "PUT HTTP requests.",
  "DELETE HTTP requests.",
]
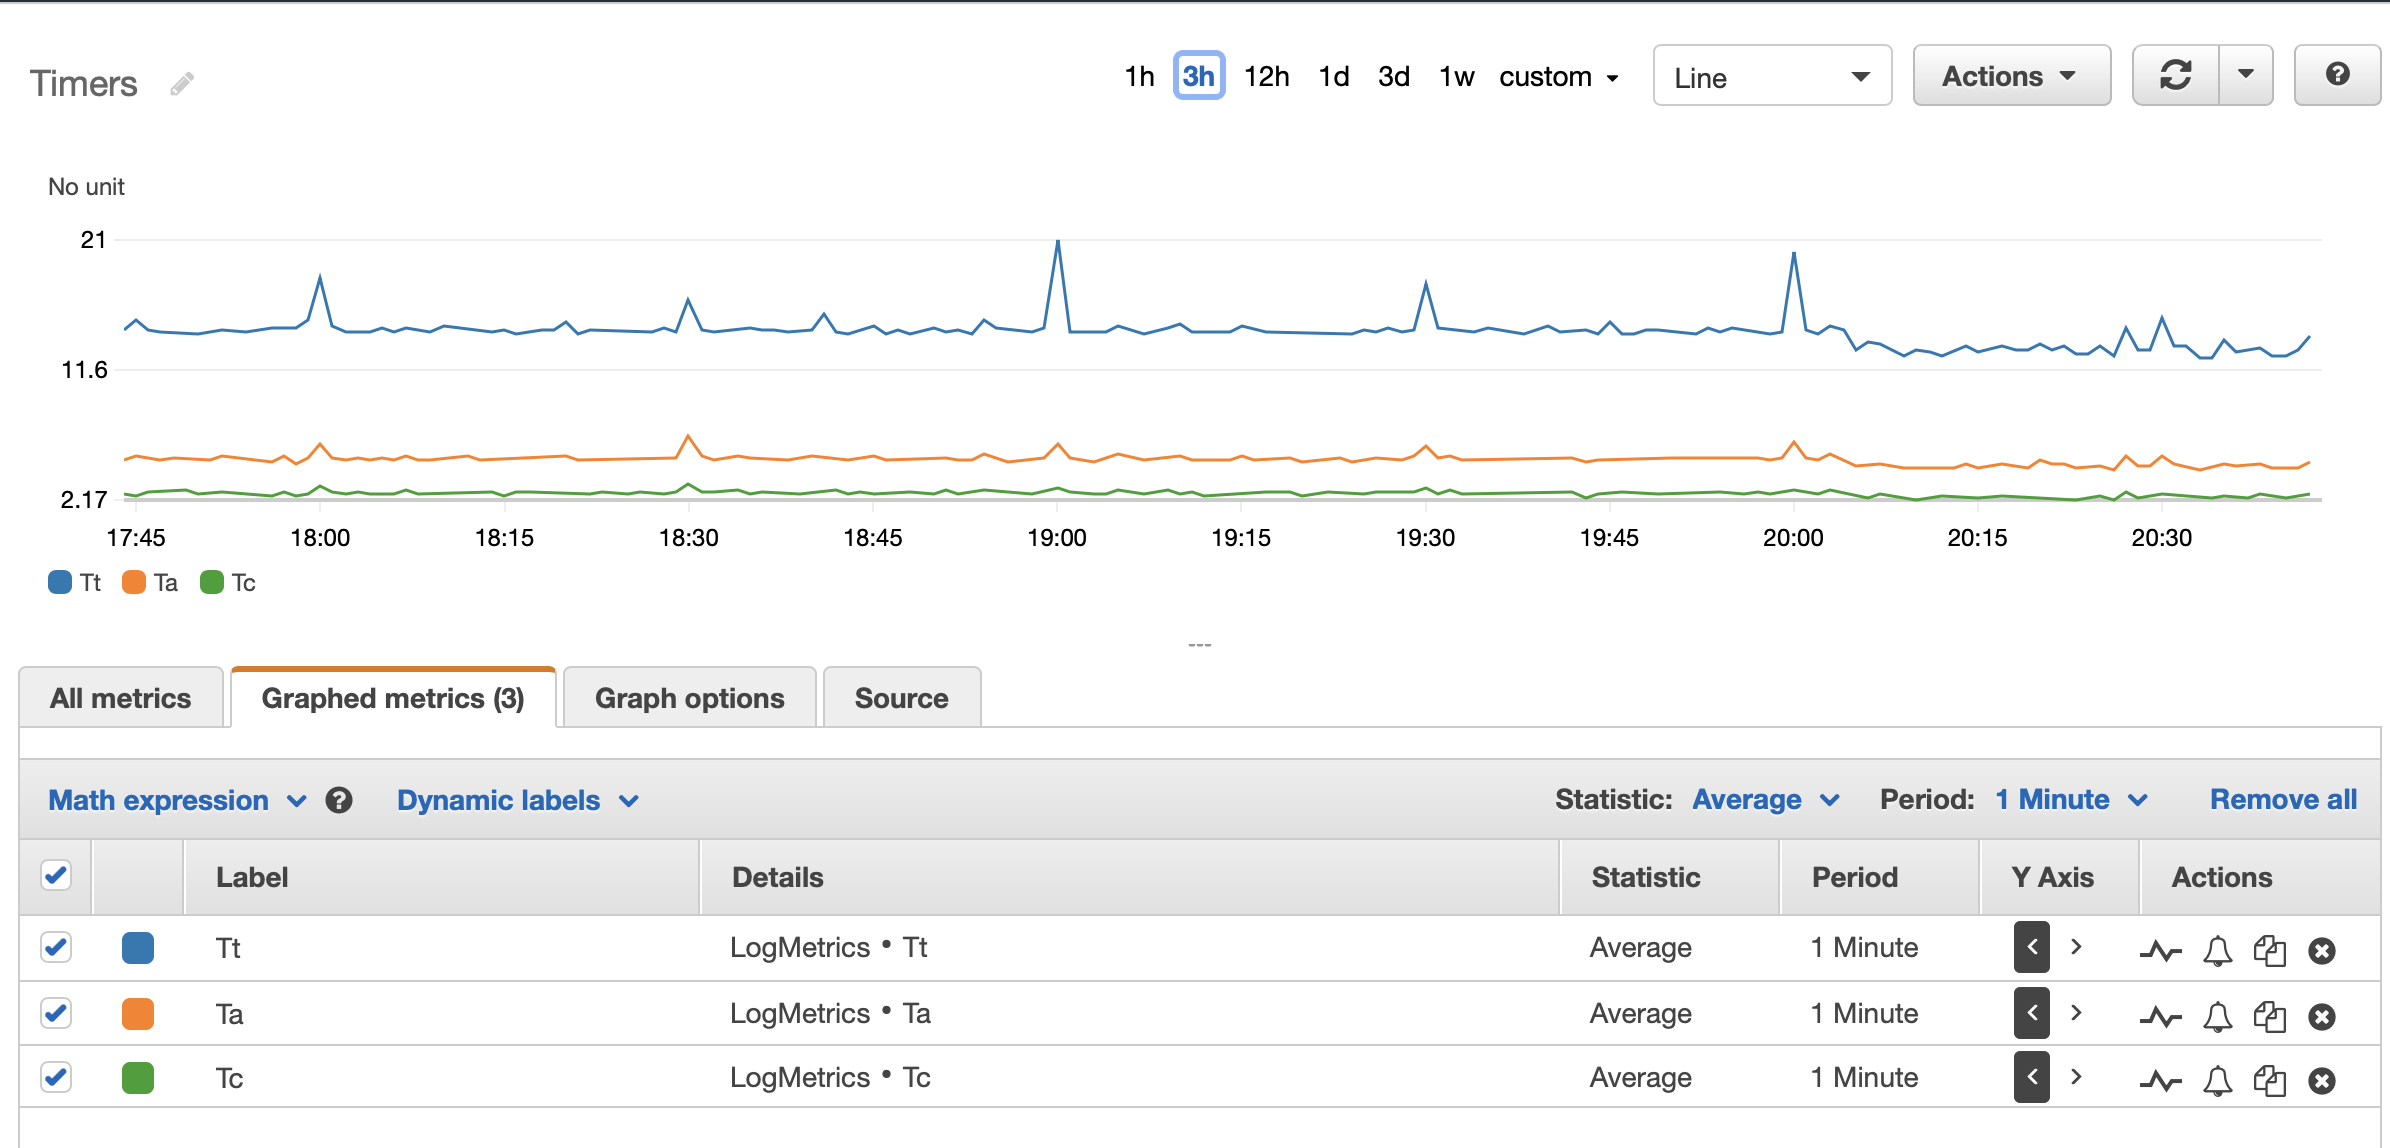
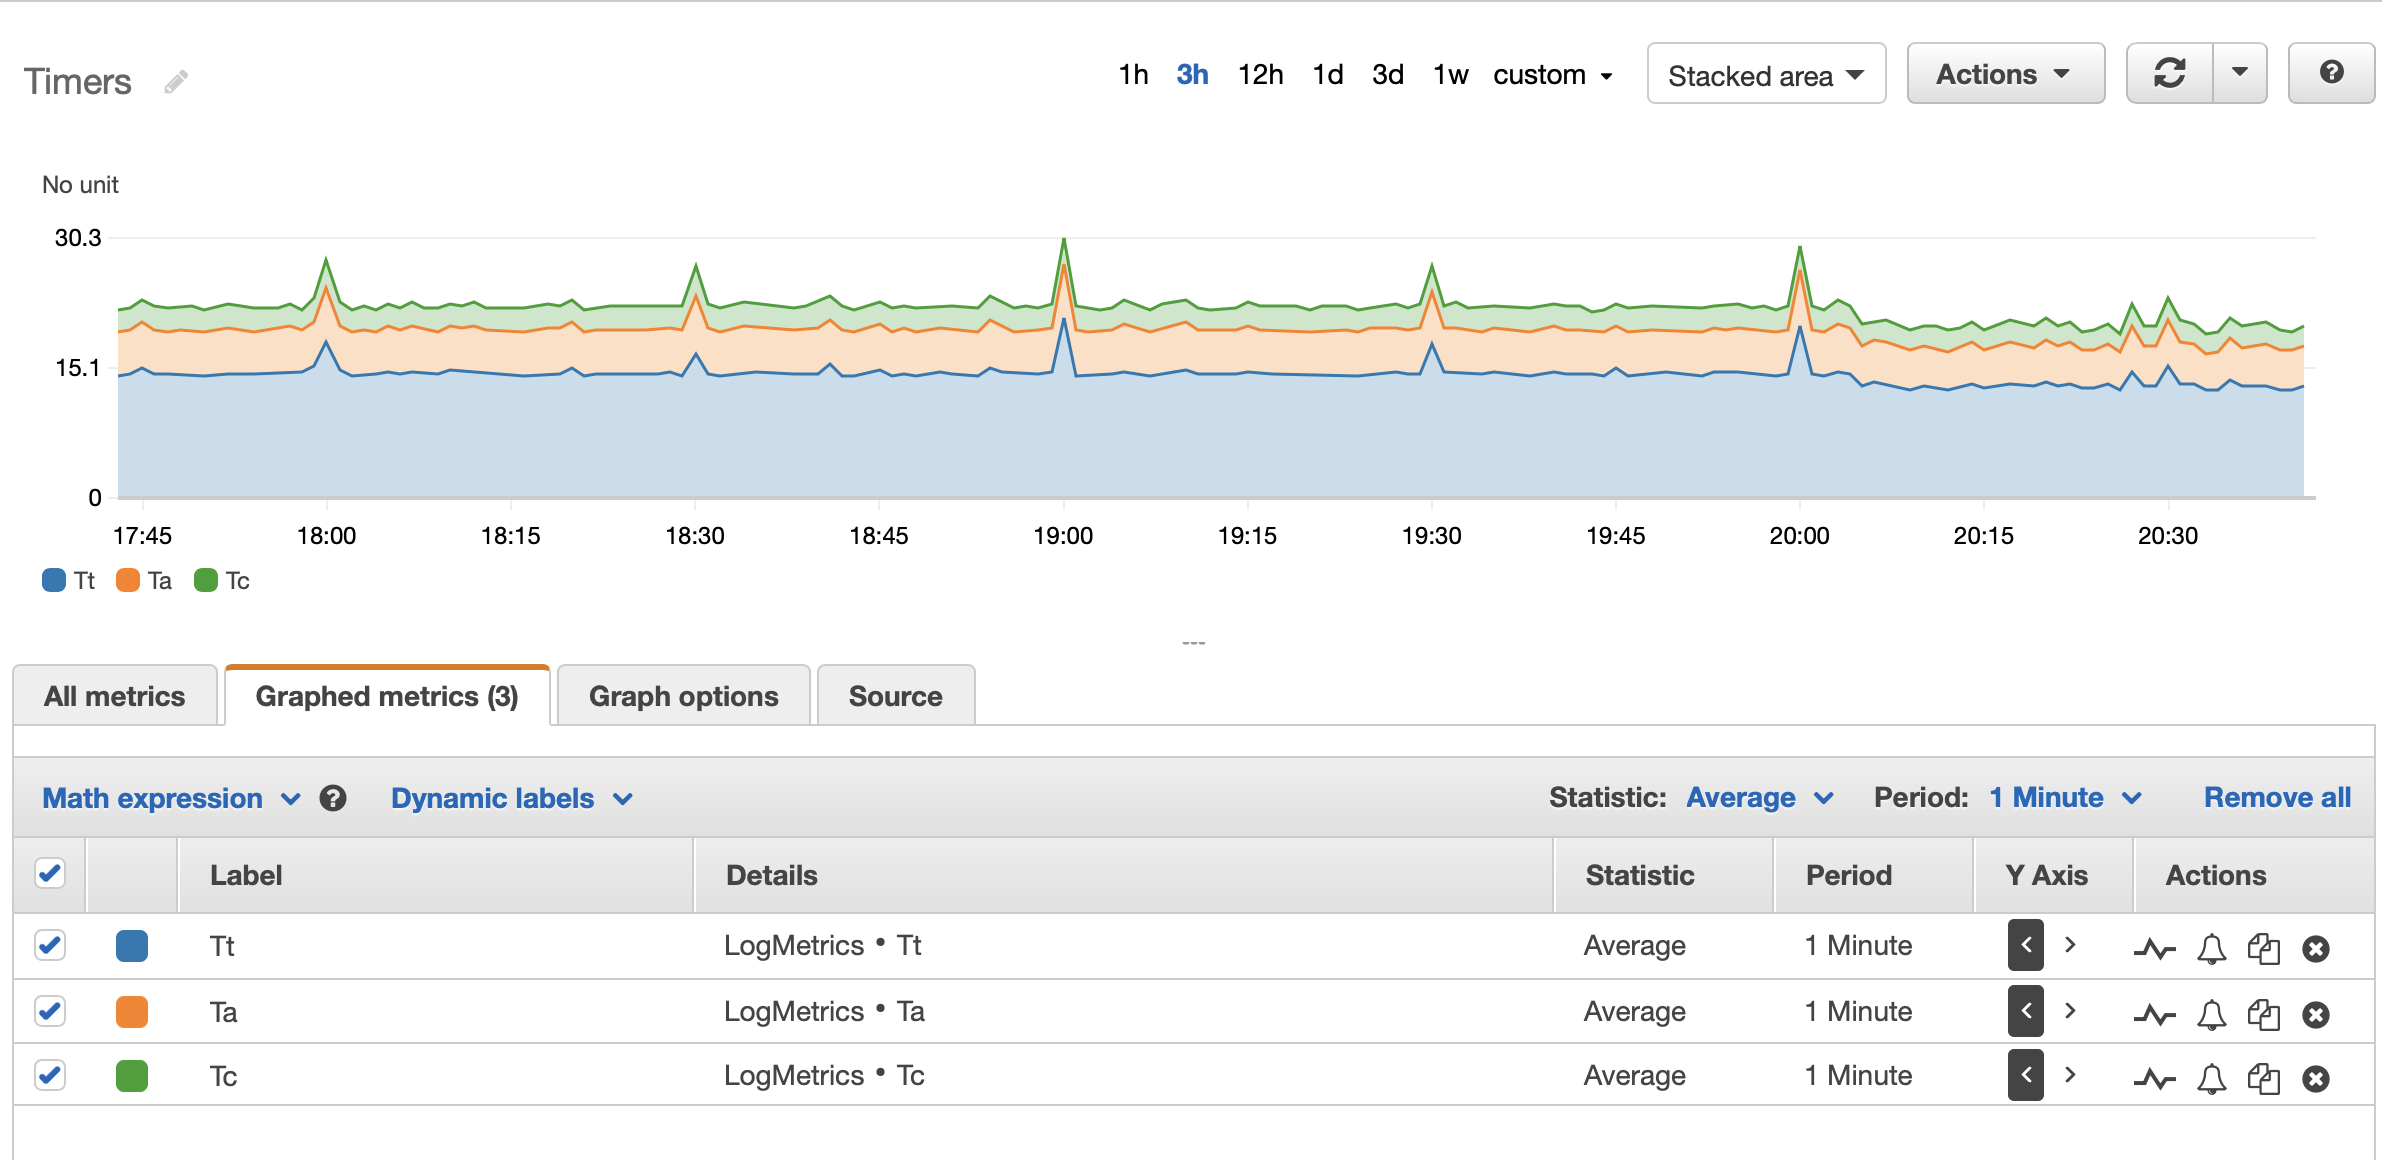
timers_metric_filters = [
  "Total time to get client request.",
  "Total time spent in queues waiting for a connection slot.",
  "Total time to establish the TCP connection to the server.",
  "Total active time for the HTTP request.",
  "Total TCP session duration time (from proxy accept till both ends were closed).",
]
- Stacked graph of GET and POST HTTP requests:
- Line graph of time of active HTTP requests:
- Line graph of timers:
- Stacked graph of timers:


