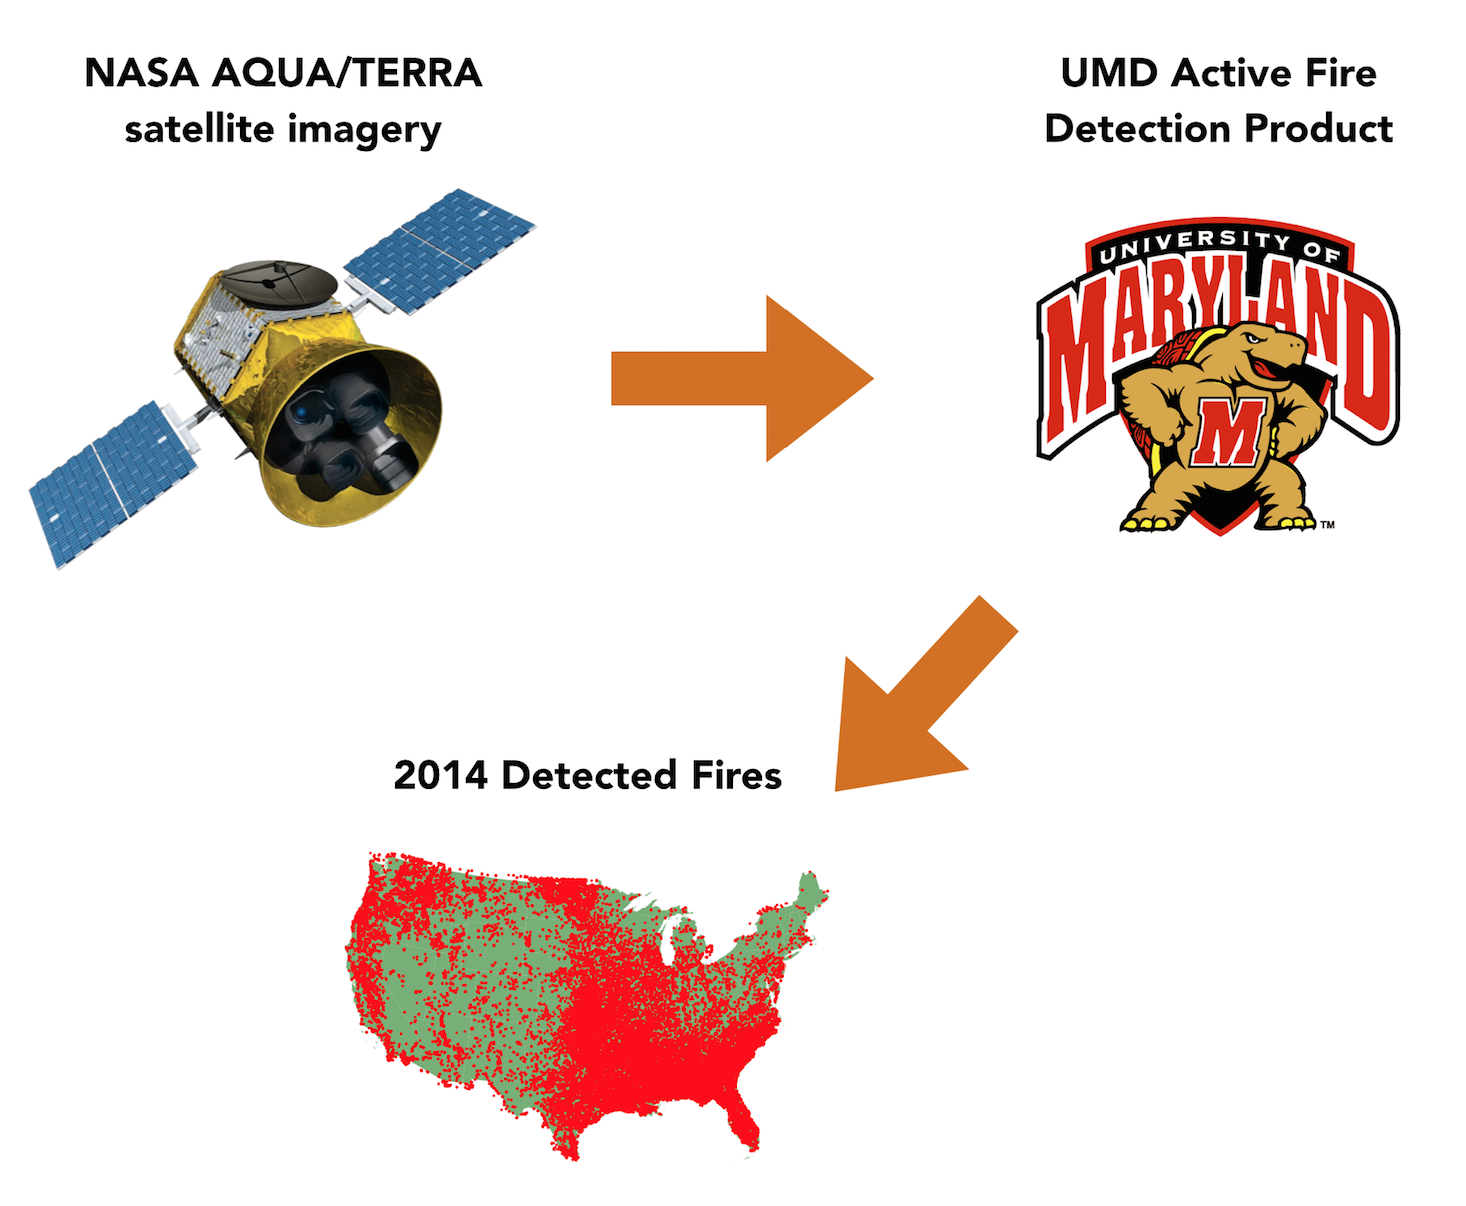
Hundreds of forest fires burned over 9 million acres of land in 2015, causing millions of dollars in property damage and immeasureable loss and pain to those families effected. Currently, satellite imagery of detected fires is not used in real-time to aid in forest fire protection. What if we could use that satellite imagery to aid in forest fire protection?
Each day, there are hundreds of satellite images from NASA's AQUA and TERRA satellites that are run through the UMD active fire product. The output of this active fire product is a data set that holds hundreds of 'detected fires' at given latitude/longitude coordinates.
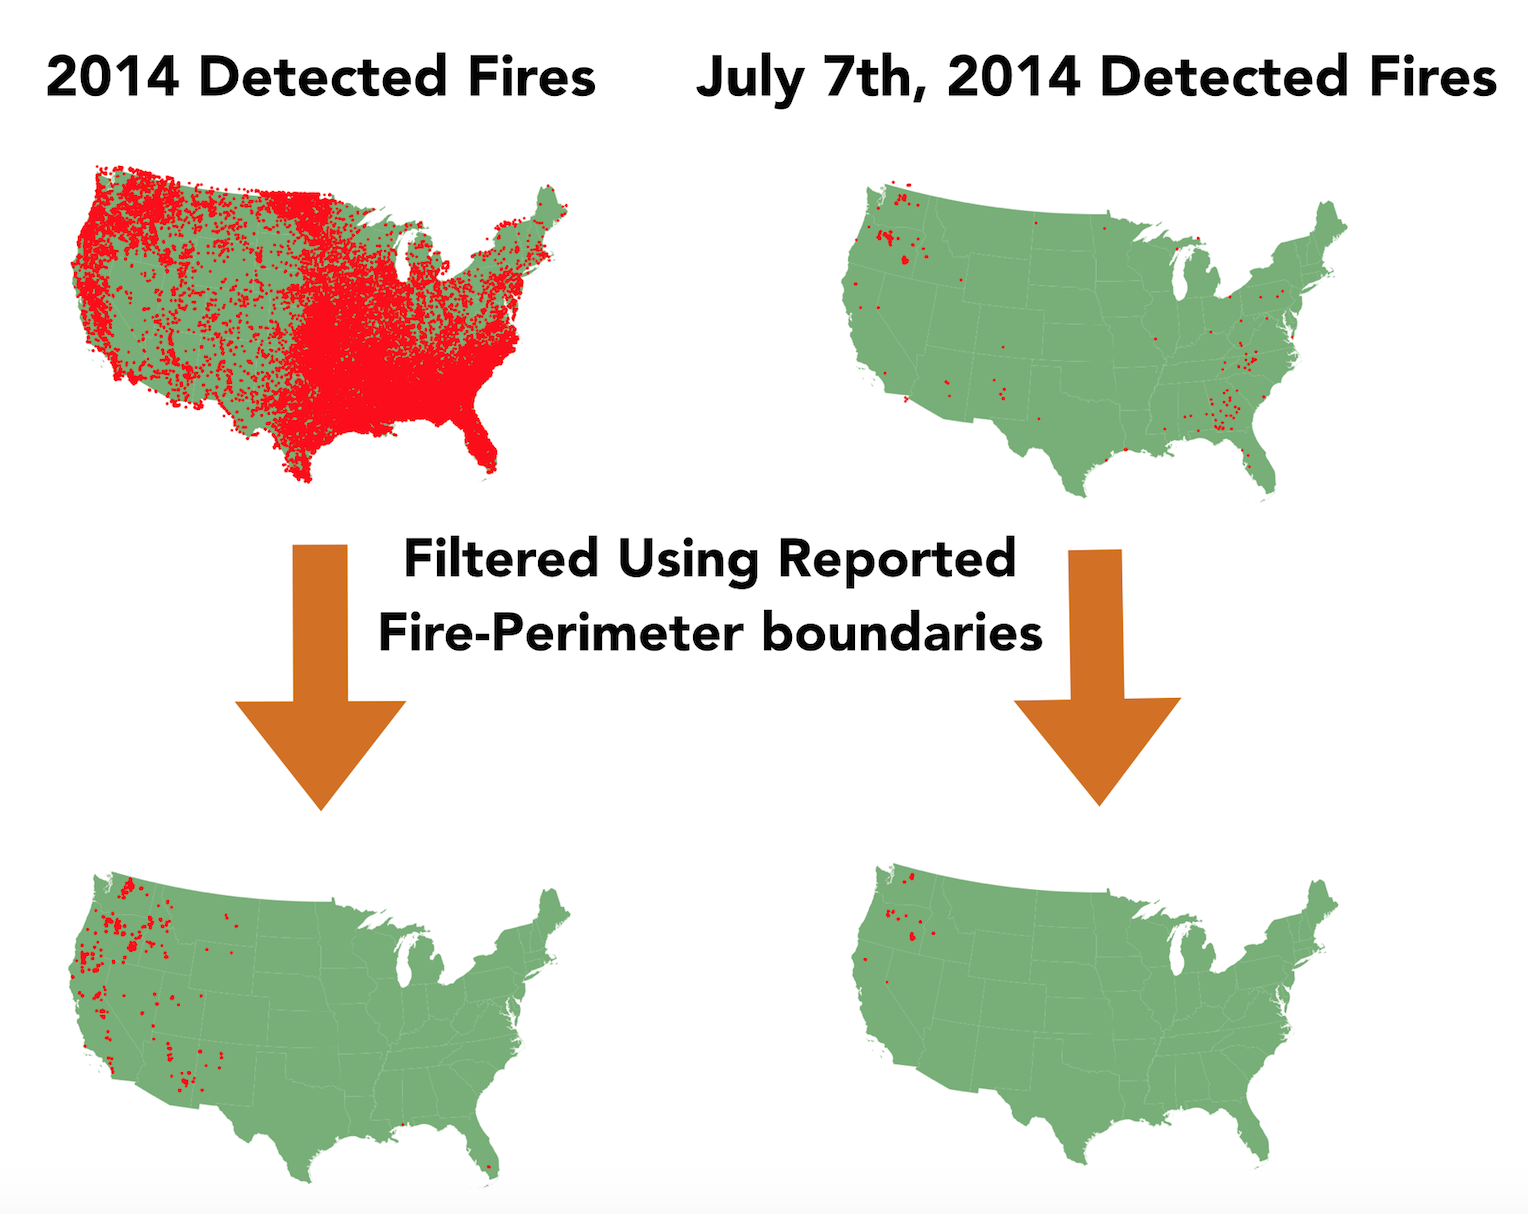
We can aggregate this data set to the year level, and see that a map of all detected fires for a given year is incredibly crowded. It's important to note, though, that these fires could be house fires, farmer burn piles, or even forest fires. Currently, this detected fires data set is not used in real-time for forest fire prevention. A large part of this could be that there is no easy way to tease out which of these detected fires are forest fires. What if there was a way that we could parse down this data set into only those detected fires which are forest fires? It turns out there is!
Each day, states submit forest-fire perimeter boundaries. If we compare the latitude/longitude coordinates of the detected fires with the forest-fire perimeter boundaries, we can pare down the detected fires data set to only those fires which are forest fires. The problem with this, though, is that we are doing it historically / after-the-fact. What if we wanted to do this in real time? This is where data science comes in...
Using data science and machine learning, we can build a model that takes in the detected fires data set and tells us which of those detected fires are actually forest fires. My current methodology has focused upon using the detected fires data set, along with geographical features, to fit the best predictive model as measured by ROC area under the curve.
At this point in time, I will not be taking any next steps. I have obtained pretty good results and believe that even better results could be obtained with additional steps (see forest_fires.pdf for a detailed discussion). However, I am concerned about this project's usefulness. I have had several conversations with different people at forest services, and none were able to say that they would use the results of the models fit here. As such, I will not be continuing work on this project.
If you fork my repo, from the main folder you can run the command make data, and the data file structure will be created for you with the data downloaded and placed into the file structure (this will create a data folder in the main directory of the repository, and a number of folders within that data folder).
Note that this assumes you are working from a unix terminal (or a linux with curl installed), with PostgresSQL and a version-consistent PostGIS extension installed. When running the make data command, you'll have to have a PostgresSQL server running in the background.
After this, you can run the command make features, which will create for you a .csv that holds the data ready to run through models (from this point you can read it into a Pandas DataFrame to run through models). After this command, the model inputs will be in a file named geo_time_done.csv, stored in the code/modeling/model_input folder. Note that this make features command will take some time. For me, even on a 40 core machine on AWS, it took ~2 1/2 hours.
Feel free to email me anytime at ssall@alumni.nd.edu.

