- Configure machine to run a kubeadm cluster with CRI-O
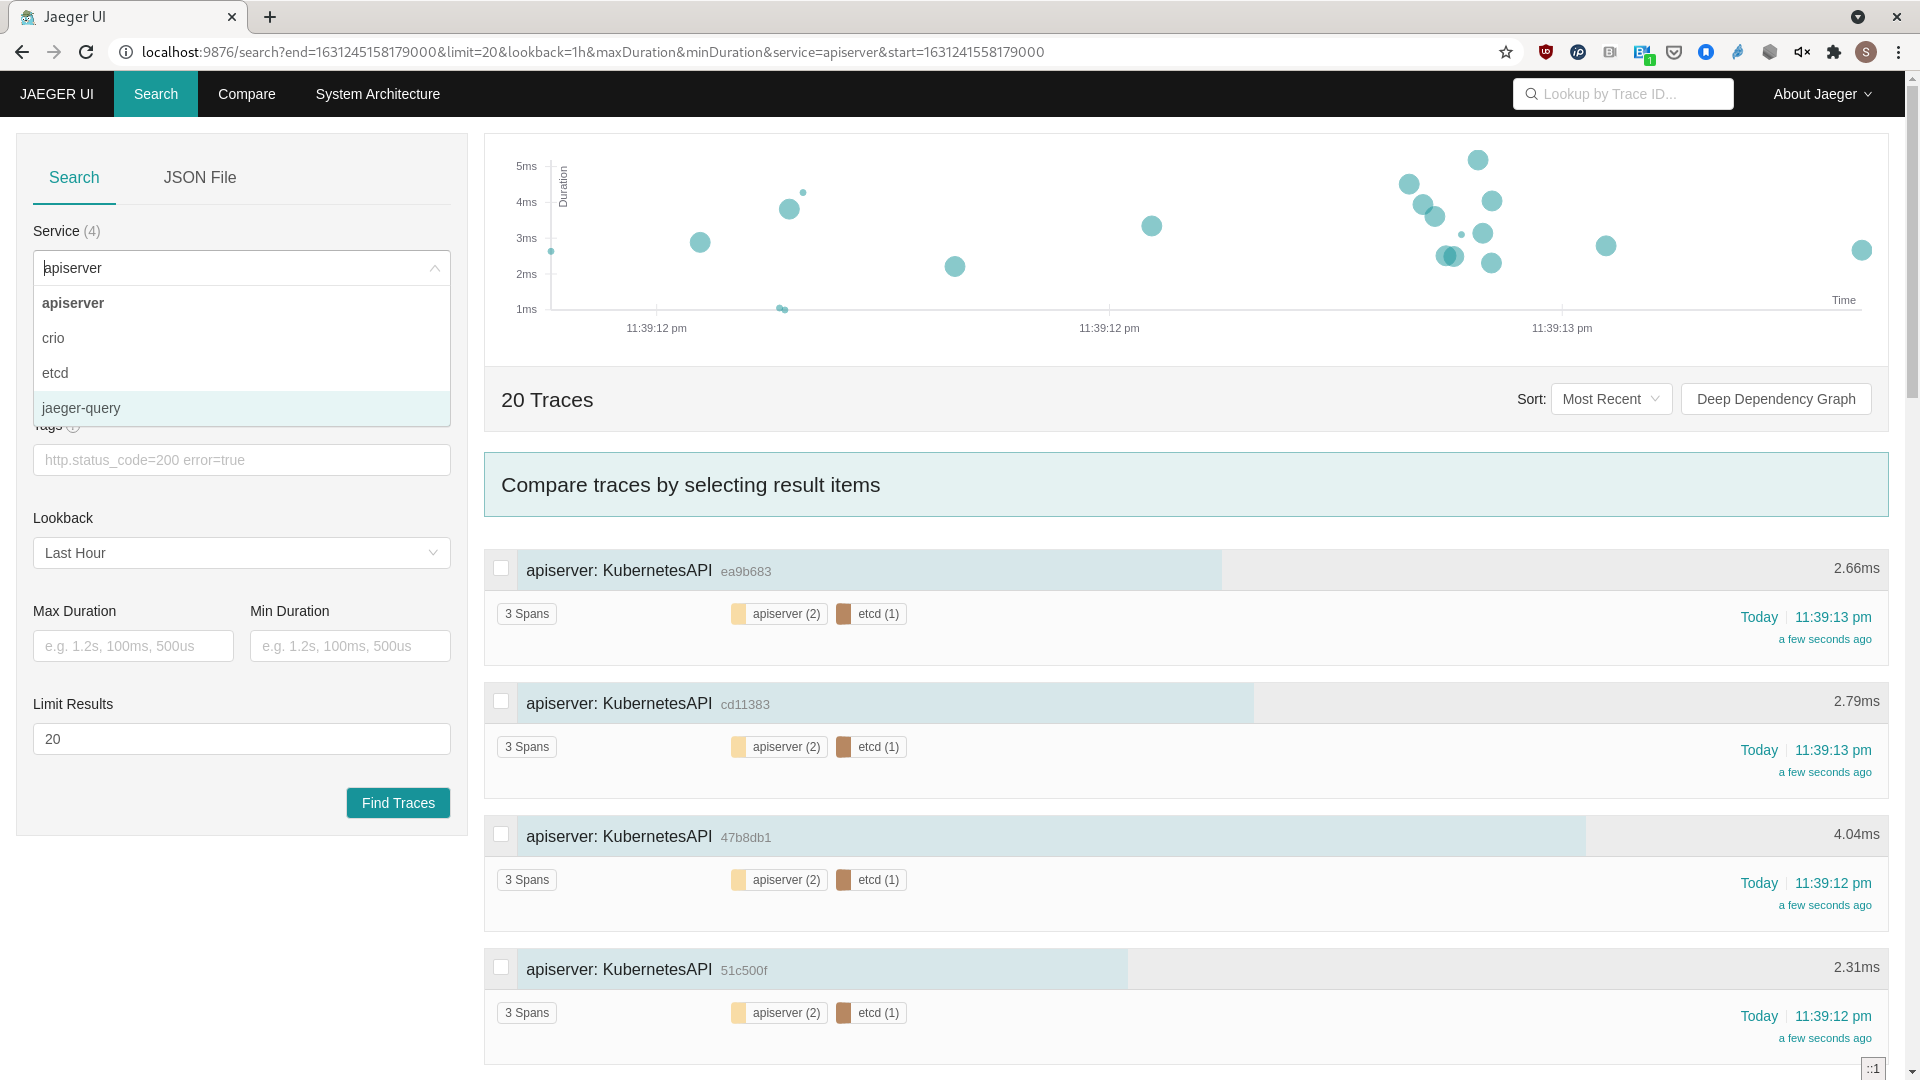
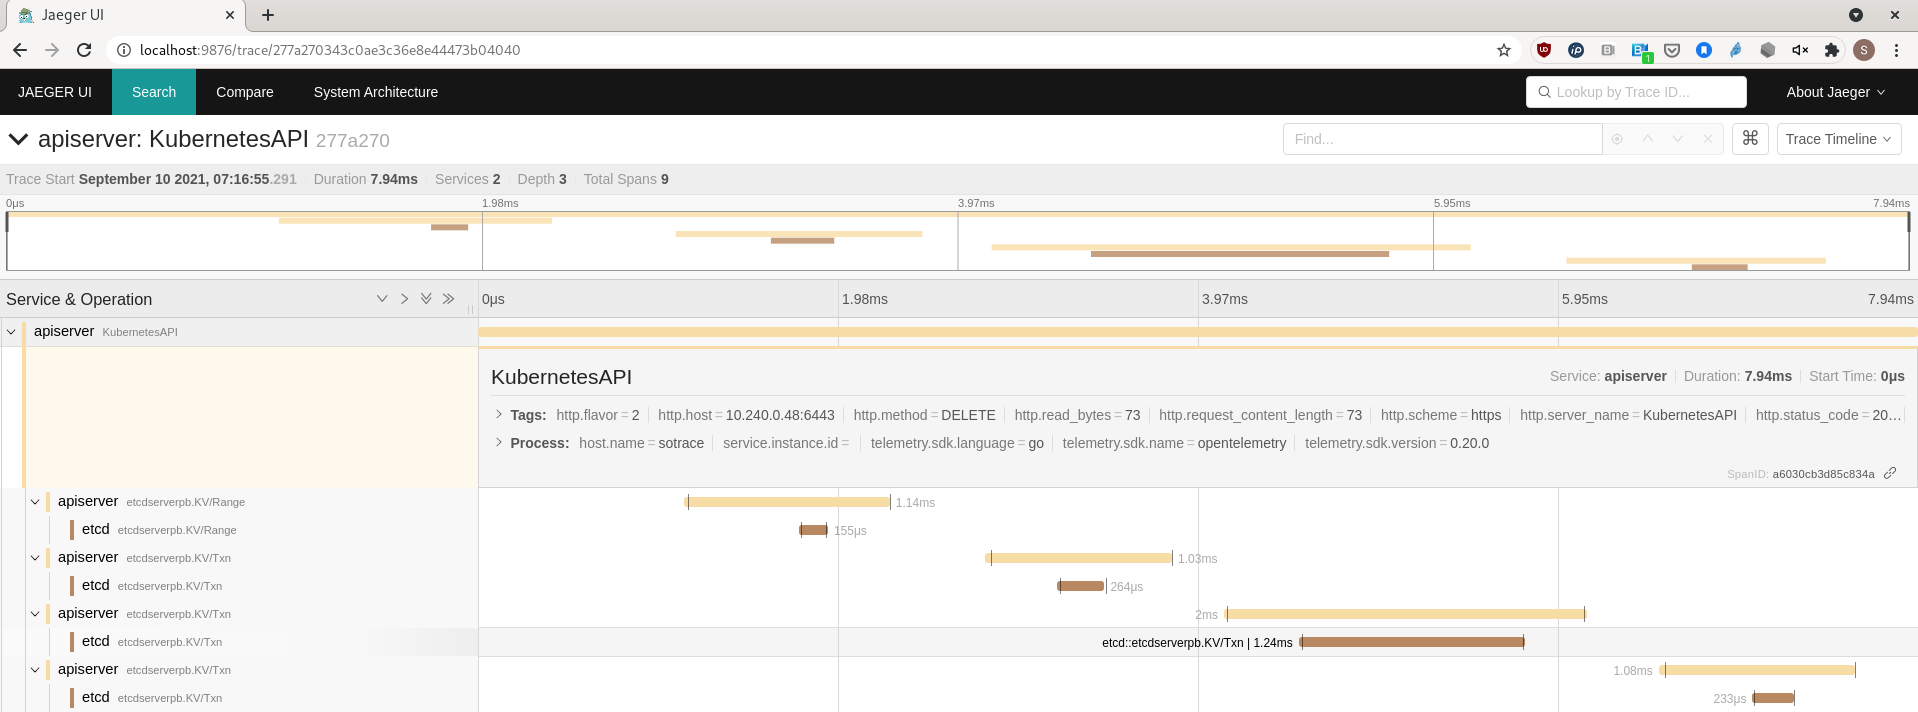
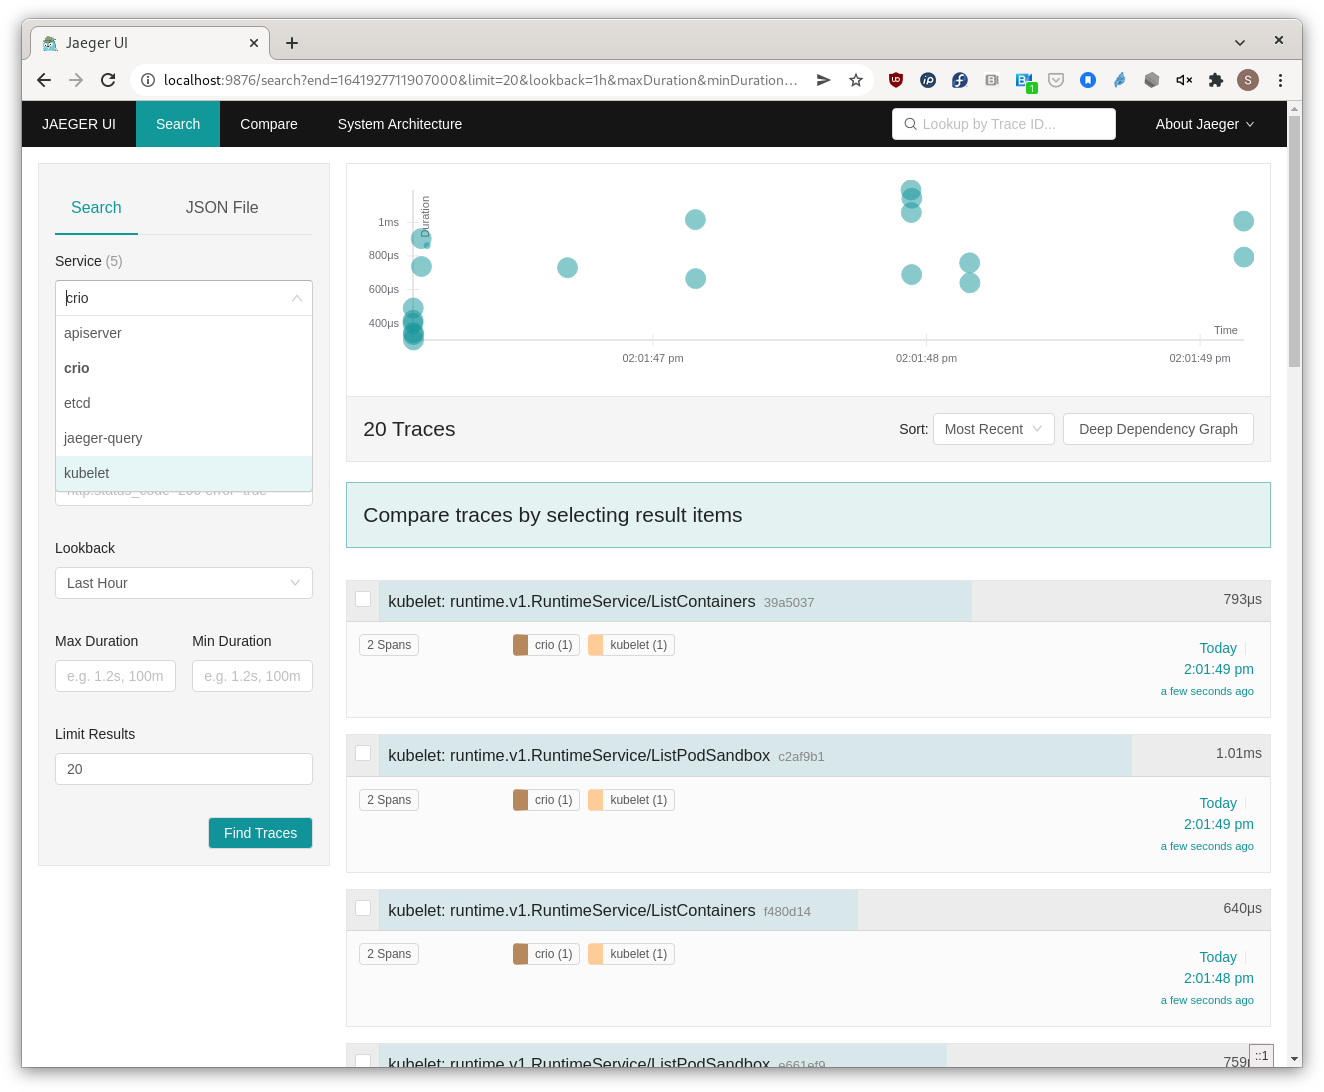
- Kubeadm cluster with apiserver, kubelet, CRI-O, & etcd OpenTelemetry trace exports
- OpenTelemetry-Collector to collect trace data from apiserver, etcd, kubelet & CRI-O
- Jaeger all-in-one to visualize trace data
Fedora 36
TODO: configure kubeadm non-root
sudo kubeadm init --cri-socket=unix:///var/run/crio/crio.sockUpon successful launch, copy the admin config to $HOME
mkdir $HOME/.kube
sudo cp -i /etc/kubernetes/admin.conf $HOME/.kube/config
chown $(id -u):$(id -g) $HOME/.kube/config
Make control-plane node schedulable
kubectl taint nodes --all node-role.kubernetes.io/control-plane-Trace configuration file will be volume mounted in APIserver pod
mkdir /tmp/trace
cat <<EOF > /tmp/trace/trace.yaml
apiVersion: apiserver.config.k8s.io/v1alpha1
kind: TracingConfiguration
# 99% sampling rate
samplingRatePerMillion: 999999
EOFCopy the manifests directory from this repository to local /tmp directory
podman run --rm -d --name kubeadm-files quay.io/sallyom/otel-ex:kubeadm sleep 1000
podman cp kubeadm-files:/manifests /tmpsudo su
cp /tmp/manifests/etcd.yaml /etc/kubernetes/manifests/.
cp /tmp/manifests/kube-apiserver.yaml /etc/kubernetes/manifests/.
cp /tmp/manifests/kubelet-config.yaml /var/lib/kubelet/config.yaml
systemctl restart kubelet
exit
podman stop kubeadm-filesUse these commands to monitor cluster health
sudo systemctl status kubelet # should be running
sudo crictl ps -a # should see etcd, kube-apiserver pods deletion, creation
oc get pods -A # no pending podskubectl apply --kustomize /tmp/manifests/otel-collector- Configure
otel-agent-conf configmapexporter data- View ClusterIP from
kubectl get -n otel service otel-collectornote the ClusterIP kubectl edit cm/otel-agent-conf -n otelmodify exporter otlp endpoint to match ClusterIP noted abovekubectl delete pod/otel-agent-podnameto refresh with updated configmap
- View ClusterIP from
https://www.jaegertracing.io/docs/1.38/operator/#installing-the-operator-on-kubernetes
Jaeger operator requires cert-manager is running.
kubectl apply -f https://github.com/cert-manager/cert-manager/releases/download/v1.9.1/cert-manager.yamlNote: Jaeger operator is also available through Operator Hub
kubectl create namespace observability
kubectl apply -f https://github.com/jaegertracing/jaeger-operator/releases/download/v1.38.0/jaeger-operator.yaml -n observabilitykubectl edit deployment -n observabilityUpdate this section
---
     spec:
        containers:
        - args:
          - start
          env:
          - name: WATCH_NAMESPACE
            value: ""
---When Jaeger custom resource is created, Jaeger operator triggers resource creation in the same namespace as the Jaeger CR.
kubectl apply -f https://raw.githubusercontent.com/sallyom/otel-kubeadm/main/jaeger.yaml -n otel
# wait for oteljaeger pod to be running, then forward 16686 of pod to localhost:16686 in VM
kubectl port-forward <oteljaeger-pod> -n otel 16686:16686
If running in a VM on your local machine, forward port 16686 to local system like so
ssh -L 16686:localhost:16686 username@vm-ipIf running kubeadm in a gcp cluster, forward port 16686 to local system localhost like so
gcloud compute ssh <machine-name> --zone=<zone> -- -L 9876:127.0.0.1:16686Jaeger UI is @localhost:16686 or @localhost:9876 in above gcloud example
Trace data from APIServer, etcd, and CRI-O should be visible!
kubectl apply -f https://raw.githubusercontent.com/kubernetes/dashboard/v2.3.1/aio/deploy/recommended.yaml
kubectl proxy
If in gcp, forward :8001 to localhost of local system, otherwise, Kube UI @localhost:8001
gcloud compute ssh <machine-name> --zone=<zone> -- -L 9888:127.0.0.1:8001Try this k8s-hello-mutating-webhook example application! Use the test-deployment in that example to scale up and down pods, to generate activity with etcd, CRI-O, and APIServer.


