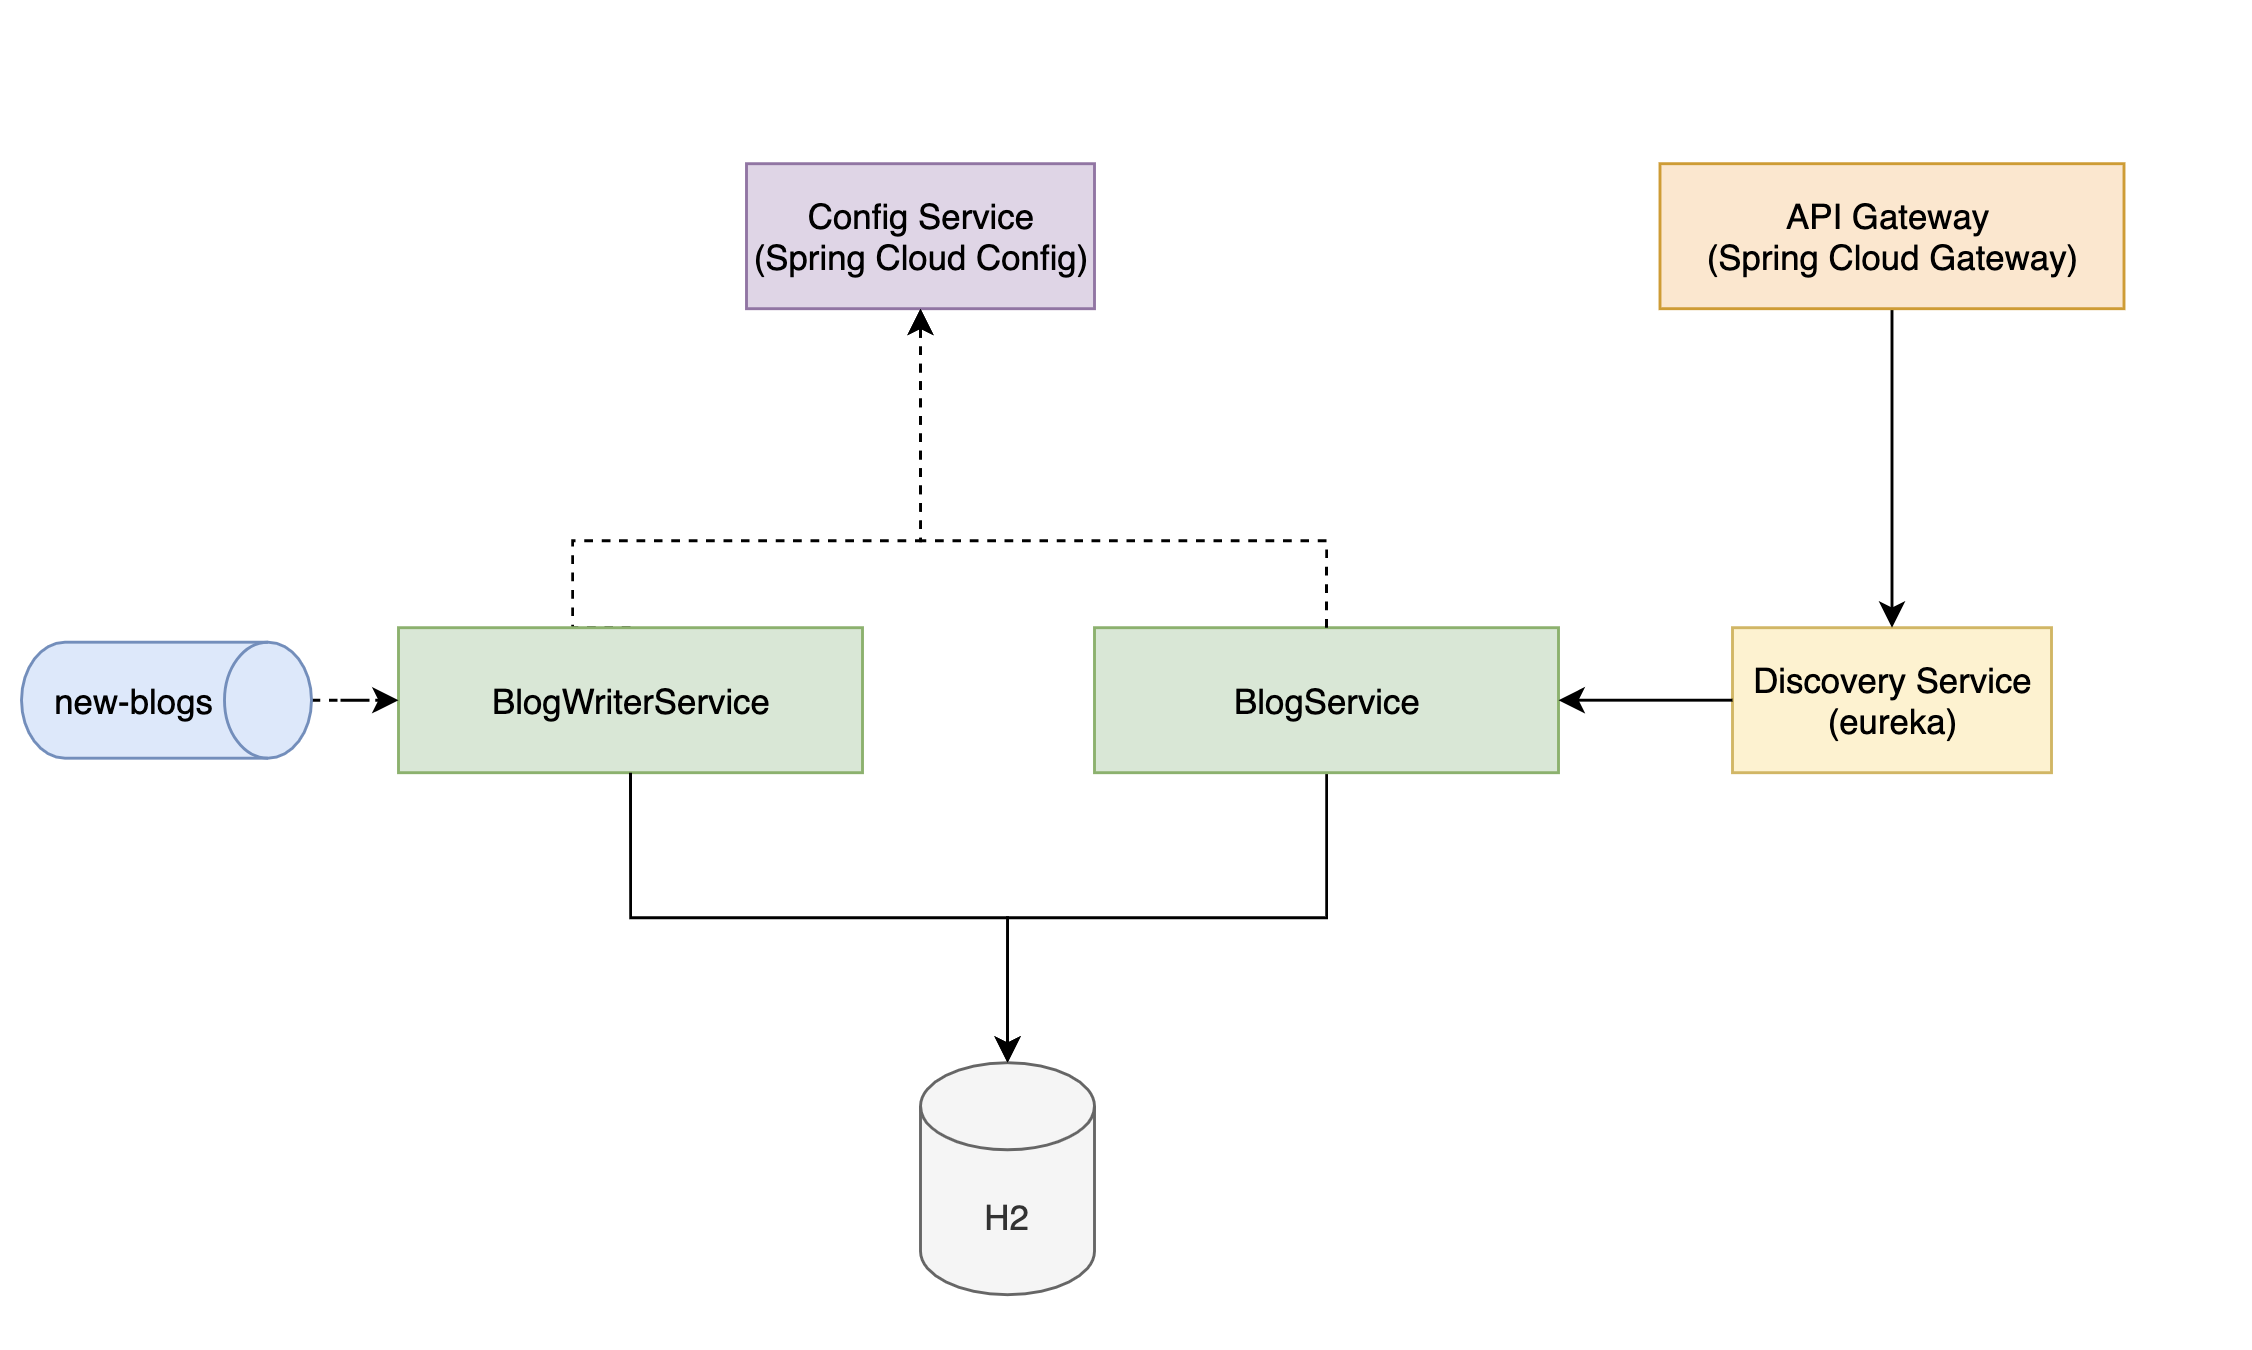
A basic microservice setup to practice the following:
- new(ish) Spring Cloud Api Gateway
- distributed tracing w/ Sleuth, Zipkin, Elastic Stack
- Resiliency w/ Hystrix
| Service Name | Url |
|---|---|
| Config Server | localhost:8888 |
| Eureka | localhost:8761 |
| Blog Service | localhost:9090 |
| Blog Writer Service | localhost:9091 |
| API Gateway | localhost:8080 |
| Zipkin | localhost:9411 |
| Service Name | Topic | Role |
|---|---|---|
| Blog Writer Service | new-blogs | Consumer |
| Description | Command |
|---|---|
| Discover registered apps | `curl -H 'Accept: application/json' localhost:8761/eureka/apps \ |
| Discover registered instances of a service | `curl -H 'Accept: application/json' localhost:8761/eureka/apps/SERVICE-NAME \ |
| Refresh all instances of a service | curl localhost:8761/refresh?serviceName=<serviceName |
docker network create elastic
docker run -d --name es01-test --net elastic -p 9200:9200 -p 9300:9300 -e "discovery.type=single-node" docker.elastic.co/elasticsearch/elasticsearch:7.12.1
docker run -d --name kib01-test --net elastic -p 5601:5601 -e "ELASTICSEARCH_HOSTS=http://es01-test:9200" docker.elastic.co/kibana/kibana:7.12.1docker stop es01-test
docker stop kib01-testdocker network rm elastic
docker rm es01-test
docker rm kib01-testYou should now be able to access Kibana at localhost:5601
Download and run Confluent service (includes kafka, zookeeper, schema registry, etc.)
# Download and run Confluent service (includes kafka, zookeeper, schema registry, etc.)
curl --silent --output docker-compose.yml \
  https://raw.githubusercontent.com/confluentinc/cp-all-in-one/7.0.0-post/cp-all-in-one/docker-compose.yml
docker-compose up -d

# to view container status
docker-compose ps
# or
docker ps

# to stop
docker-compose down
To view container status
docker-compose ps
or
docker ps
To stop containers:
docker-compose down
Run the following:
docker run -d -p 9411:9411 openzipkin/zipkin
Browse to http://localhost:9411 to find traces!
The application uses Spring Sleuth to add Trace and Span Ids to all backend requests. Additionally, a baggage field called app-session-id (TODO: rename this to session-id) will be propagated from an (optional) inbound http request header of the same name. To log this baggage field with the other trace information, we need to override the default logback log pattern and add the new field. The appropriate logging.pattern.console value is as follows:
logging:
  pattern:
    console: "${CONSOLE_LOG_PATTERN:%clr(%d{${LOG_DATEFORMAT_PATTERN:yyyy-MM-dd HH:mm:ss.SSS}}){faint} %clr(${LOG_LEVEL_PATTERN:%5p}) %clr([${spring.application.name},%X{app-session-id},%X{traceId},%X{spanId}]){green} %clr(${PID:- }){magenta} %clr(---){faint} %clr([%15.15t]){faint} %clr(%-40.40logger{39}){cyan} %clr(:){faint} %m%n${LOG_EXCEPTION_CONVERSION_WORD:%wEx}}"
The intent for this baggage field is that a session ID may be passed from all front-end requests associated with a user's session. Perhaps at signon this session ID can be generated and recorded for easy tracking and subsequent access.
Applications which connect to eureka run with a special test profile which disables the eureka client.
- DONE - add trace IDs (sleuth)
- DONE - visualize traces in Zipkin
- DONE - add shared H2
- DONE - move configs to github
- DONE - change configs server to register w/ eureka
- DONE - update apps to pull configs via eureka
- update eureka to advertise IPs
- dockerize
- write docker-compose.yml
- setup E.S. and send logs
- visualize traces in E.S.
- add security
- hystrix
