USA Drought Monitor GIS data pre processing:
Link to data: https://droughtmonitor.unl.edu/Data/GISData.aspx
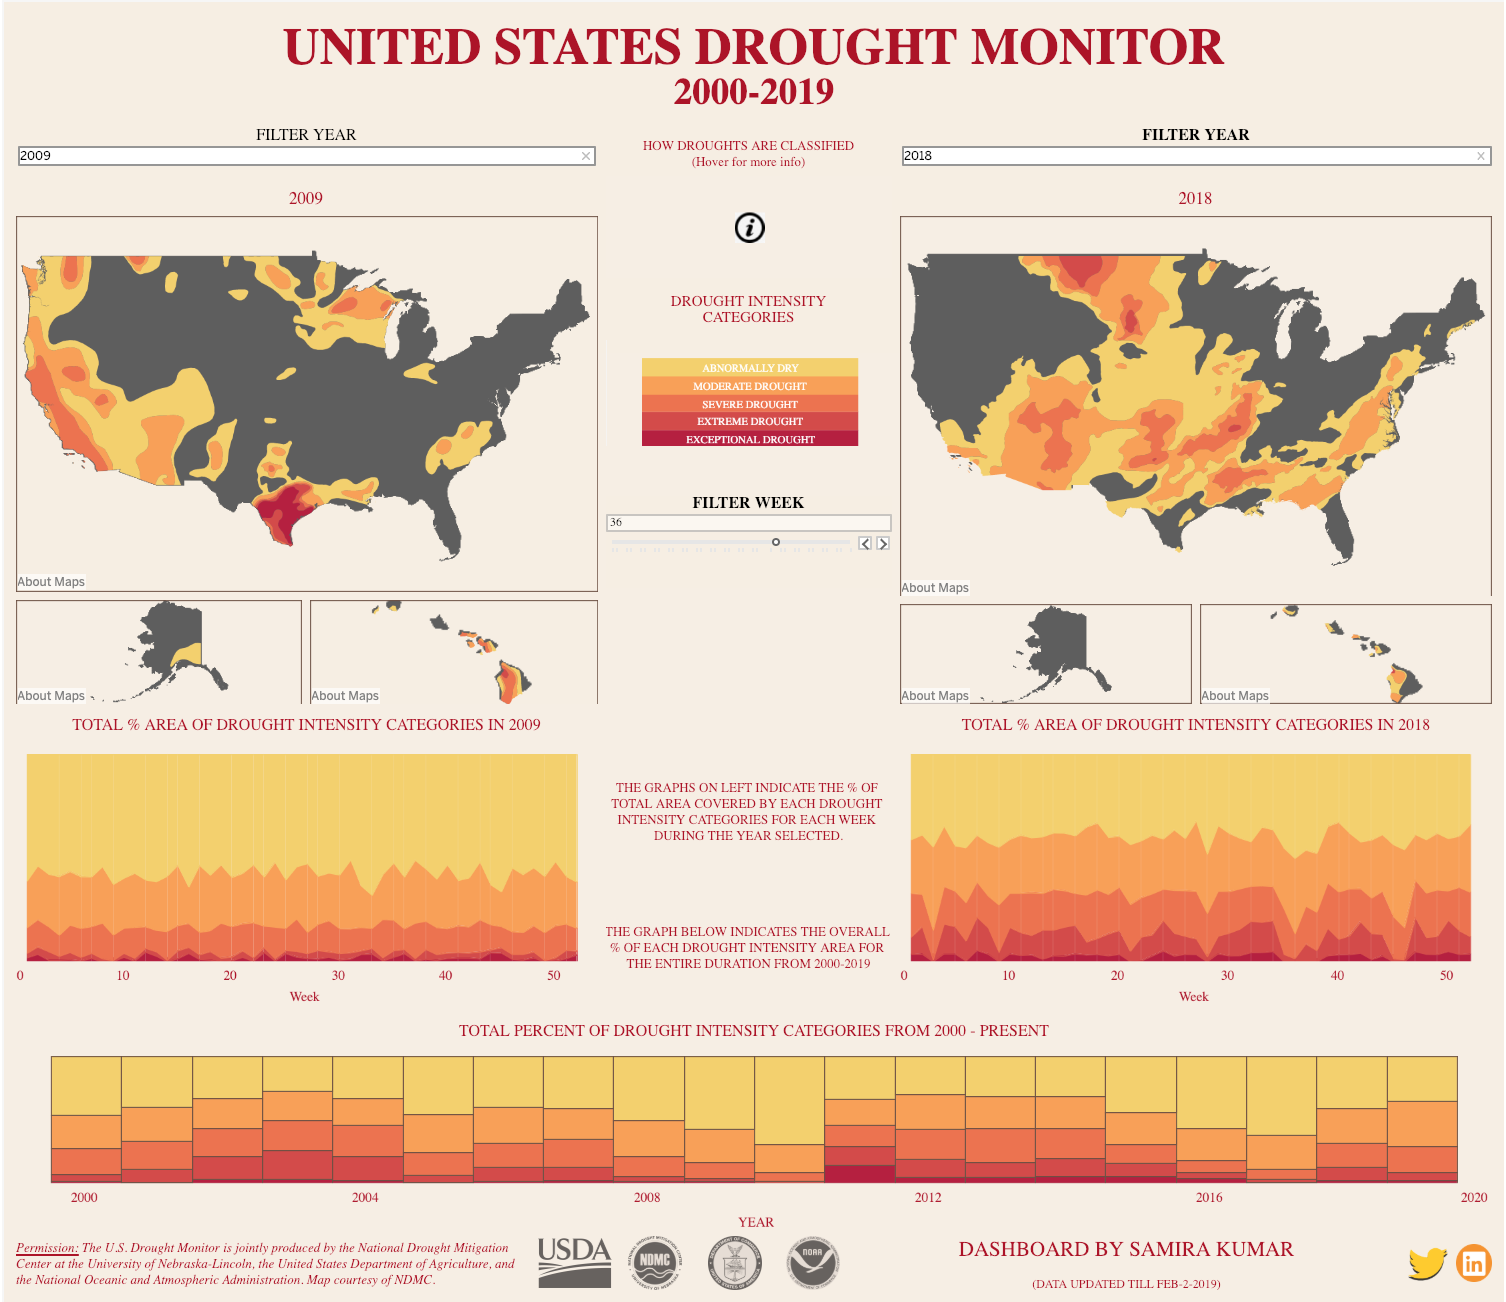
I've made it into a visualization, which can be found here
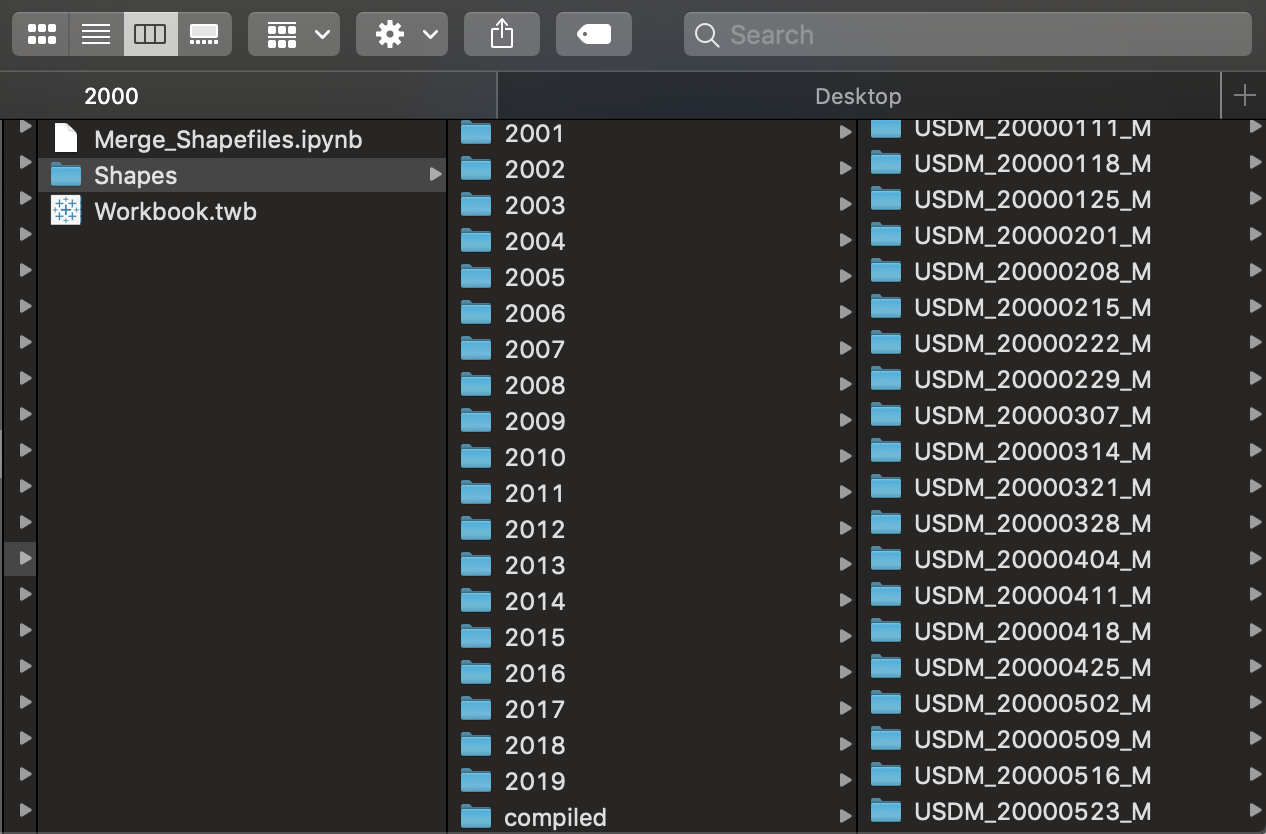
Before u run the below code, make sure all folders which has shapefile are kept together in a single folder. I named each folder based on year. So 2018 will be a folder, which has individual 53 folder of GIS data.
Sample folder directory is below:
Drought_Data
|
+--2018 (Folder)
|+--- Week 1 folder
|+--- Week 2 folder
+--2017 (Folder)
|+--- Week 1 folder
|+--- Week 2 folder
Make sure folder names are in years so that below code works.
This is how folders looks when you do above steps:
#Merge all shapefiles
from pathlib import Path
import pandas
import geopandas

folder = Path("path_name/Drought Data/Shapes")
gdf=geopandas.GeoDataFrame()
for i in range(2000,2020):
    shapefiles = folder.glob(str(i)+"/USDM_*_M/USDM_*.shp")
    week=1
    for shp in shapefiles:
        df = (geopandas.read_file(shp))
        df['Year']=i
        df['Week']=week
        week+=1
        gdf = pandas.concat([gdf,df],ignore_index=True)
gdf.tail()
# Save the file
folder_compiled = Path("path_name/Drought Data/Shapes/compiled")
gdf.to_file(folder_compiled / 'compiled.shp')
gdf.head()
Contact me on twitter for more questions.