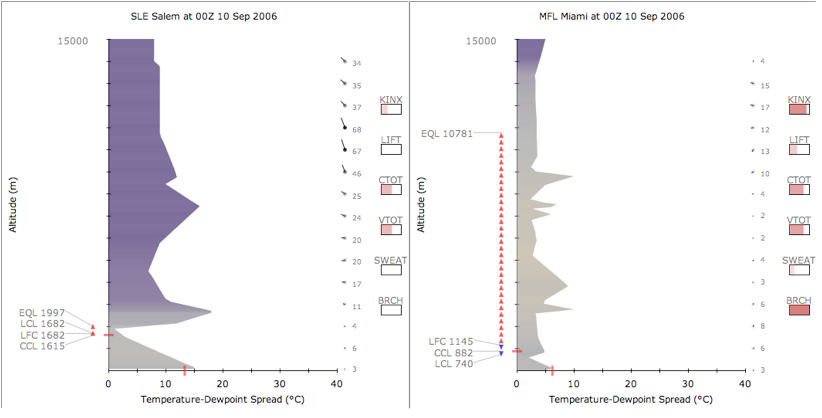
I created AtmosView, a re-design of the visualization of atmospheric sounding data. Relationships between temperature, dewpoint, and the lifting of imaginary parcels of air are important to the determination of soaring conditions, atmospheric stability, and likelihood of severe weather. The current diagrams to display these relationships have been described as the most difficult atmospheric diagrams to read. The re-design applies well tested information visualization principles to expose data to the user previously hidden behind lines and frames. This not only improves extraction of data from individual charts, but allows for easier comparison between multiple charts. An informal evaluation of the re-design was encouraging and with some further work, a system designed around the AtmosView visualization should become usable for people with an amateur interest in these meteorological relationships.
Sancho McCann. “Atmospheric Sounding Visualization.” Course Project Report. UBC Computer Science 533C. 2006.
