Flask extension that allows log lines emitted within a request handler to display/render together.
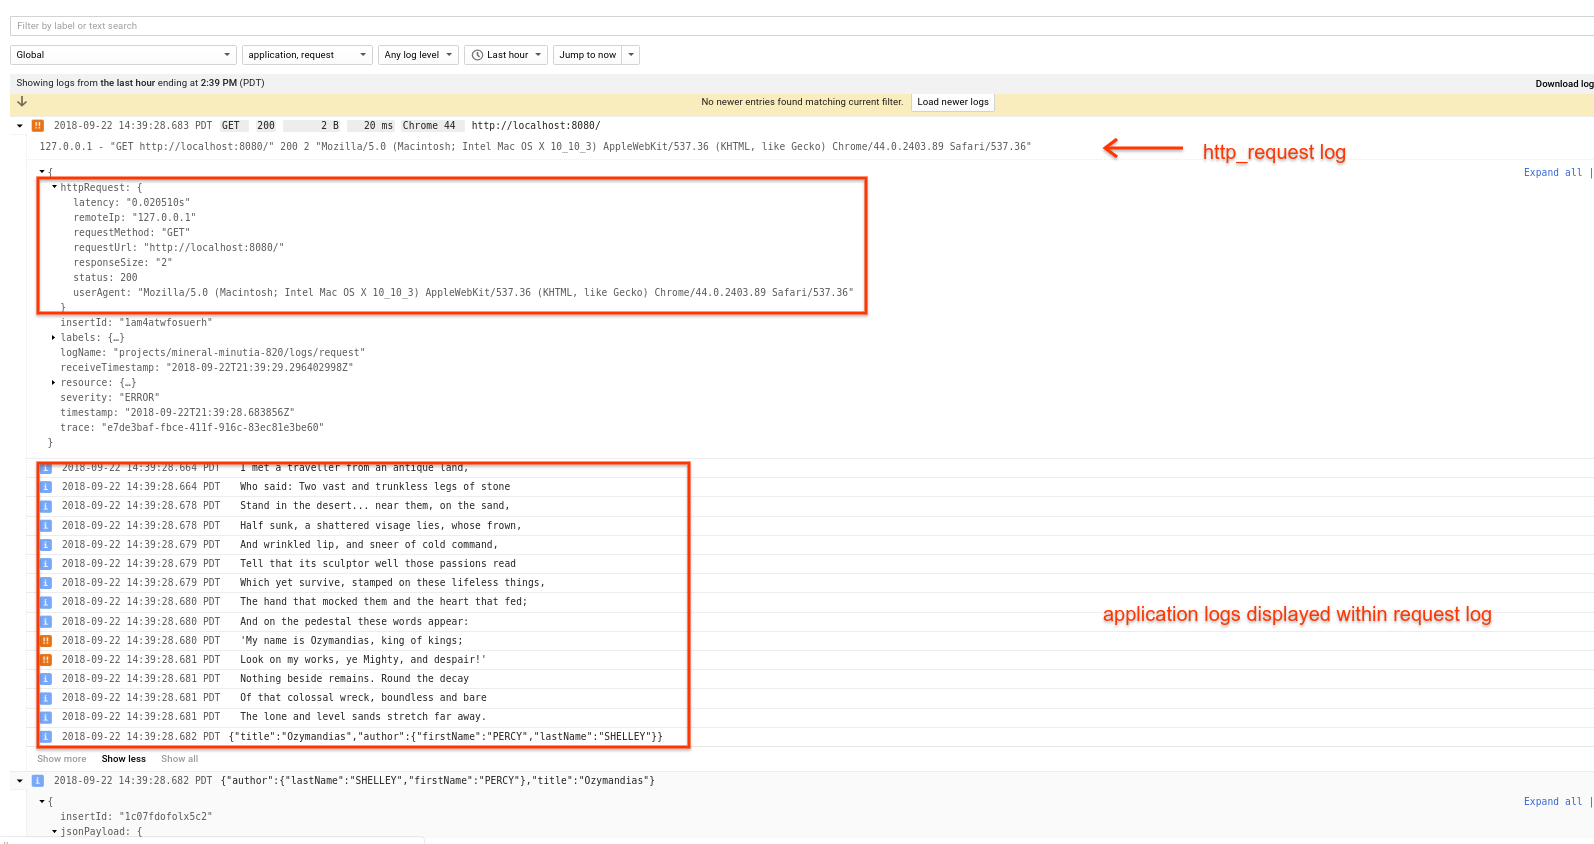
Normally, when using Google Cloud Logging libraries ( google-cloud-logging and CloudLoggingHander), each log entry that gets emitted is displayed separately within the Logging UI. However, its desireable to group all logs together that logically belong that way in an HTTP Request. For a given HTTP Request into FLask, this extension displays all the logs 'together' below the parent request.
For example, in the following snippet, all log lines will appear under one top-level HTTP Request within Google Cloud Logging:
@app.route('/')
def default():
  app.logger.setLevel(logging.INFO)
  app.logger.info("I met a traveller from an antique land,")
  app.logger.info( { "author": {
                                 "firstName": "PERCY",
                                 "lastName": "SHELLEY"
                               },
                     "title": "Ozymandias"
                   } )
  return 'ok'
as in
Note, that the application log entry does appear in the unfiltered logs still but users will 'see' all the log lines associated with the parent http_request.
What makes this possible is attaching the traceID field to each application log entry as well as emitting the parent http_request. Google cloud logging will use the traceID and "collapse" them together.
To use this, you need a Google Cloud Platform project first.
Install gcloud sdk to test locally or run in an envionment where Application Default Credentials is setup.
A trace header value must also get sent into the Flask request. Google Cloud automatically sends in a trace header though any system that proxies an L7 loadbalancer. For example, X-Cloud-Trace-Context header is sent in for App Engine, Compute Engine L7 HTTP LB and in Kubernetes Ingress constructs.
Configuration Parameters
GCPHandler-
app: Flask handler
-
parentLogName: parentLogger name for the 'request (default: request")
-
childLogName: childLogger name for the 'application logs (default: "application")
-
traceHeaderName: header name to parse as the trace header. (on GCP, itsX-Cloud-Trace-Context)
-
labels: labels dictionary to apply to all logs (default = None),
-
resource: Cloud Logging resource to log against (default='global')
Once the logging handler is initialized, you can directly emit either a text_payload or json_payload as shown above. The JSON payload allows for easy filtering on GCP logging console.
The logging handler will aggregate the applicaiton logs and tag the top-level request log with the the highest priority. That is, if any app log is emitted at level ERROR, then the overall aggregated request log will acquire that level.
virtualenv env
source env/bin/activate
pip install flask-gcp-log-groups

wget https://raw.githubusercontent.com/salrashid123/flask-gcp-log-groups/master/testing/main.py

python main.py
then in a new window
curl -v  -H "User-Agent: Mozilla/5.0 (Macintosh; Intel Mac OS X 10_10_3) AppleWebKit/537.36 (KHTML, like Gecko) Chrome/44.0.2403.89 Safari/537.36" \
    -H "X-Cloud-Trace-Context: `python -c "import uuid; print uuid.uuid4()"`" \
    http://localhost:8080/
If the flask app is deployed behind a GCP Loadbalancer that automatically emits X-Cloud-Trace-Context, you can view the collapsed logs in cloud logging
under Cloud Logging >> Global filter on the GCP Console.
Note: logs display on GCP Cloud Console under
globalwill show all logs in one set together.
- main.py:
#!/usr/bin/python

from flask import Flask
import logging
import json

from flask_gcp_log_groups import GCPHandler

app = Flask(__name__)


g = GCPHandler(app, parentLogName="request",
    childLogName="application",
    traceHeaderName='X-Cloud-Trace-Context',
    labels= {'foo': 'bar', 'baz': 'qux'},
    resource= {
                "type": "gce_instance",
                "labels": { "instance_id": "5160310737730769780",
                            "zone": "us-central1-a"
                          }
    }
  )
g.setLevel(logging.INFO)
app.logger.addHandler(g)

@app.route('/')
def default():
  app.logger.setLevel(logging.INFO)
  app.logger.info("I met a traveller from an antique land,")
  app.logger.info("Who said: Two vast and trunkless legs of stone")
  app.logger.info("Stand in the desert... near them, on the sand,")
  app.logger.info("Half sunk, a shattered visage lies, whose frown,")
  app.logger.info("And wrinkled lip, and sneer of cold command,")
  app.logger.info("Tell that its sculptor well those passions read")
  app.logger.info("Which yet survive, stamped on these lifeless things,")
  app.logger.info("The hand that mocked them and the heart that fed;")

  app.logger.info("And on the pedestal these words appear:")
  app.logger.error("'My name is Ozymandias, king of kings;")
  app.logger.error("Look on my works, ye Mighty, and despair!'")
  app.logger.info("Nothing beside remains. Round the decay")
  app.logger.info("Of that colossal wreck, boundless and bare")
  app.logger.info("The lone and level sands stretch far away.")

  app.logger.info( { "author": {
                                 "firstName": "PERCY",
                                 "lastName": "SHELLEY"
                               },
                     "title": "Ozymandias"
                   } )
  return 'ok'

@app.route('/_ah/health')
def health():
  return 'ok'

if __name__ == '__main__':
app.run(host='0.0.0.0', port=8080, debug=False)- with trace only
curl -v  -H "User-Agent: Mozilla/5.0 (Macintosh; Intel Mac OS X 10_10_3) AppleWebKit/537.36 (KHTML, like Gecko) Chrome/44.0.2403.89 Safari/537.36" \
    -H "X-Cloud-Trace-Context: `python -c "import uuid; print uuid.uuid4()"`" \
    http://localhost:8080/
- with trace+span
curl -v  -H "User-Agent: Mozilla/5.0 (Macintosh; Intel Mac OS X 10_10_3) AppleWebKit/537.36 (KHTML, like Gecko) Chrome/44.0.2403.89 Safari/537.36" \
    -H "X-Cloud-Trace-Context: `python -c "import uuid; print str(uuid.uuid4()) + '/' + '{0:}'.format(42,6).zfill(16)"`" \
    http://localhost:8080/
