This project focuses on predicting customer churn for an e-commerce platform by analyzing behavioral, demographic, and transactional data. Using advanced machine learning models with techniques like hyperparameter tuning and SHAP analysis, it provides insights into factors that influence churn and supports targeted customer retention strategies.
- Project Overview
- Dataset
- Objective
- Installation and Setup
- Exploratory Data Analysis (EDA)
- Feature Engineering
- Data Preprocessing
- Modeling
- Evaluation and Results
- Conclusion and Future Work
- How to Use This Project
- Repository Structure
- References
- License
- Contact
In e-commerce, understanding customer churn is crucial for maintaining revenue and customer satisfaction. This project predicts customer churn using machine learning models trained on customer demographic and behavioral data.
The dataset used is from the Kaggle Playground Series Season 4 Episode 1. It includes comprehensive customer data with columns such as:
- CustomerId: Unique identifier for each customer
- Demographics:
Age,Gender,Geography - Financial Metrics:
CreditScore,Balance,EstimatedSalary - Behavioral Indicators:
NumOfProducts,HasCrCard,IsActiveMember,Tenure - Target Variable:
Exited- 1 if the customer has churned, 0 otherwise
The goal is to predict which customers are likely to churn, using this information to develop effective customer retention strategies.
To replicate the analysis, you need the following libraries installed:
pip install pandas numpy matplotlib seaborn scikit-learn xgboost lightgbm catboost optuna plotly ipywidgets shapThe exploratory data analysis phase involved a thorough examination of customer characteristics and churn patterns. Key steps and findings include:
-
Target Variable Analysis (
Exited):- Churn Distribution: Visualized the distribution of churn, showing a higher proportion of retained customers compared to churned ones, indicating a class imbalance.
- Insights: Highlighted the need for handling techniques during modeling, such as class weighting or resampling.
-
Univariate Analysis:
- Demographic Variables:
- Age: Older customers show a higher propensity to churn.
- Geography: Churn rates vary across regions, with certain locations like Germany showing higher churn tendencies.
- Behavioral Variables:
- NumOfProducts: Higher numbers of products correlate with increased churn rates.
- IsActiveMember: Inactive members have a higher likelihood of churn.
- Financial Metrics:
- CreditScore and Balance: No direct relationship with churn observed, but further explored in feature engineering.
- Demographic Variables:
-
Bivariate Analysis:
- Analyzed relationships between pairs of variables to gain deeper insights into feature interactions, such as the correlation between
AgeandBalancein relation to churn behavior.
- Analyzed relationships between pairs of variables to gain deeper insights into feature interactions, such as the correlation between
-
Correlation Analysis:
- Created a heatmap to visualize correlations among numerical variables.
- Findings: Significant correlation observed between
Balanceand the engineeredBalance_to_Age_Ratio, leading to the decision to dropBalanceto avoid multicollinearity.
Visualizations generated during EDA are available in the __results___files folder.
-
Creating New Features:
-
Balance_to_Age_Ratio:
- Definition: The ratio of a customer's account balance to their age.
- Purpose: Captures wealth accumulation relative to age, helping to identify high-value customers.
-
Products_per_Year:
- Definition: The average number of products held per year of tenure.
- Purpose: Gauges product engagement over time, identifying customers who are rapidly acquiring products, which may correlate with churn due to potential product overload or dissatisfaction.
-
-
Insights from New Features:
- Balance_to_Age_Ratio: Customers with a high ratio might be less likely to churn, as they have more invested in the platform relative to their age.
- Products_per_Year: A high rate may indicate aggressive upselling or customer enthusiasm, but could also signal risk of churn if customers feel overwhelmed.
-
Dropping Irrelevant Columns:
- Removed columns that do not contribute to predictive modeling, such as unique identifiers and personal information.
- Columns Dropped:
id,CustomerId,Surname. - Reason: These columns do not provide predictive value and could introduce noise into the model.
-
Encoding Categorical Features:
- Geography:
- Applied One-Hot Encoding to convert categorical geographical data into binary variables.
- Outcome: Created separate columns for each geographic region, allowing the model to learn region-specific churn patterns.
- Gender:
- Used Binary Encoding to map gender to numerical values (
Male: 0,Female: 1). - Outcome: Simplified gender representation for the model while preserving the potential impact of gender on churn.
- Used Binary Encoding to map gender to numerical values (
- Geography:
-
Feature Scaling:
- Applied RobustScaler to numerical features to handle outliers effectively.
- Reason: Ensures that features with larger scales do not dominate the model training process and improves the convergence of gradient-based algorithms.
-
Handling Class Imbalance:
- Noted an imbalance in the target variable
Exited(0: 130,113 instances,1: 34,921 instances). - Applied RandomUnderSampler to balance the classes by undersampling the majority class.
- Outcome: Created a balanced dataset with equal instances of churned and non-churned customers, improving the model's ability to learn from both classes.
- Noted an imbalance in the target variable
-
Correlation Analysis and Feature Selection:
- Performed a correlation analysis to identify multicollinearity among features.
- Findings:
- High correlation between
BalanceandBalance_to_Age_Ratio. - Decided to drop
Balanceto reduce redundancy and potential overfitting.
- High correlation between
- Outcome: Streamlined the feature set to enhance model performance.
Multiple models were implemented to predict churn, leveraging both traditional algorithms and ensemble techniques. Advanced hyperparameter tuning was performed using Optuna for the top-performing models.
To address class imbalance within the modeling process, class weights were adjusted for each algorithm:
- Logistic Regression: Set
class_weight='balanced'. - Decision Tree: Set
class_weight='balanced'. - Random Forest: Set
class_weight='balanced'. - XGBoost: Adjusted
scale_pos_weightto the ratio of negative to positive classes. - LightGBM: Set
class_weight='balanced'. - CatBoost: Used
class_weightsparameter with calculated weights based on class distribution.
-
Data Splitting:
- The balanced dataset was split into training and validation sets (80% train, 20% validation).
- Ensured that both sets are representative of the overall data distribution.
-
Baseline Models:
- Logistic Regression: Provided a baseline for linear relationships.
- Decision Tree: Offered interpretability through simple decision rules.
- Random Forest: Improved accuracy using ensemble learning by aggregating multiple decision trees.
- XGBoost: Utilized gradient boosting for handling complex patterns in tabular data.
- LightGBM: Offered speed and efficiency advantages, especially with large datasets.
- CatBoost: Particularly effective with categorical features and handling of default values.
-
Hyperparameter Tuning with Optuna:
- Performed hyperparameter optimization to enhance model performance.
- Random Forest:
- Tuned parameters included the number of trees, maximum depth, minimum samples for splits and leaves.
- Achieved optimal settings that balanced bias and variance.
- CatBoost:
- Tuned parameters such as depth, learning rate, regularization, and iterations.
- Found the best combination that maximized the ROC-AUC score.
-
Model Selection:
- Best Model: The
CatBoostClassifierwith tuned hyperparameters was selected based on its superior performance across evaluation metrics.
- Best Model: The
To interpret the model's predictions and understand feature importance, SHAP (SHapley Additive exPlanations) values were utilized.
-
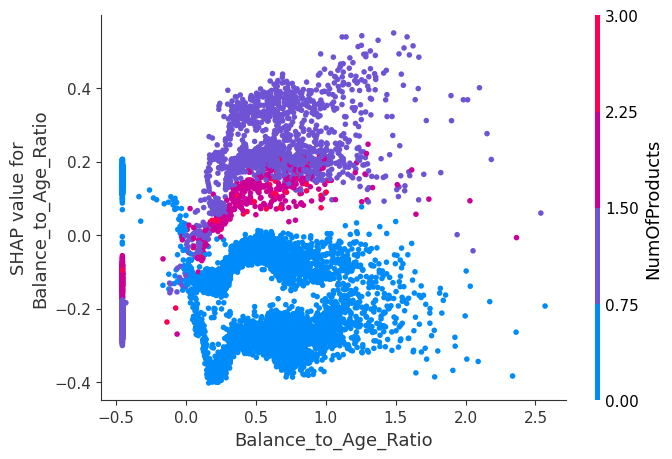
Dependence Plot for
Balance_to_Age_Ratio:- Showed that customers with a higher ratio tend to have a lower likelihood of churn.
- Highlighted interactions with other features, such as
NumOfProducts, indicating that multiple factors contribute to churn risk. - Insight: Customers with multiple products and a high balance relative to their age require targeted retention strategies.
-
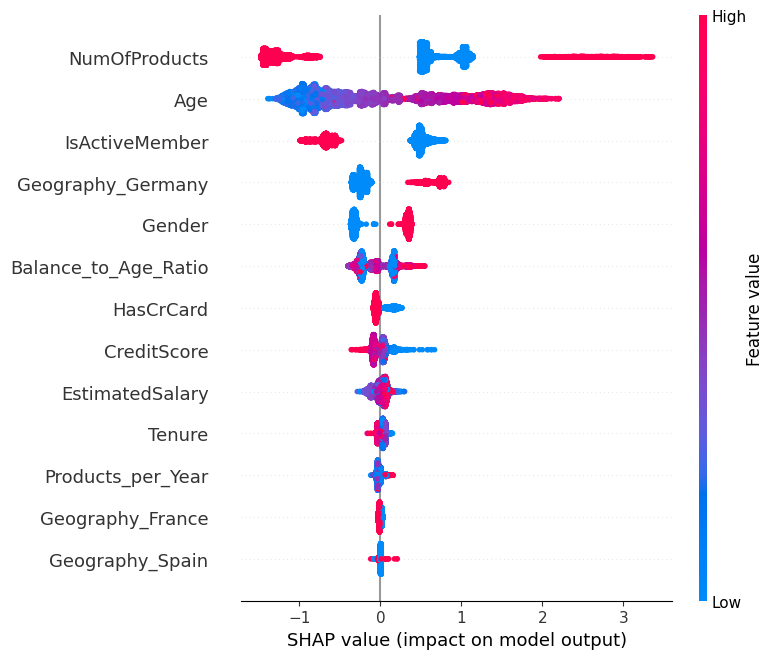
SHAP Summary Plot:
- Visualized the impact of all features on the model output.
- Identified
NumOfProducts,Age,IsActiveMember, andGeography_Germanyas the most influential features.
-
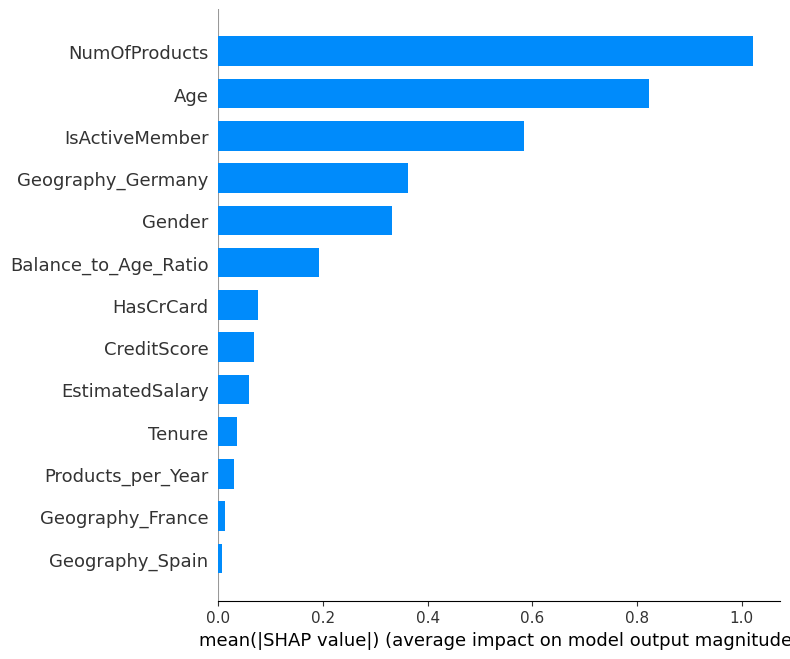
SHAP Bar Plot (Feature Importance):
- Ranked features based on their average absolute SHAP values.
- Provided actionable insights for prioritizing customer segments in retention strategies.
The SHAP plots are available in the SHAP Study folder.
Each model was evaluated using the following metrics:
- Accuracy: The proportion of correct predictions.
- AUC (Area Under ROC Curve): Measures the ability to distinguish between classes.
- Precision: The accuracy of positive predictions.
- Recall: The ability to find all positive instances.
- F1 Score: The harmonic mean of precision and recall.
| Model | Accuracy | AUC |
|---|---|---|
| Logistic Regression | 74.62% | 80.15% |
| Decision Tree | 72.57% | 78.34% |
| Random Forest | 79.46% | 85.27% |
| XGBoost | 80.13% | 86.10% |
| LightGBM | 80.61% | 86.45% |
| CatBoost | 80.62% | 86.50% |
Best Model: CatBoostClassifier with hyperparameters tuned via Optuna.
- Precision: 80.63%
- Recall: 80.62%
- F1 Score: 80.62%
- CatBoost achieved the highest ROC-AUC score of 86.50%, indicating a strong ability to distinguish between churned and non-churned customers.
- The ROC curve showed a balanced trade-off between sensitivity and specificity for the CatBoost model.
- Age and Geographic Location are strong indicators of customer churn.
- Financial Ratios like
Balance_to_Age_Ratioprovide valuable insights into customer behavior. - Ensemble Models, particularly
CatBoost, offered high accuracy and interpretability. - Feature Engineering significantly improved model performance by introducing meaningful variables.
- Exploratory Data Analysis was crucial in guiding feature engineering and model selection.
-
Advanced Feature Engineering:
- Incorporate temporal features like
Time Since Last Purchase. - Analyze customer interaction data for deeper insights.
- Incorporate temporal features like
-
Real-time Prediction:
- Deploy the model as an API for integration into the e-commerce platform.
- Enable dynamic updates and real-time churn predictions.
-
Model Deployment and Monitoring:
- Implement continuous monitoring to track model performance over time.
- Update the model as new data becomes available to maintain accuracy.
-
Clone the Repository:
git clone https://github.com/sandeeppandey1108/E-commerce-Customer-Behavior-and-Churn-Forecasting.git
-
Navigate to the Project Directory:
cd E-commerce-Customer-Behavior-and-Churn-Forecasting -
Install Required Libraries:
-
Ensure you have the necessary Python libraries installed:
pip install pandas numpy matplotlib seaborn scikit-learn xgboost lightgbm catboost optuna plotly ipywidgets shap
-
-
Access the Dataset:
- The dataset is included in the
Data_Setfolder.
- The dataset is included in the
-
Run the Notebook:
-
Open the Jupyter notebook:
jupyter notebook
-
Navigate to
Code.ipynband run each cell sequentially.
-
-
Explore Visualizations and SHAP Plots:
- EDA visualizations are available in the
__results___filesfolder. - SHAP analysis plots are available in the
SHAP Studyfolder. - Open and review these files to understand the analysis outcomes.
- EDA visualizations are available in the
-
Power BI Dashboard (Optional):
- The
Power Bifolder contains a Power BI dashboard (ISBI_Project.pbix). - Open this file with Power BI Desktop to explore interactive visualizations.
- The
-
Customize and Experiment:
- Modify hyperparameters or try different models in the notebook.
- Explore additional features or different resampling techniques.
-
Make Predictions:
- Use the trained CatBoost model to make predictions on new data.
- The notebook includes code to apply the model to the test dataset.
-
Deployment (Optional):
- To deploy the model, consider using frameworks like Flask or FastAPI.
- The trained model can be saved and loaded using joblib or pickle.
- Data_Set: Contains the dataset files (
train.csv,test.csv,submission.csv). - Power Bi: Includes the Power BI dashboard file (
ISBI_Project.pbix) and dataset files. - SHAP Study: Contains SHAP plots in PNG format.
- __results___files: Contains all graphs and visualizations produced during EDA and modeling.
- catboost_info: Contains CatBoost-related information and files.
- Code.ipynb: Jupyter notebook containing the code for data analysis and modeling.
- LICENSE.md: Project license (Apache License 2.0).
- README.md: Project documentation.
- Kaggle Playground Series Season 4 Episode 1
- Optuna Documentation
- CatBoost Documentation
- SHAP Documentation
- Scikit-learn Documentation
- Seaborn Documentation
This project is licensed under the terms of the Apache License 2.0. Please refer to the LICENSE.md file for details.
For any questions or collaboration opportunities, please reach out:
- Emails:
- LinkedIn:


