git clone https://github.com/sscu-budapest/mobility
(preferably fork it first)
pip install -r requirements.txt
if you are using the anet server:
dvc pull
otherwise, set up the anet server to be anetcloud in ssh config and then
dvc pull --remote anetcloud-ssh
from src.data_dumps import ParsedCols
from src.load_samples import covid_tuesday

def total_range(s):
    return s.max() - s.min()

samp_df = covid_tuesday.get_full_df()

samp_df.groupby(ParsedCols.user).agg(
    {
        ParsedCols.lon: ["std", total_range],
        ParsedCols.lat: ["std", total_range],
        ParsedCols.dtime: ["min", "max", "count"],
    }
).agg(["mean", "median"]).T| mean | median | ||
|---|---|---|---|
| lon | std | 0.033919 | 0.001588 |
| total_range | 0.080638 | 0.000471 | |
| lat | std | 0.01889 | 0.001067 |
| total_range | 0.045475 | 0.000336 | |
| dtime | min | 2020-11-03 07:38:23.900066048 | 2020-11-03 06:33:42 |
| max | 2020-11-03 18:43:00.657093888 | 2020-11-03 21:08:10 | |
| count | 87.307432 | 21.0 |
from src.data_dumps import ParsedCols
from src.load_samples import covid_tuesday
import matplotlib.pyplot as plt


samp_ddf = covid_tuesday.get_full_ddf()

ddf_aggs = (
    samp_ddf.assign(hour=lambda df: df[ParsedCols.dtime].dt.hour)
    .groupby("hour")
    .agg({ParsedCols.lon: ["std"], ParsedCols.lat: "std", "dtime": "count"})
    .compute()
)

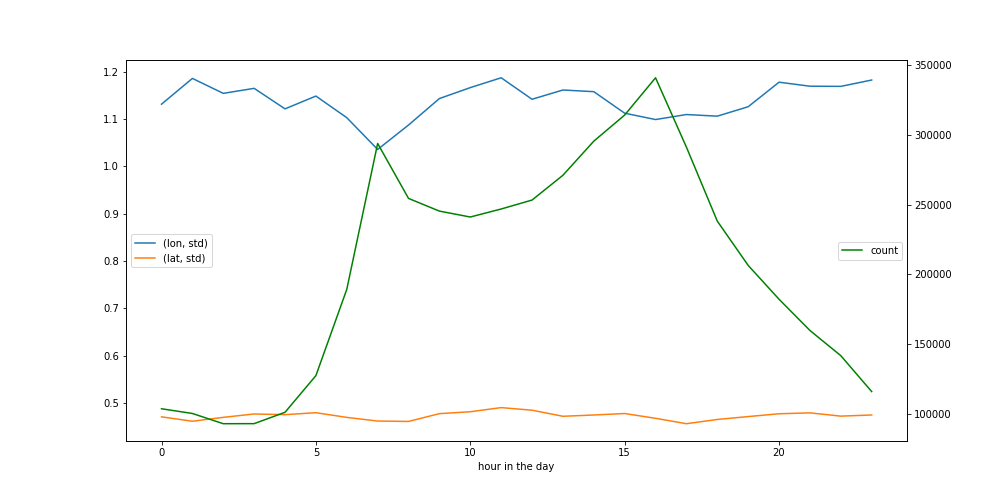
fig, ax1 = plt.subplots()

ddf_aggs.iloc[:, :2].plot(figsize=(14, 7), ax=ax1, xlabel="hour in the day").legend(
    loc="center left"
)
ddf_aggs.loc[:, "dtime"].plot(figsize=(14, 7), ax=ax1.twinx(), color="green").legend(
    loc="center right"
)from src.create_samples import covid_sample, non_covid_sample
# this is about 3GB of memory, use get_full_ddf for lazy dask dataframe
cov_df = covid_sample.get_full_df()-
"reliable user" counts
- number of pings
- "do we know where they live"
- every month at least once a week
- 30 / day (?)
- 3 in teh morning, 3 in teh evening
-
dump by month
-
dump by user
