ncaahoopR is an R package for working with NCAA Basketball Play-by-Play Data. It scrapes play-by-play data
and returns it to the user in a tidy format and allows the user to explore the data with assist networks and in-game win-probability charts.
Note: ncaahoopR scrapes data from ESPN. Since ESPN is currently updating many college basketball pages, such as schedules and rosters,
some functionality may be temporarily unavailable. Once we approach the beginning of the season, all functionality should work as desired.
You can install ncaahoopR from GitHub with:
# install.packages("devtools")
devtools::install_github("lbenz730/ncaahoopR")
NOTE: Recently, some users have encountered issues with certain dependencies failing to install properly. If asked the option to compile any packages from source rather than installing existing binaries, choose 'No'.
Several functions use ESPN game_ids. You can find the game_id in the URL for the game summary,
as shown in the URL for the summary of the UMBC-Virginia game below.

get_pbp(team): Game entire current season's worth of play-by-play data for a given team.get_pbp_game(game_ids): Get play-by-play data for a specific vector of ESPN game_ids.get_roster(team): Get a particular team's roster.get_schedule(team): Get a team's schedule.get_game_ids(team): Get a vector of ESPN game_ids for all games in whichteamplays in.get_master_schedule(year, month, day): Get schedule of all games for given date.
The team parameter in the above functions must be a valid team name from the ids dataset built into the package. See the Datasets section below for more details.
Win Probability Charts
There are two functions for plotting win probability charts, one that uses base graphics (wp_chart), and another that uses the ggplot2 library (gg_wp_chart). Both are maintained, as graphics in base R have some nice concatenation principles.
wp_chart(game_id, home_col, away_col, show_legend = T)
game_idESPN game_id for the desired win probability chart.home_colChart color for home team.away_col: Chart color for away team.show_legend: Logical, whether or not to show legend/text on chart. Default =TRUE.
gg_wp_chart(game_id, home_col, away_col, show_labels = T)
game_idESPN game_id for the desired win probability chart.home_colChart color for home team.away_col: Chart color for away team.show_labels: Logical whether Game Excitement Index and Minimum Win Probability metrics should be displayed on the plot. Default =TRUE.
Game Flow Charts
game_flow(game_id, home_col, away_col)
game_idESPN game_id for the desired game flow chart.home_colChart color for home team.away_col: Chart color for away team.
Game Excitement Index
game_exciment_index(game_id)
Returns GEI (Game Excitement Index) for given ESPN game_id. For more information about how these win-probability charts are fit and how Game Excitement Index is calculated, check out the below links
Game Control Measures
average_win_prob(game_id)
- ESPN game_id for which to compute time-based average win probability (from perspective of home team).
average_score_diff(game_id)
- ESPN game_id for which to compute time-based average score differential (from perspective of home team).
Traditional Assist Networks
assist_net(team, season, node_col, three_weights, threshold, message = NA)
teamis the ESPN team name, as listed in theidsdata frame.season: Options include "2018-19" (for entire season), or a vector of ESPN game IDs.node_colis the node color for the graph.three_weights(default =TRUE): Logical. If TRUE, assisted three-point shots are given 1.5 weight. If FALSE, assisted three-point shots are given weight 1. In both cases, assisted two-point shots are given weight 1.threshold: Number between 0-1 indicating minimum percentage of team assists/baskets a player needs to exceed to be included in network. Default = 0.message(default =NA) Option for custom message to replace graph title when using a subset of the season (e.g. conference play).
Circle Assist Networks and Player Highlighting
circle_assist_net(team, season, highlight_player, highlight_color, three_weights, message = NA)
teamis the ESPN team name, as listed in theidsdata frame.season: Options include "2018-19" (for entire season), or a vector of ESPN game IDs.highlight_player: Name of player to highlight in assist network.NAyields full team assist network with no player highlighting. Default =NA.highlight_color: Color of player links to be highlighted.NAifhighlight_playerisNA.three_weights(default =TRUE): Logical. If TRUE, assisted three-point shots are given 1.5 weight. If FALSE, assisted three-point shots are given weight 1. In both cases, assisted two-point shots are given weight 1.threshold: Number between 0-1 indicating minimum percentage of team assists/baskets a player needs to exceed to be included in network. Default = 0.
There are currently three functions for scraping and plotting shot location data. These functions are written by Meyappan Subbaiah.
get_shot_locs(game_id): Returns data frame with shot location data when available.
game_id: ESPN game_id from which shot locations should be scraped.
game_shot_chart(game_id, heatmap = F): Plots shots for a given game.
game_id: ESPN game_id from which shot locations should be scraped.heatmap: Logical, whether to use density-heat map or plot individual points. Default =FALSE.
team_shot_chart(game_id, team, heatmap = F): Plots shots for a given game.
game_id: Vector ESPN game_id from which shot locations should be scraped.team: Which team to chart shots for.heatmap: Logical, whether to use density-heat map or plot individual points. Default =FALSE.
dict A dataframe for converting between team names from various sites.
NCAA: the name of the team, as listed on the NCAA websiteESPN: the name of the team, as listed on the ESPN URLsESPN_PBP: the name of the team, as listed on the ESPN Play-By-Play logsWarren_Nolan: the name of the team, as listed on WarrenNolan.comTrank: the name of the team, as listed on barttorvik.comname_247: the name of the team, as listed on 247Sports.com
ids A data frame for converting between team names from various sites.
team: the name of the team to be supplied to function in ncaahoopR packageid: team id; used in ESPN URLslink: link; used in ESPN URLs
ncaa_colors A data frame of team color hex codes, pulled from teamcolorcodes.com. Note that hexcodes are only available for 248 of 353 Division 1 teams.
ncaa_name: The name of the team, as listed on the NCAA website (same asdict$NCAA)espn_name: The name of the team, as listed on the ESPN URLs (same as dict$ESPN)}primary_color: Hexcode for team's primary color.secondary_color: Hexcode for team's secondary color, when available.tertiary_color: Hexcode for team's tertiary color, when available.color_4: Hexcode for team's 4th color, when available.color_5: Hexcode for team's 5th color, when available.color_6: Hexcode for team's 6th color, when available.
 Primary and secondary colors for available teams.
These datasets can be loaded by typing data("ids"), data("ncaa_colors"), or data("dict"), respectively.
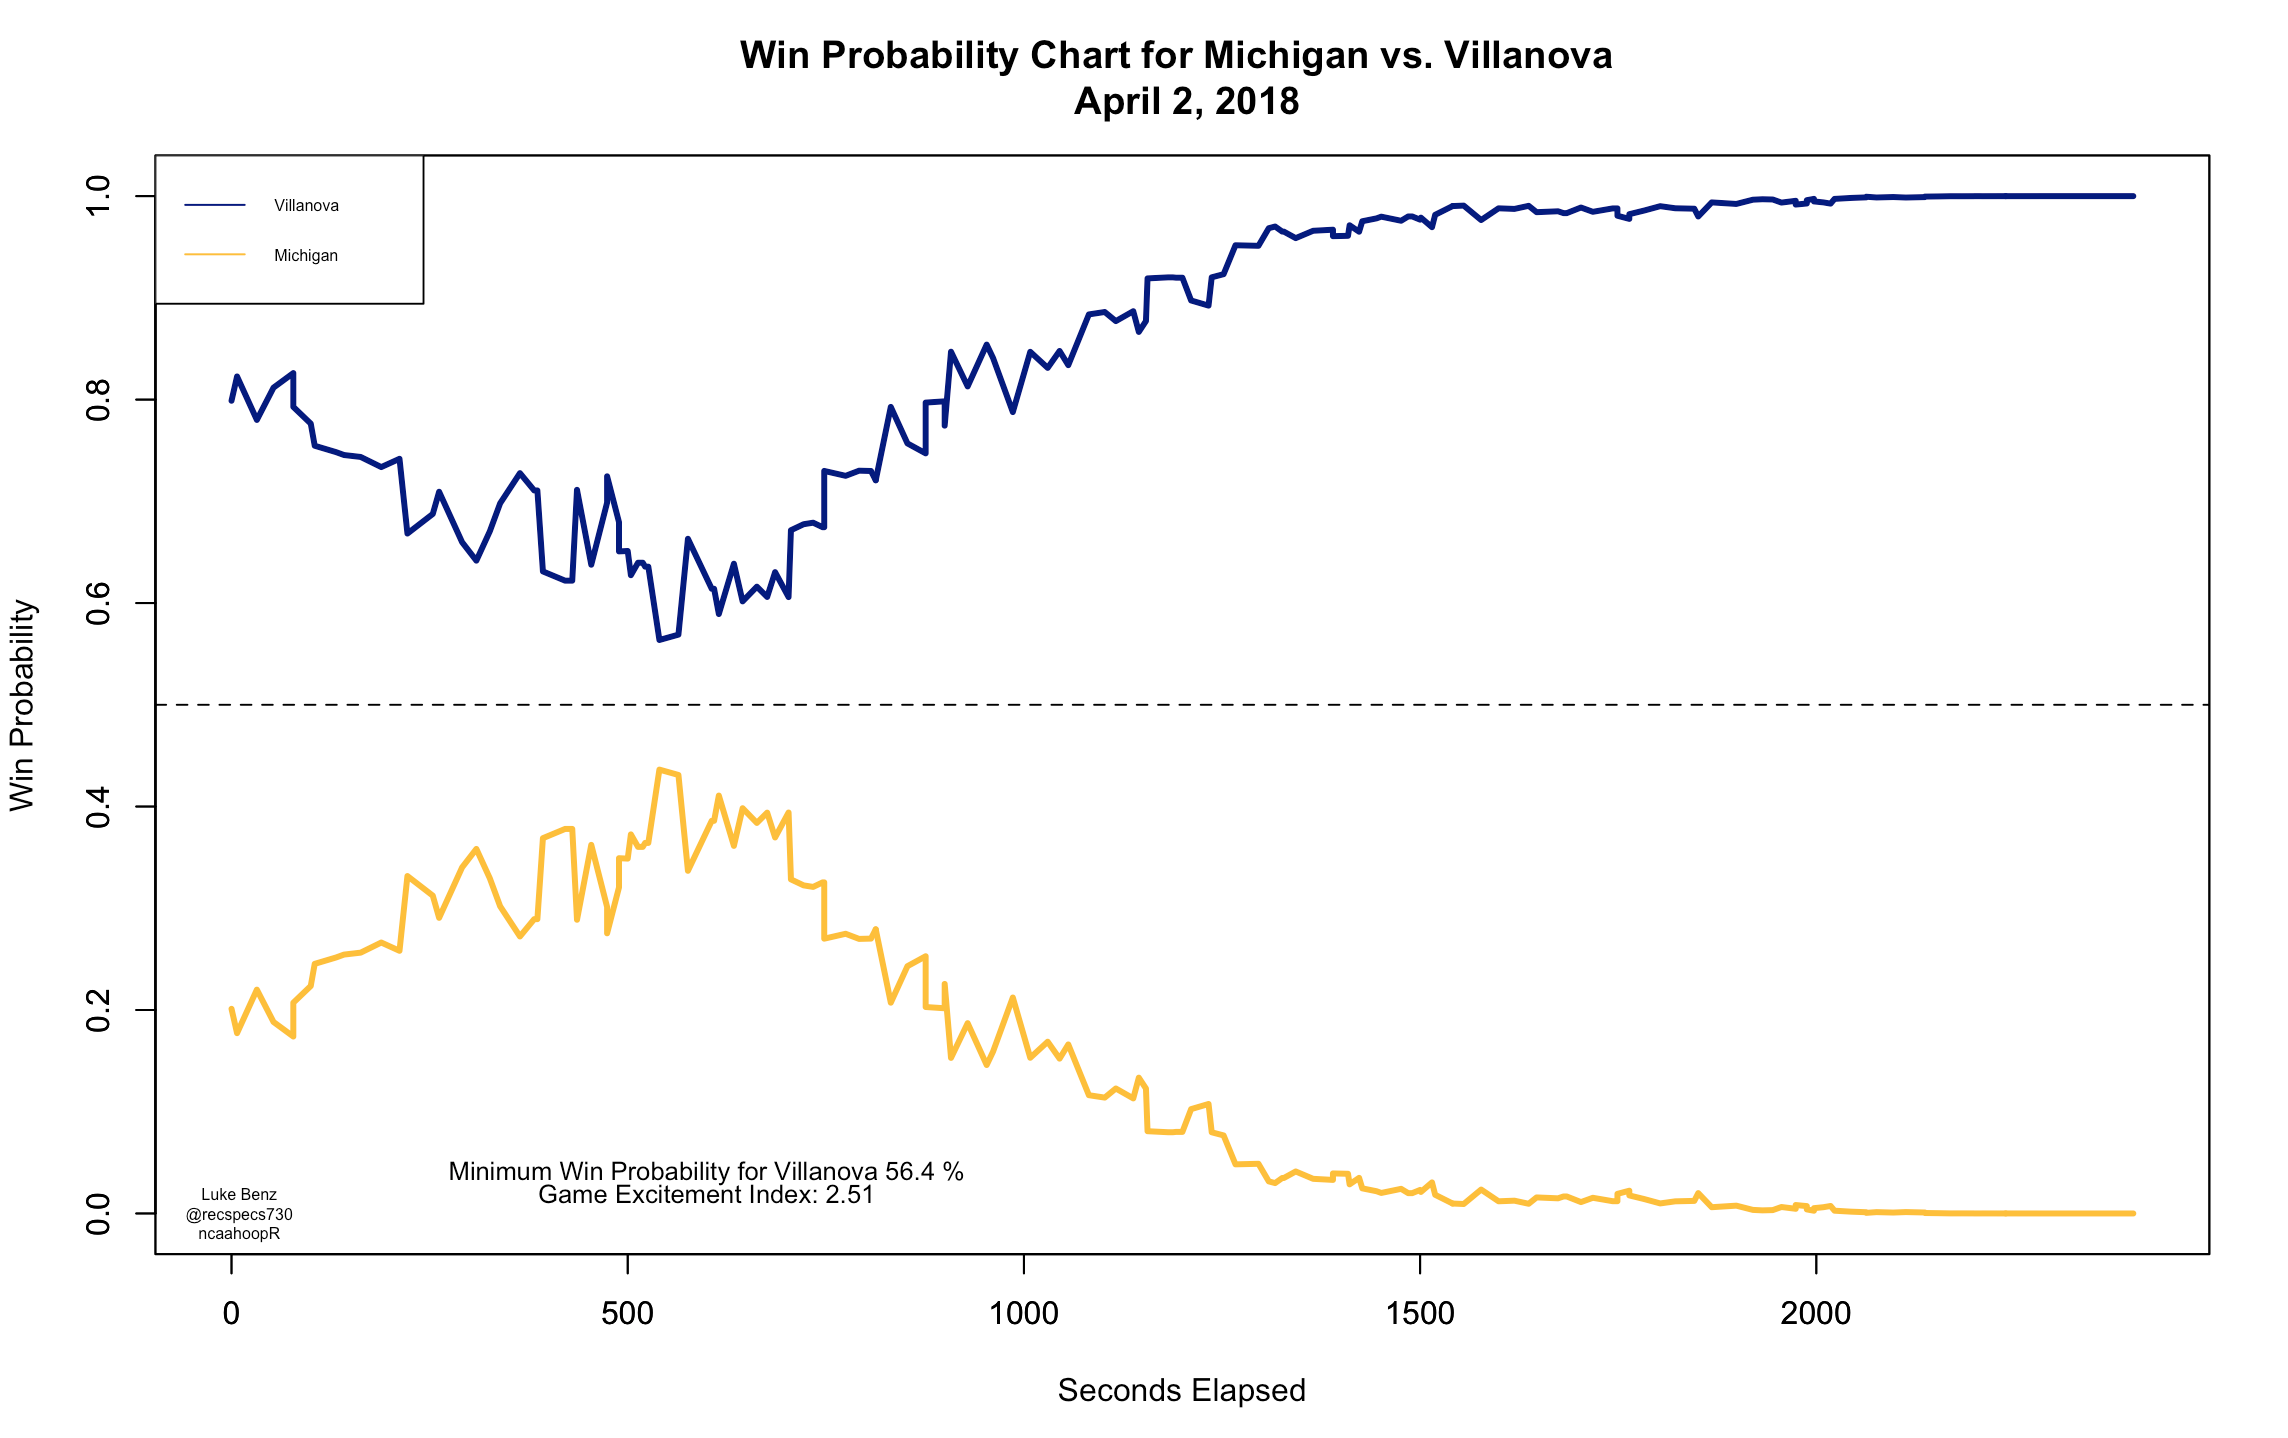
wp_chart(game_id = 401025888, home_col = "navy", away_col = "goldenrod1")
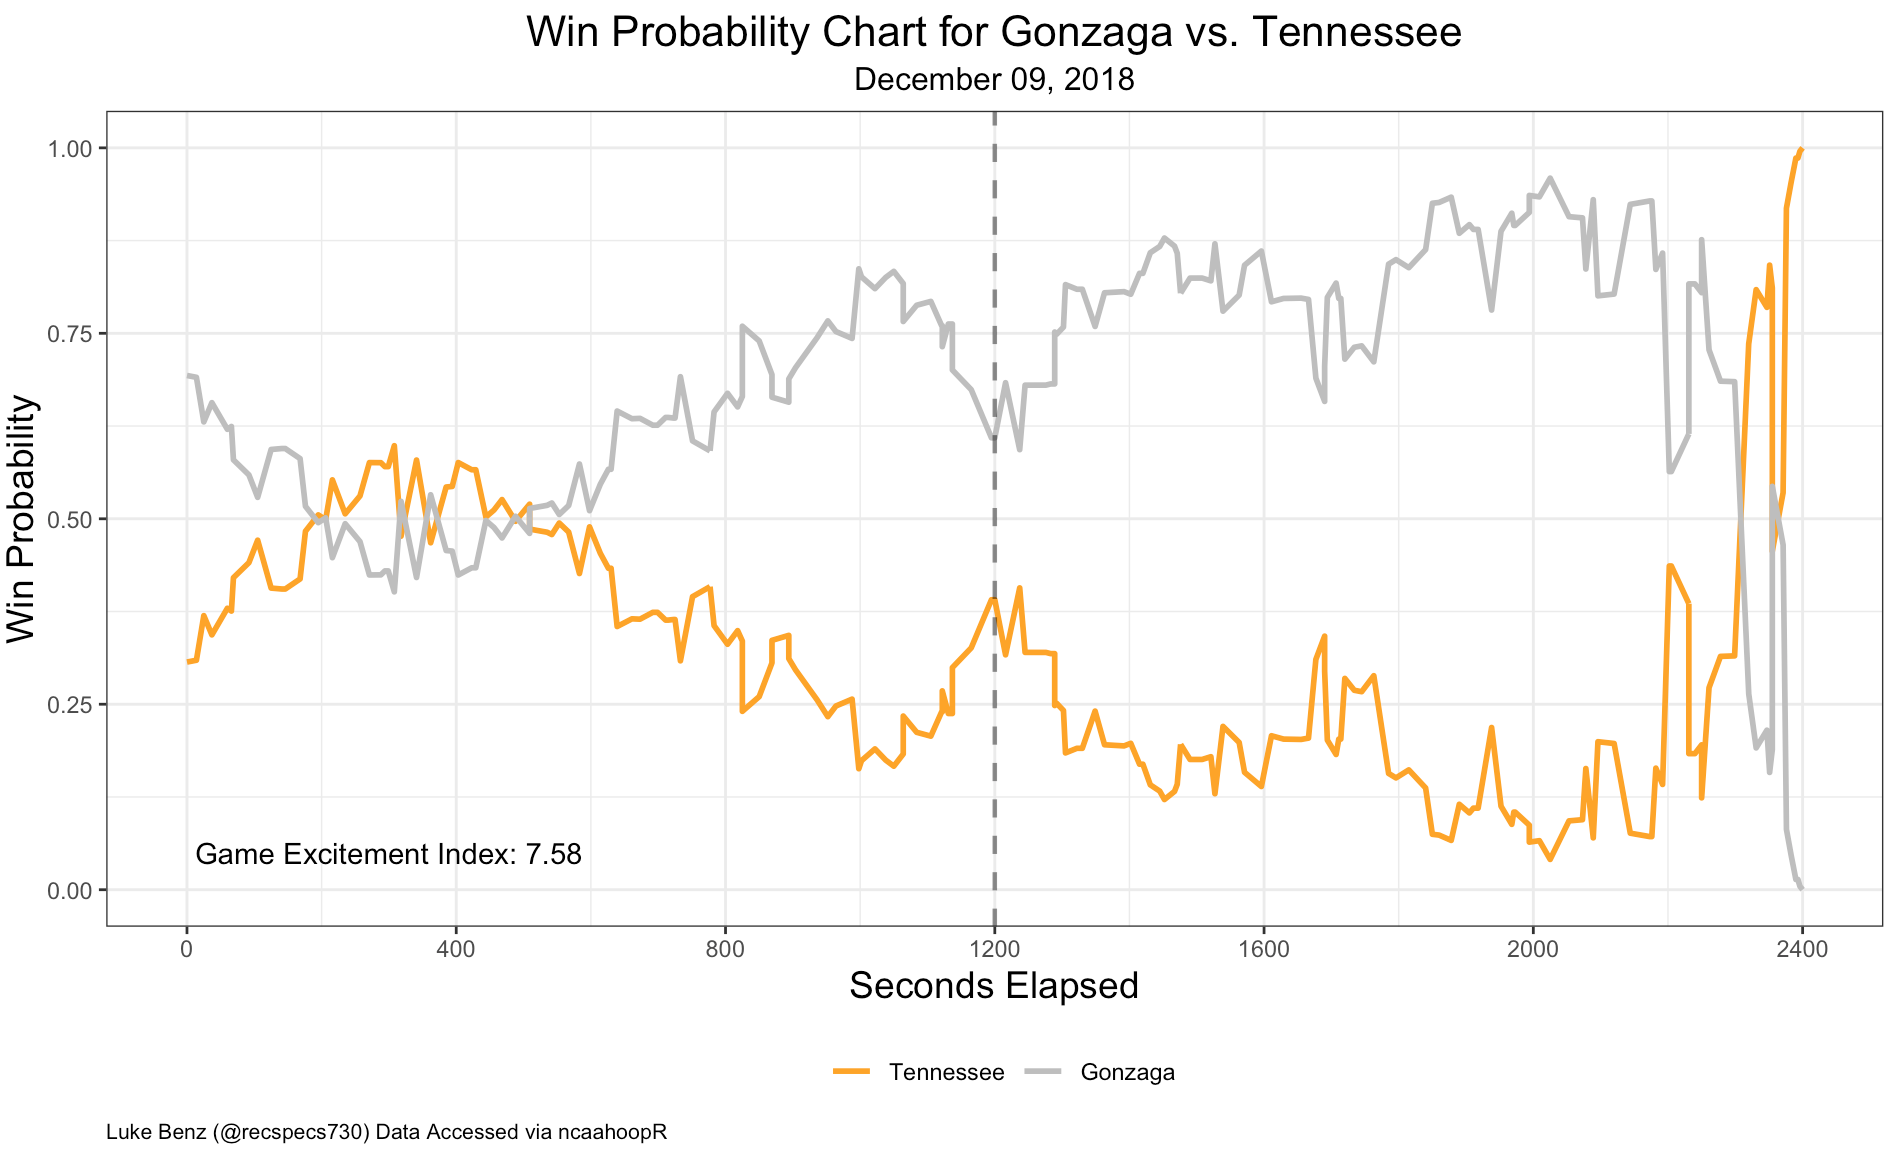
gg_wp_chart(game_id = 401082978, home_col = "gray", away_col = "orange")
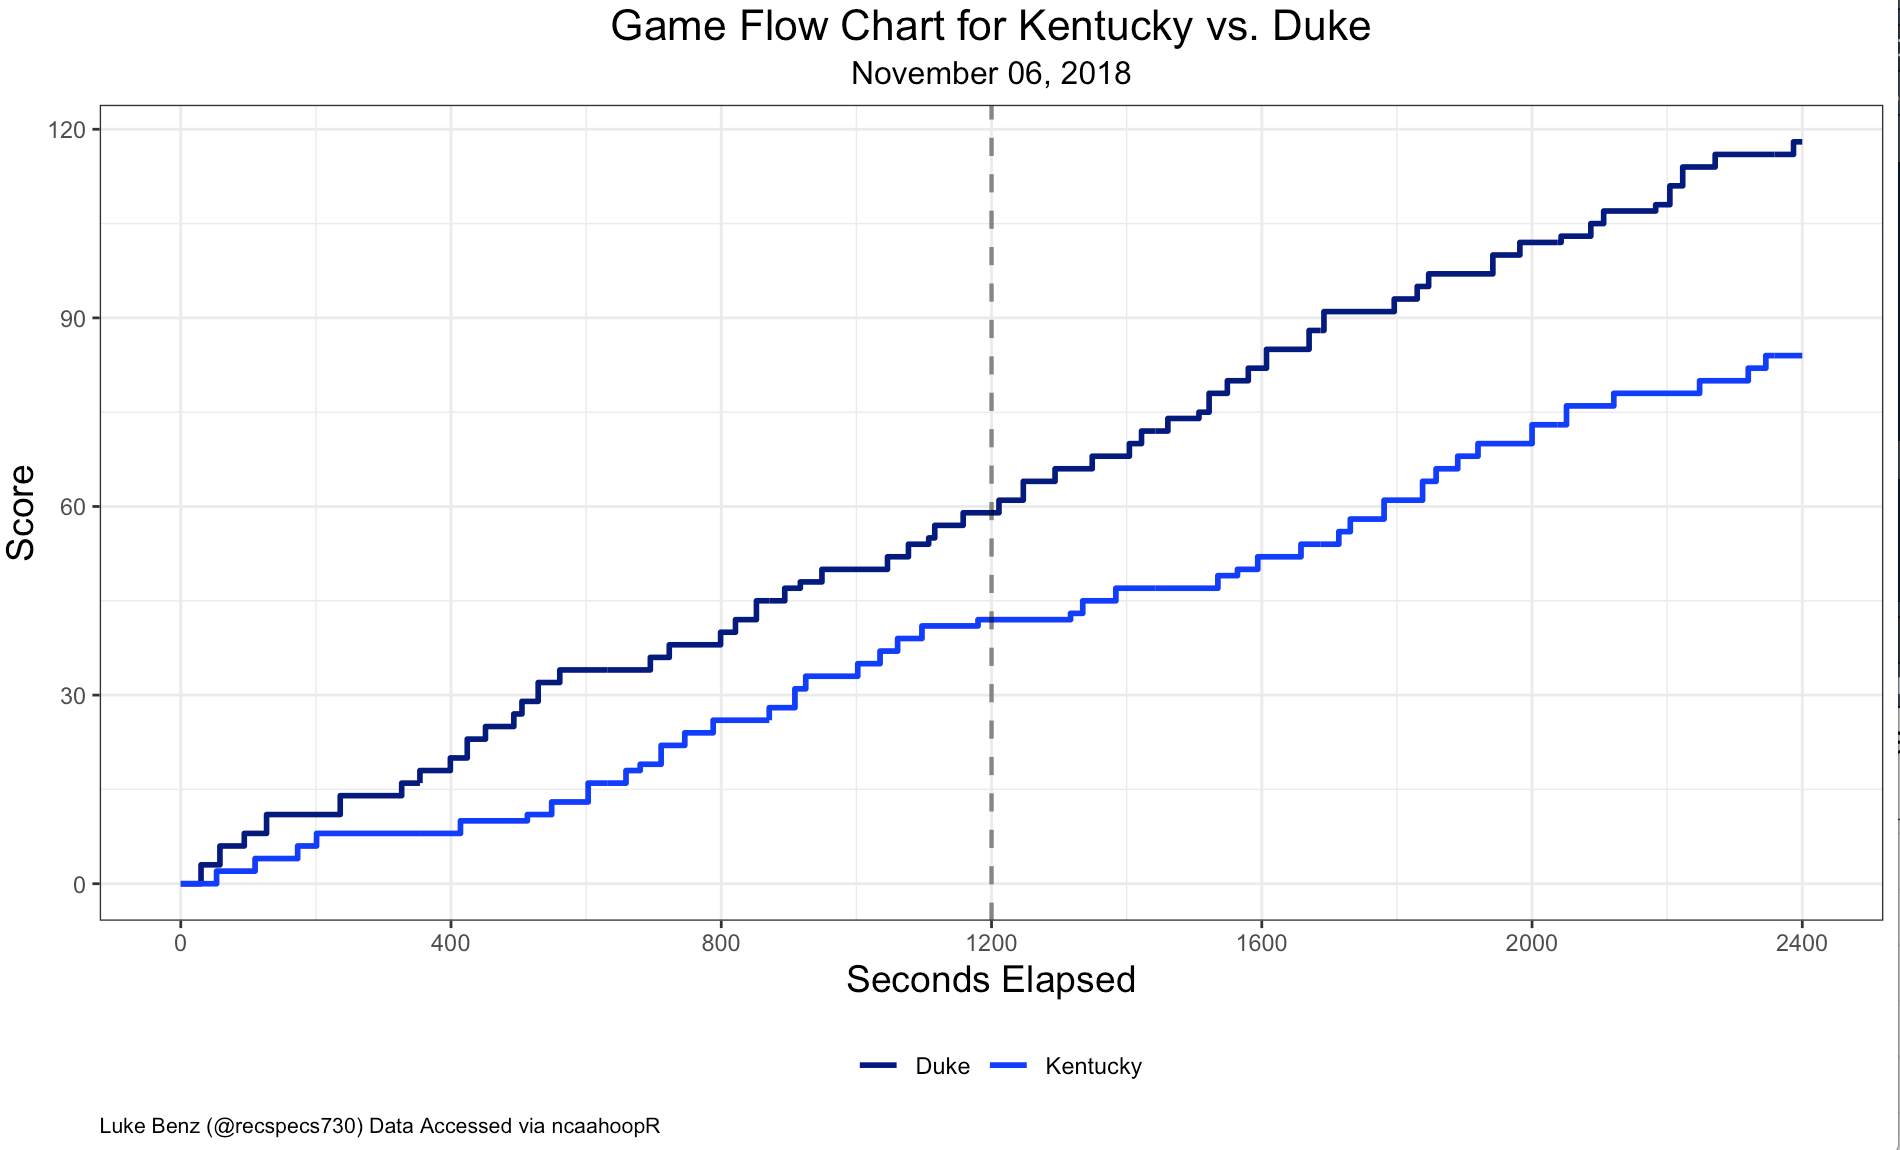
game_flow(game_id = 401082669, home_col = "blue", away_col = "navy")
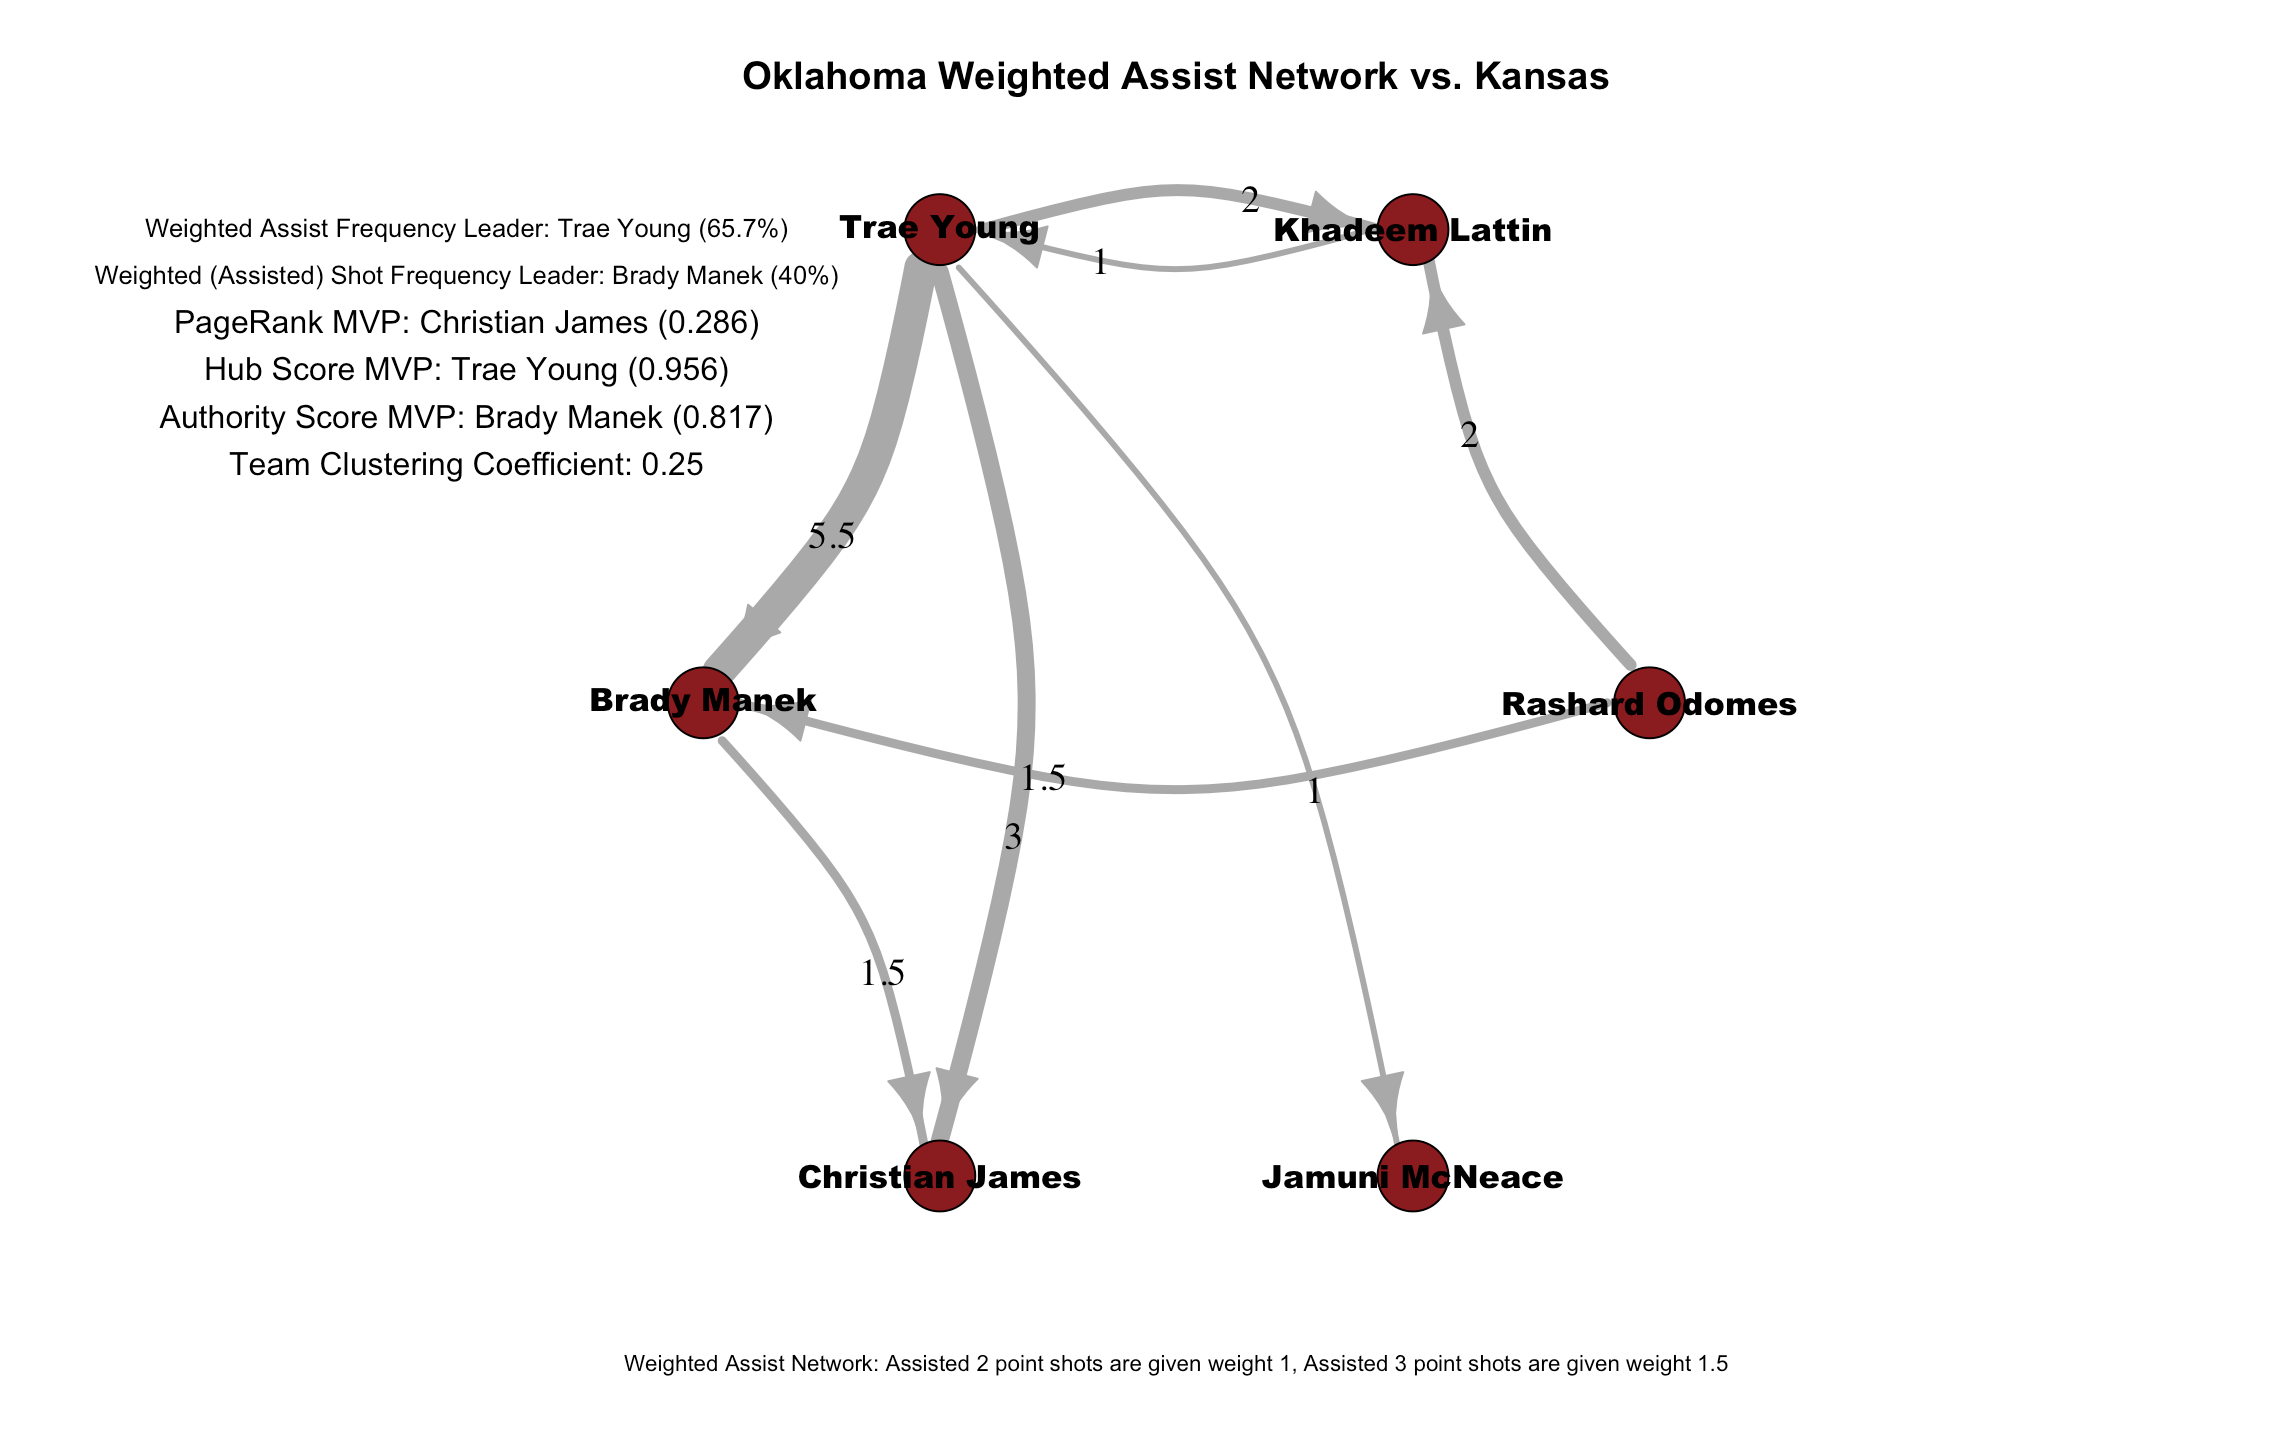
assist_net(team = "Oklahoma", node_col = "firebrick4", season = 400989185)
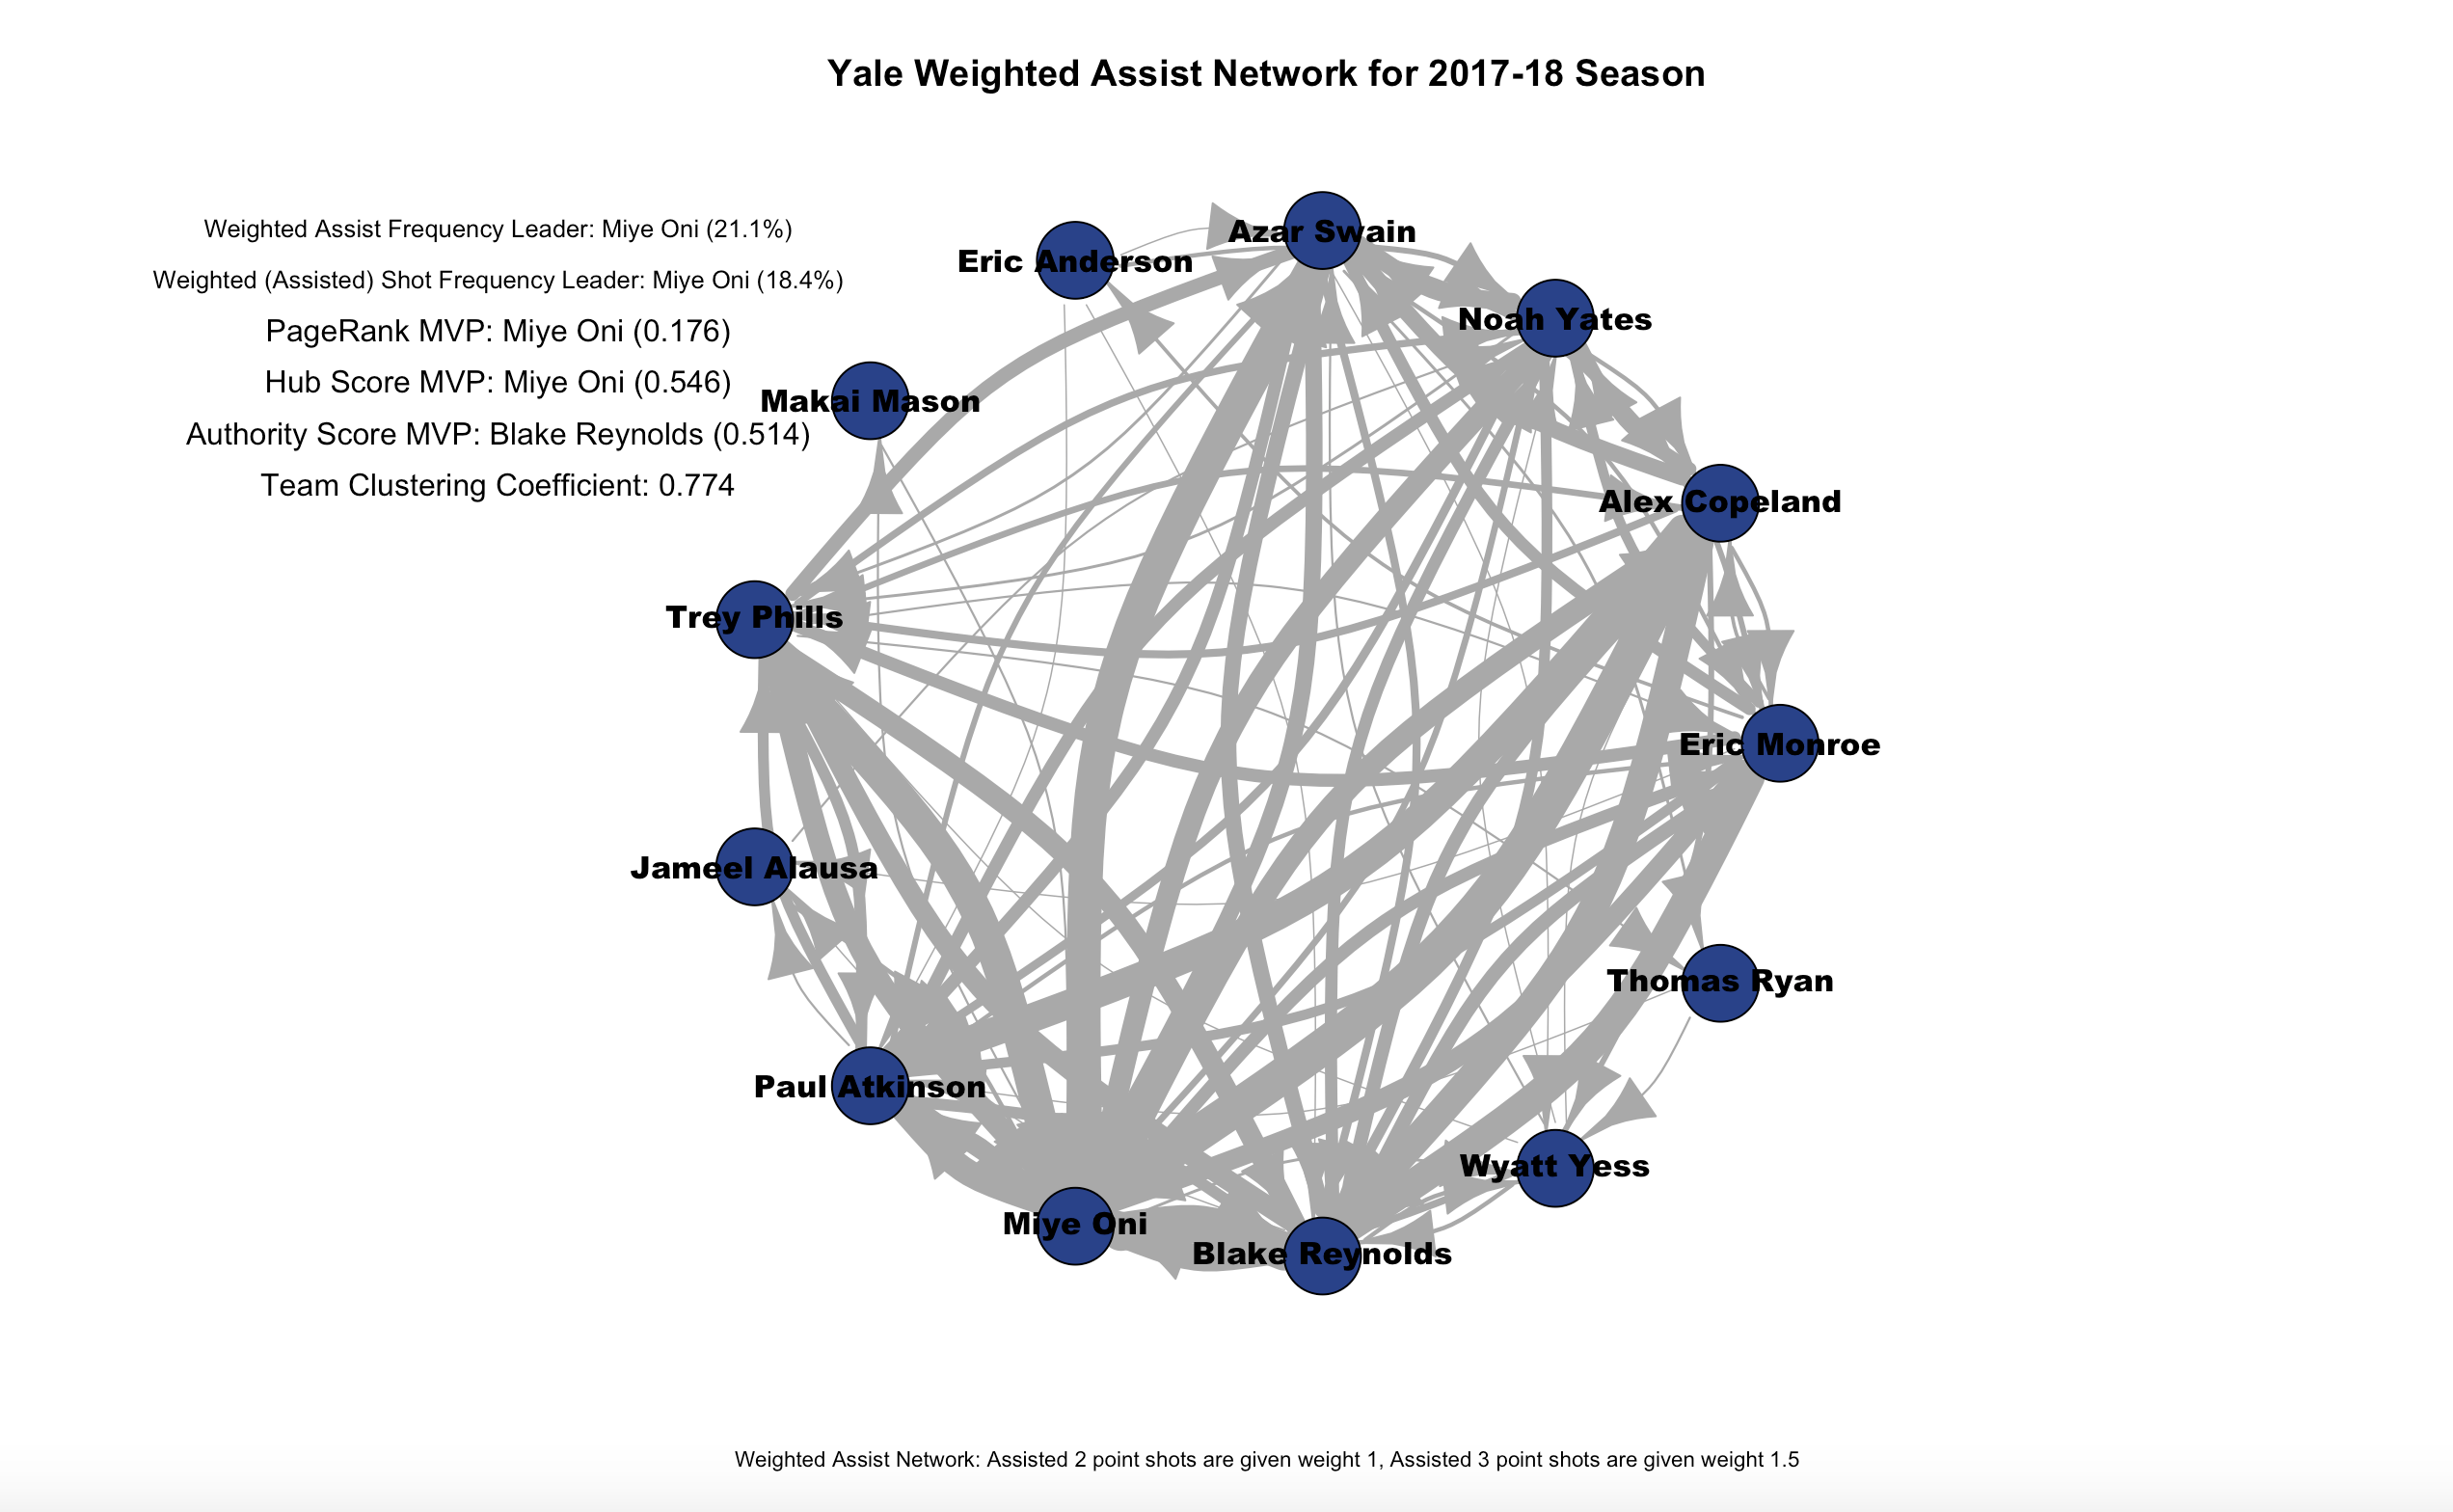
assist_net(team = "Yale", node_col = "royalblue4", season = "2017-18")
NOTE: The argument season = "2017-18" would be replaced with the current season. Backdated charts are currently not available.
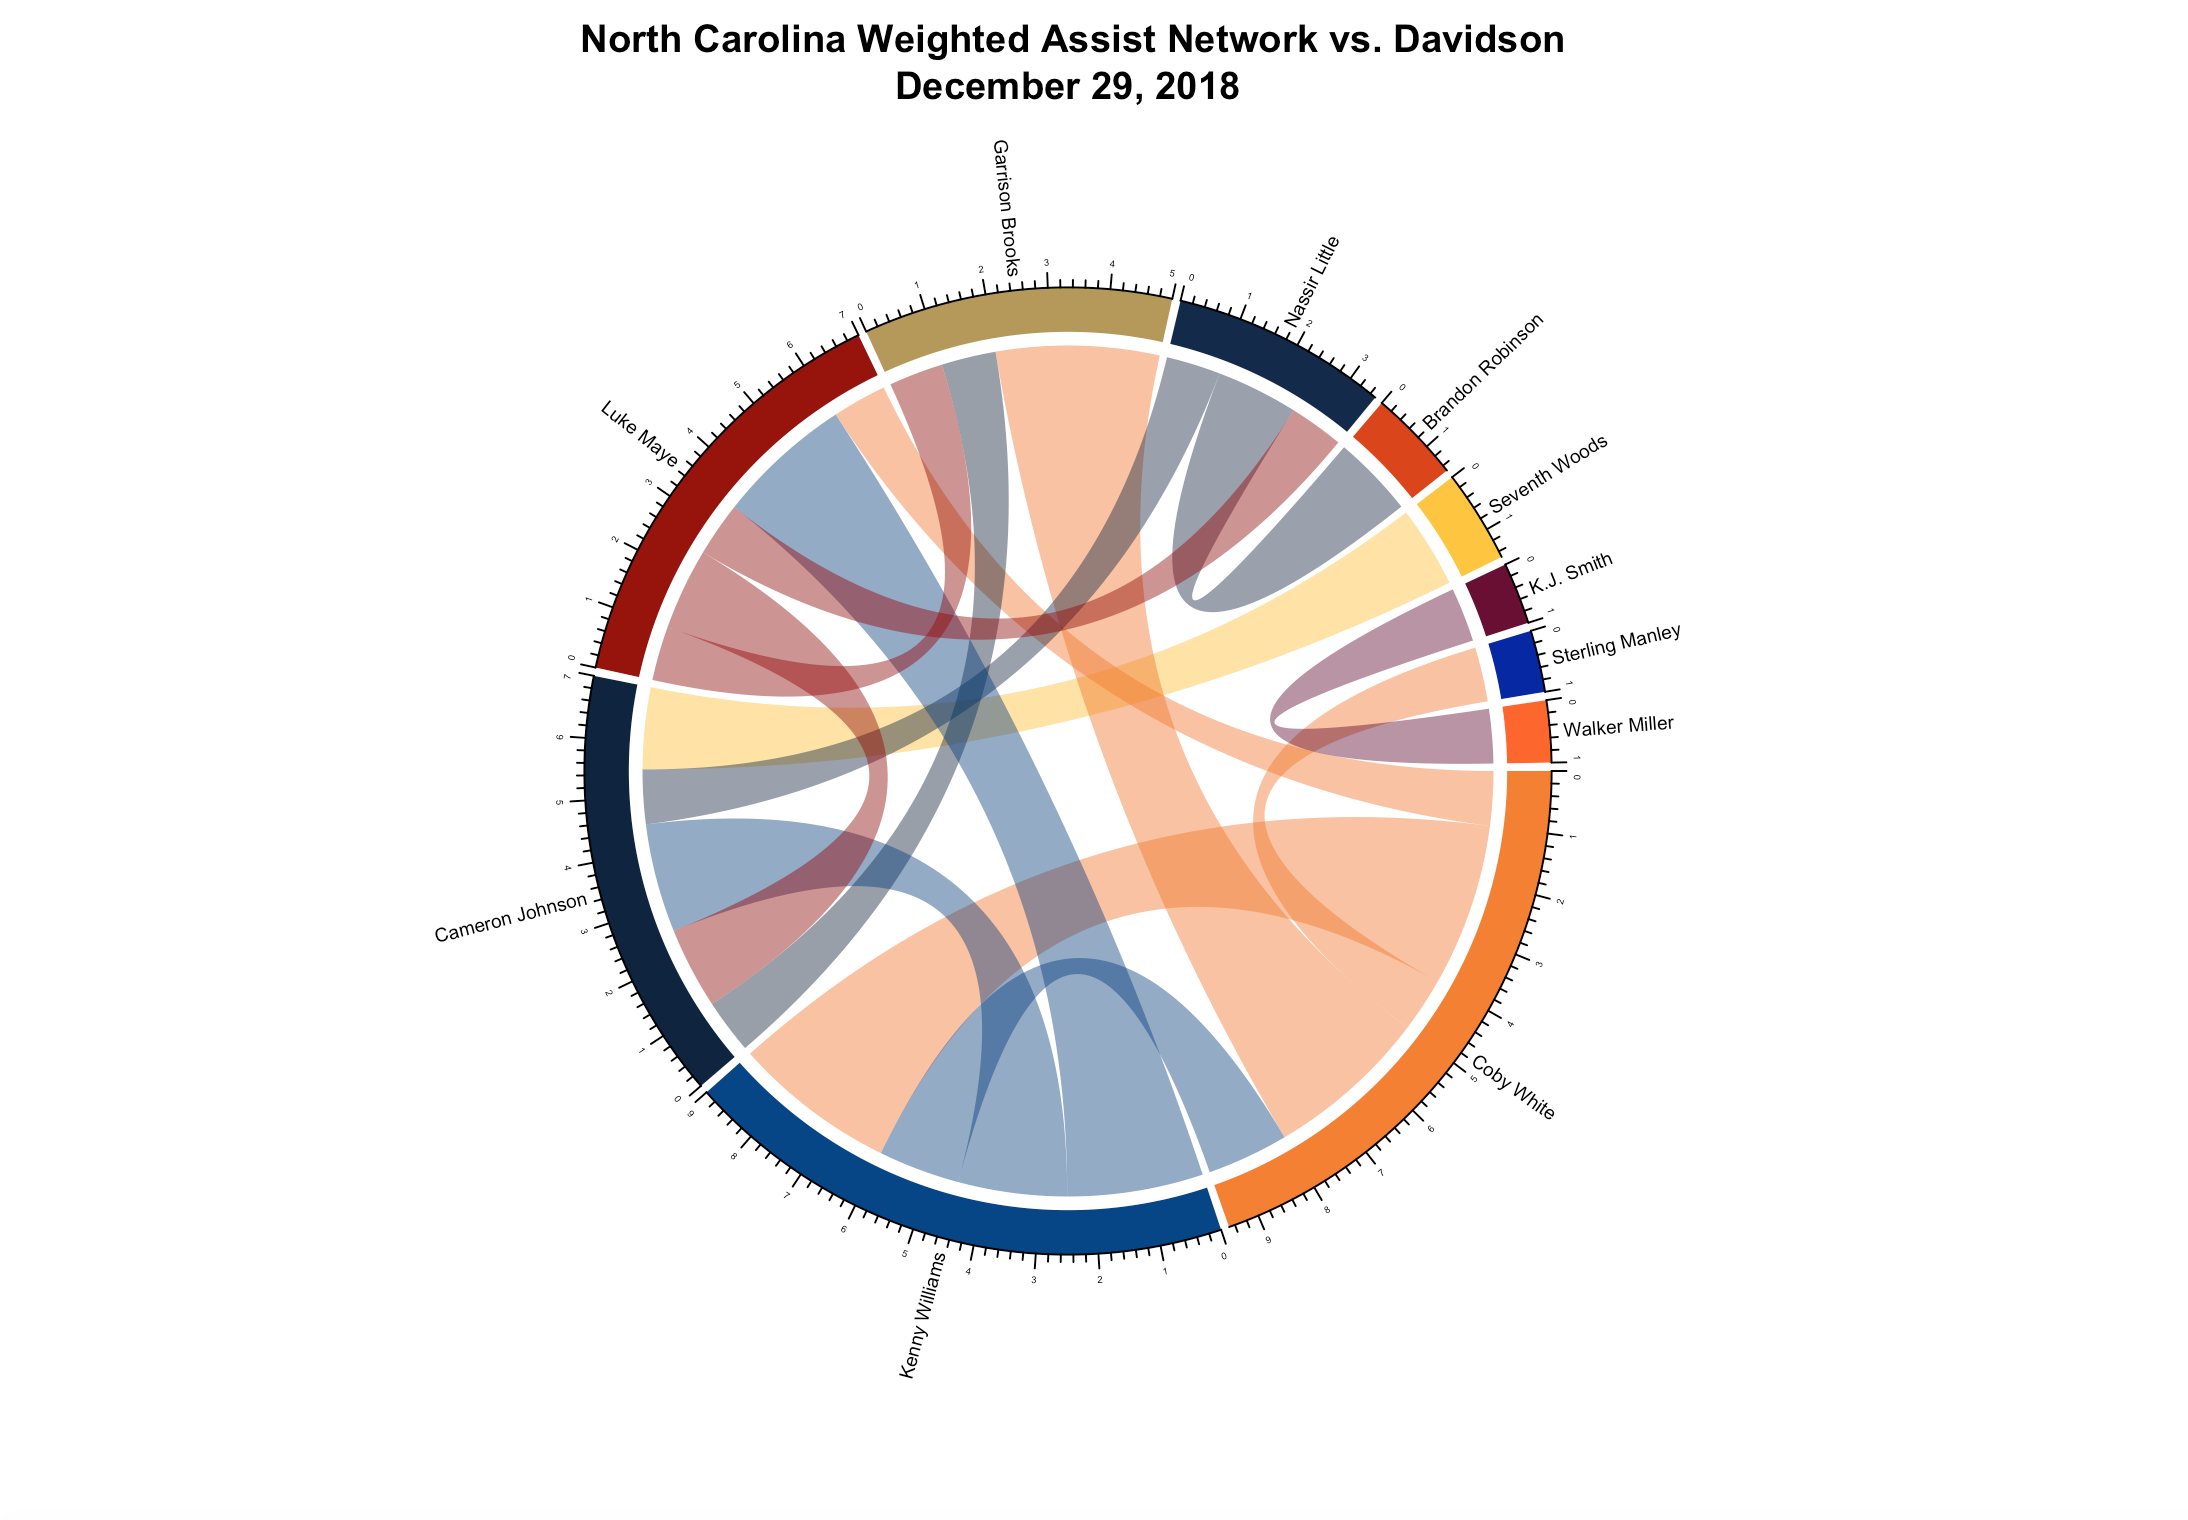
circle_assist_net(team = "UNC", season = 401082861)
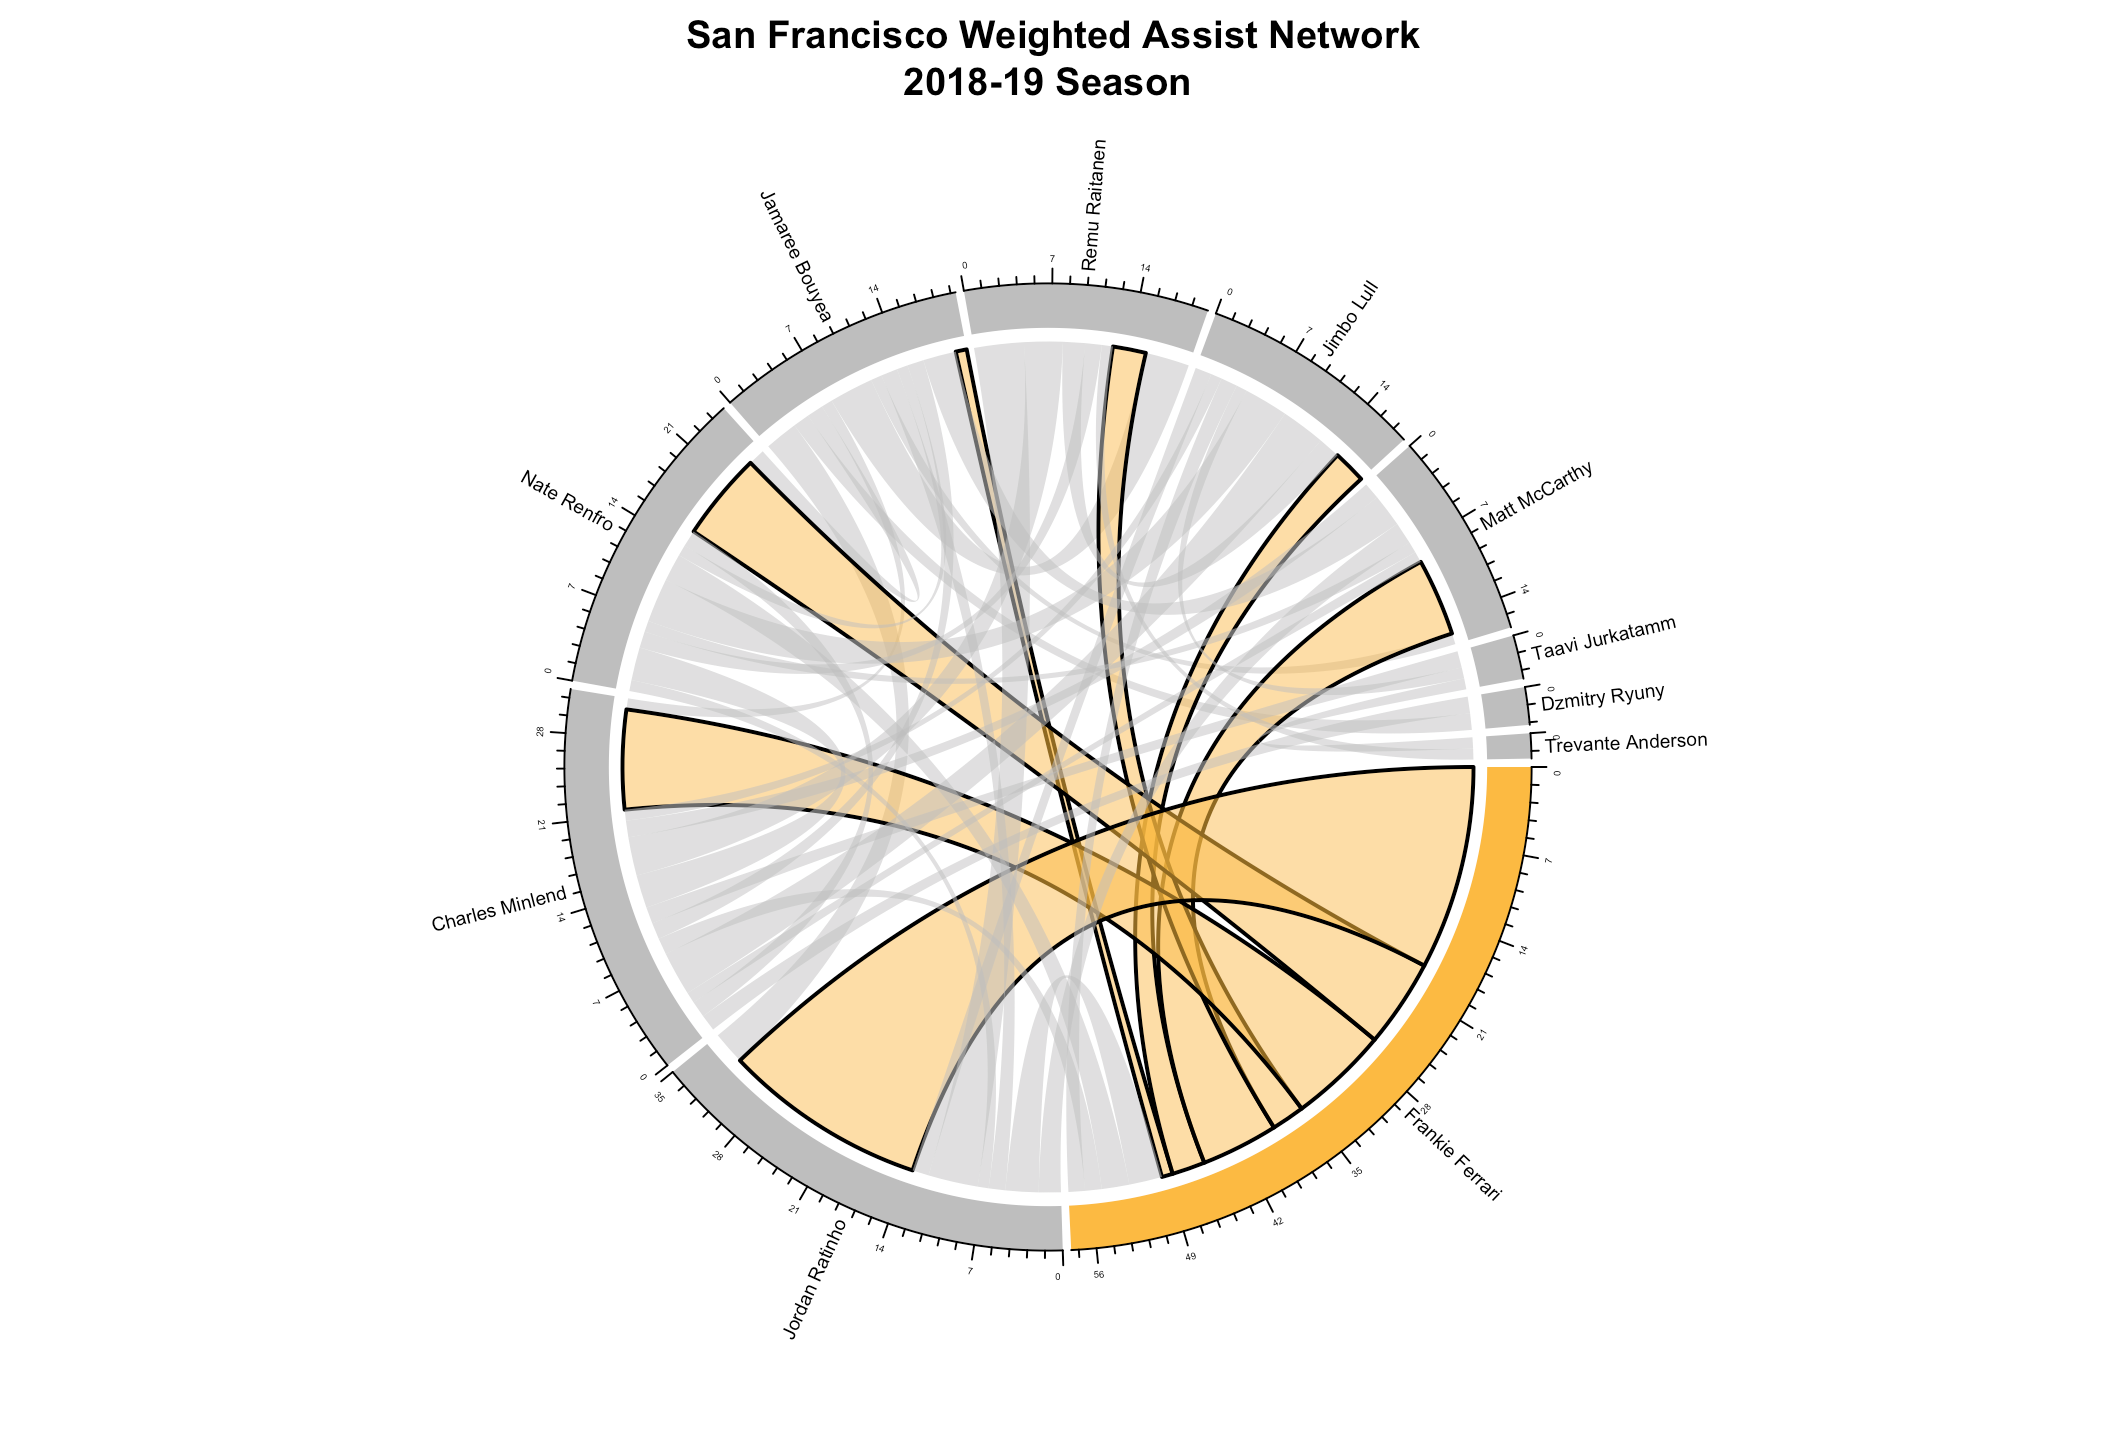
circle_assist_net(team = "San Francisco", season = "2018-19", highlight_player = "Frankie Ferrari", highlight_color = "#FDBB30")
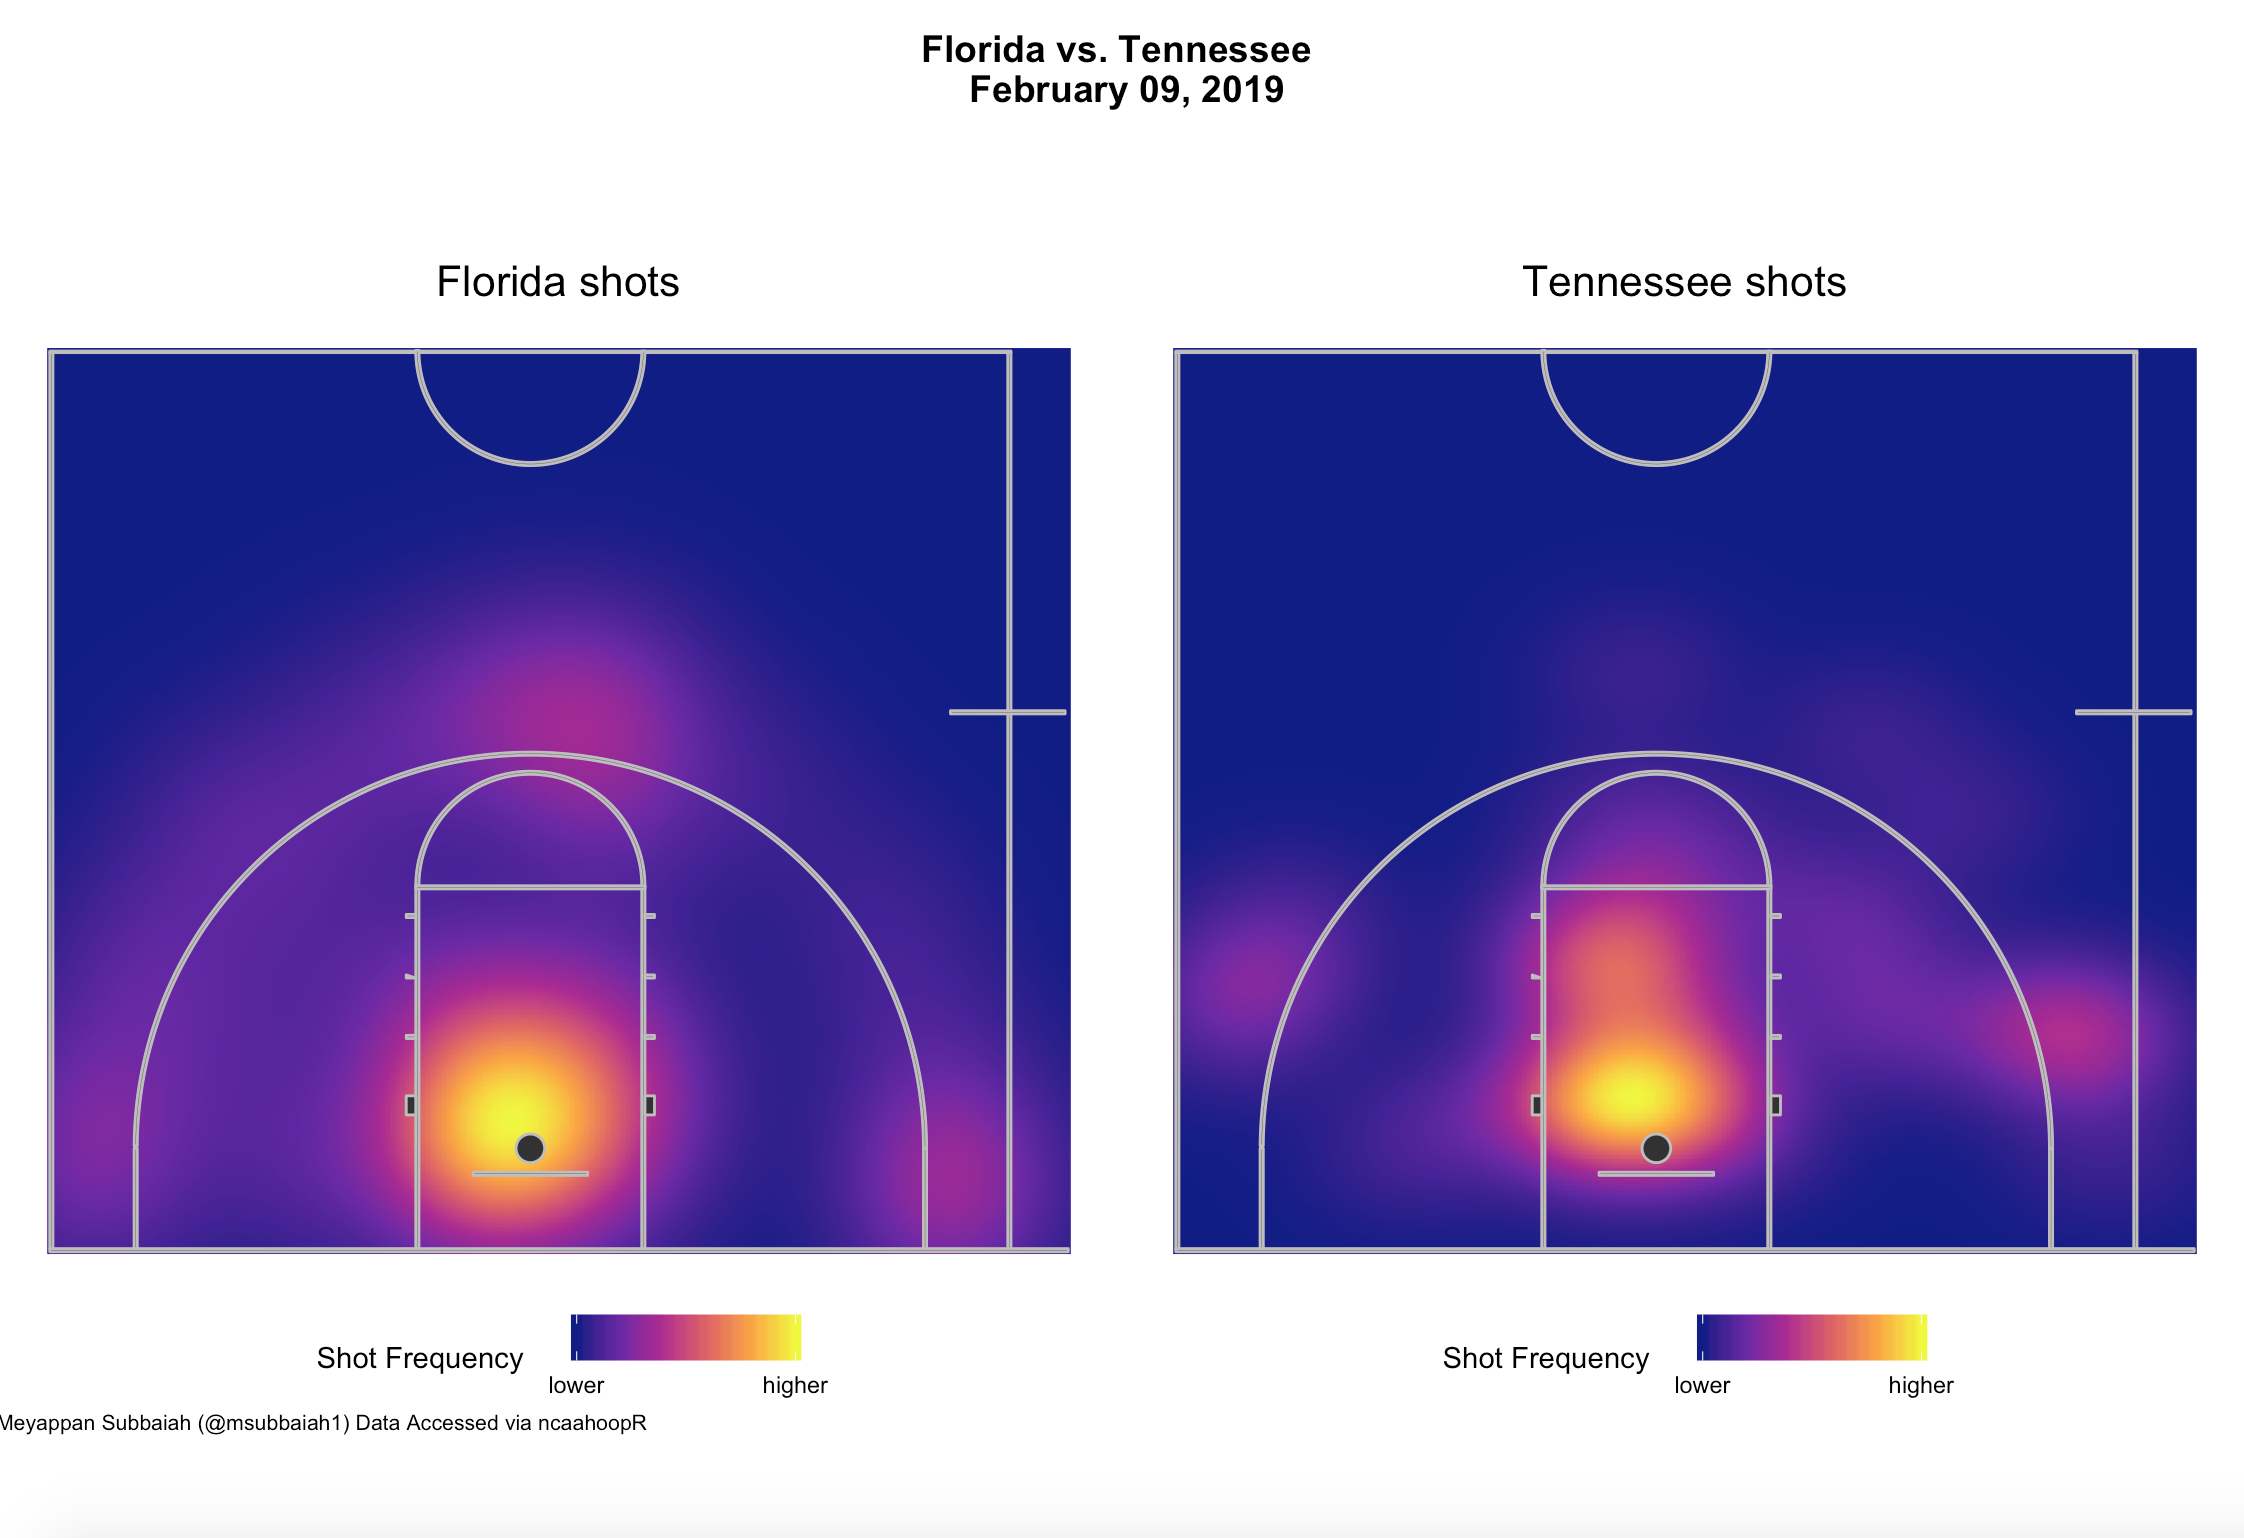
game_shot_chart(game_id = 401083557, heatmap = T)
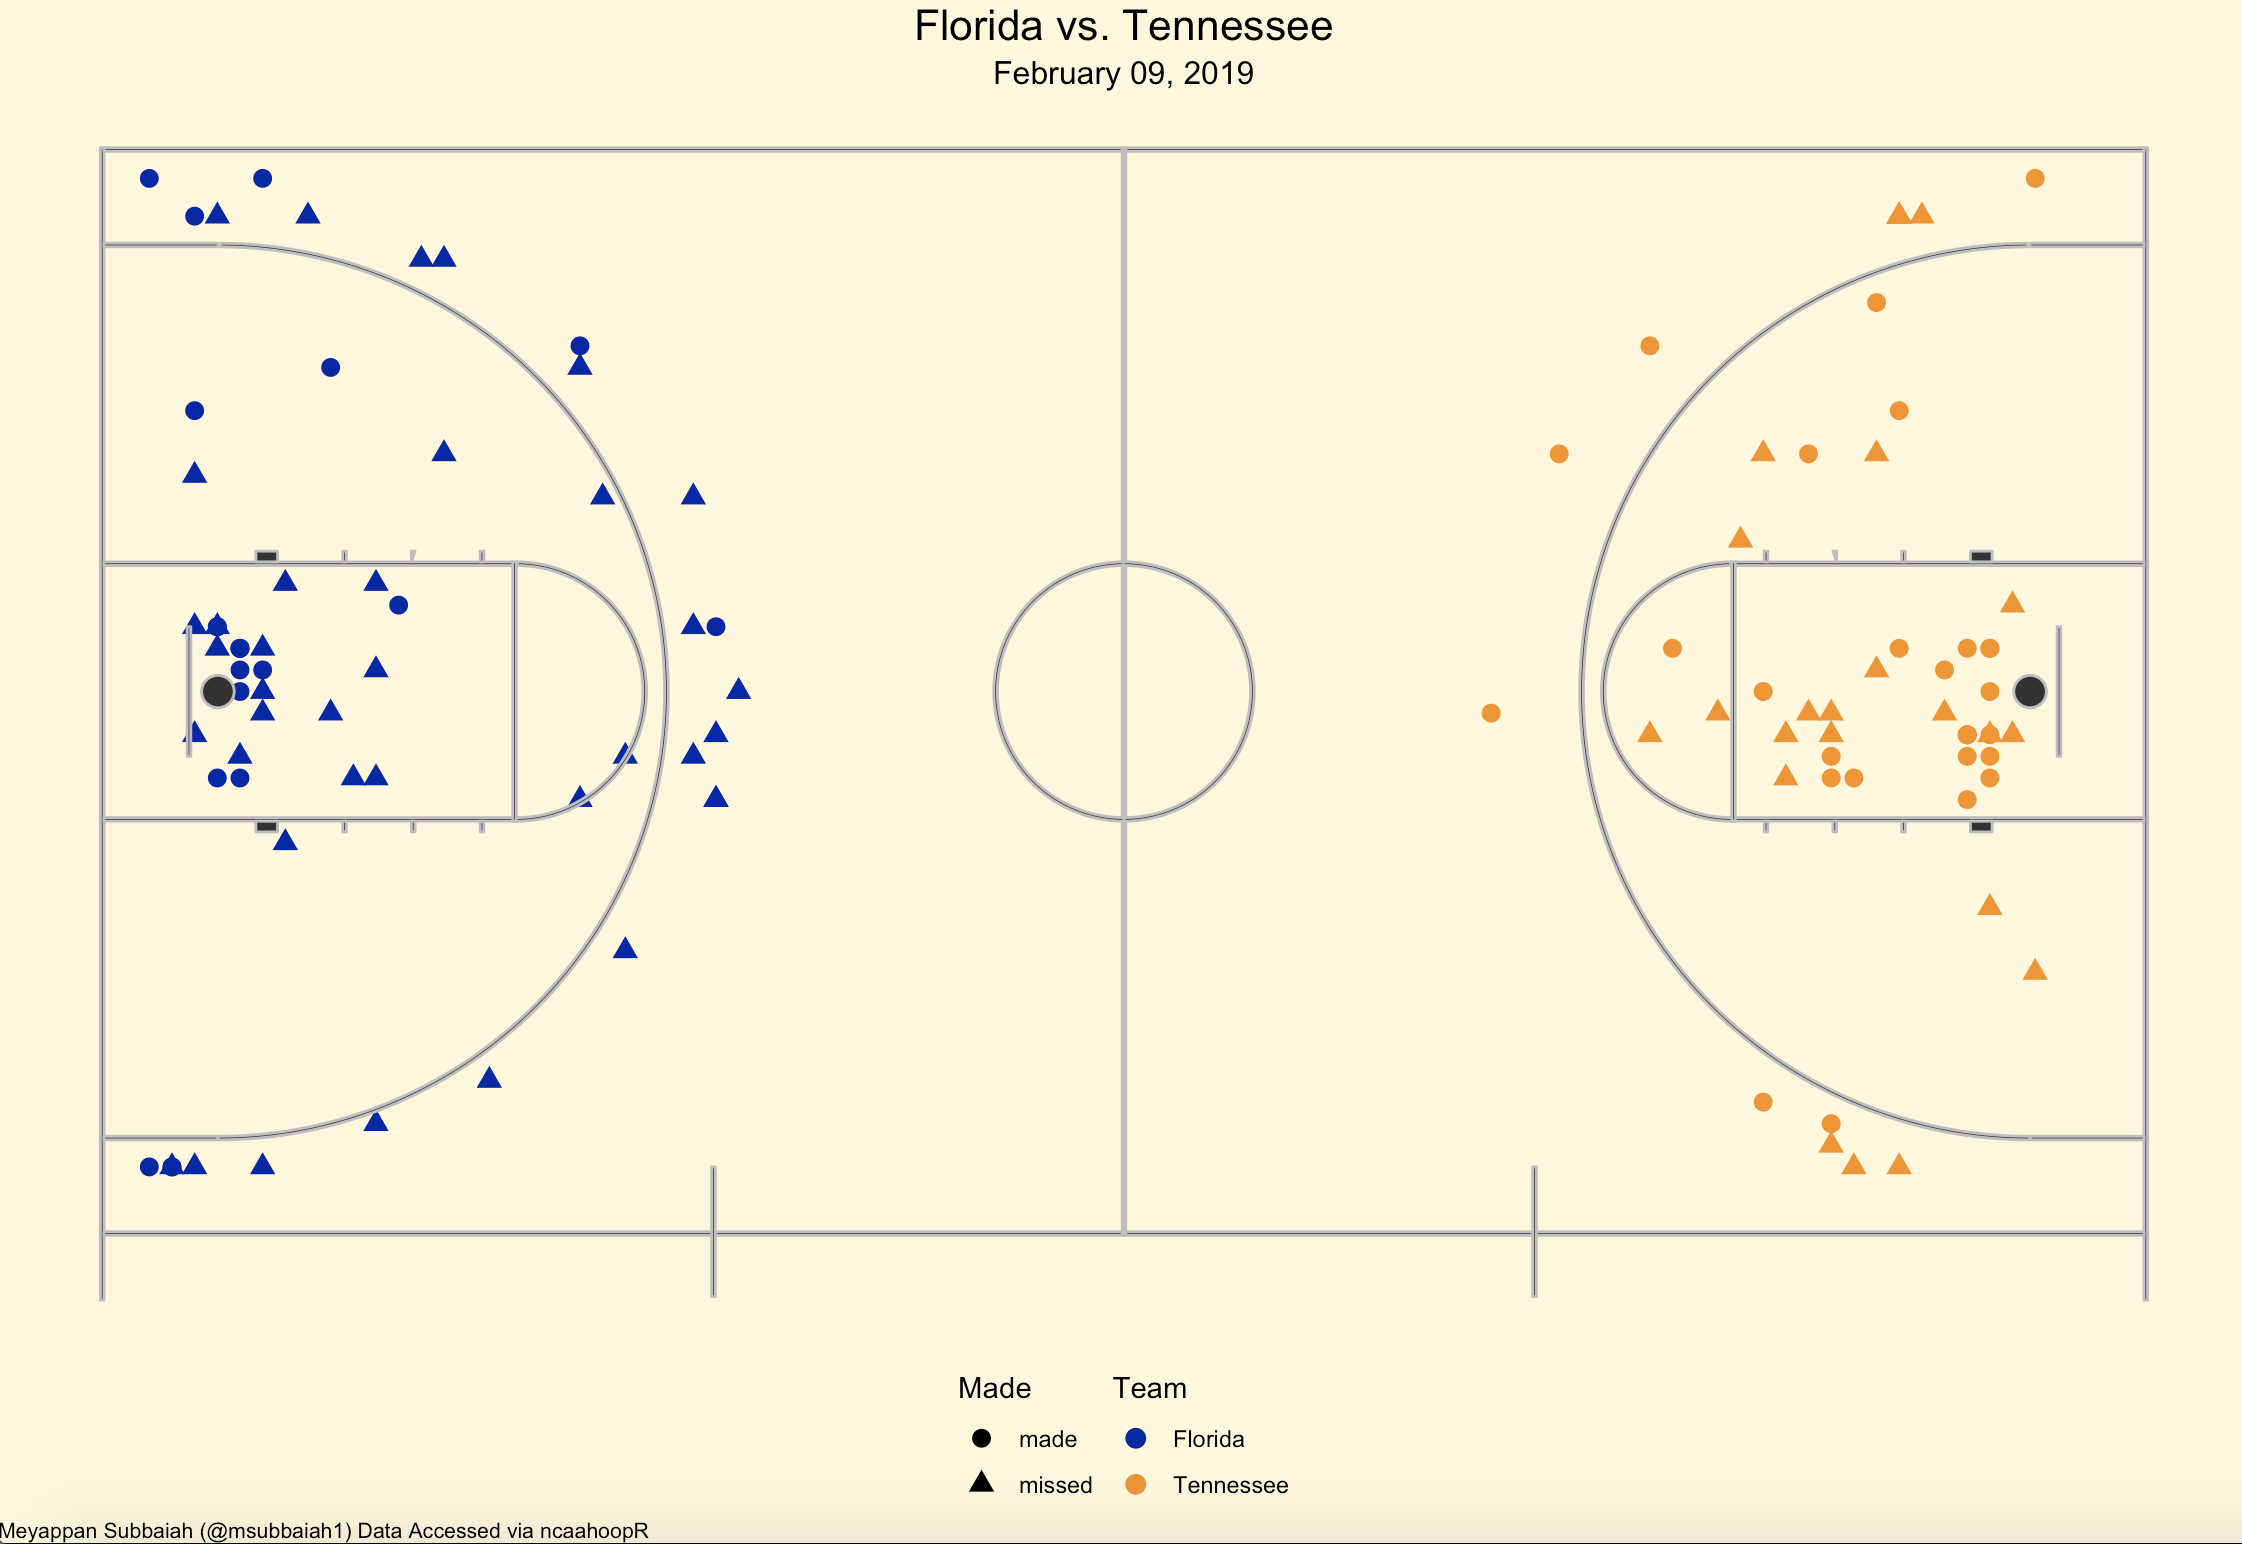
game_shot_chart(game_id = 401083557)
Play-by-Play files contain the following variables:
play_id: Unique identifier of play/event in sequence of game events.half: Period of action in the game. 1 and 2 denote the first and second halves of play, while 3 denotes OT1, 4 denotes OT2 etc.time_remaining_half: Time remaining in the period as it would appear on a scoreboard.secs_remaining: Time remaining in regulation, in seconds.secs_remaining_absolute: The time remaining until the game is over, in seconds. For example a game that goes to overtime would begin with 2700 seconds remaining (2400 for regulation and 300 for overtime), and regulation would end with 300 seconds remaining.description: A description of the play/game event.home_score: Home team's score.away_score: Away team's score.score_diff: Score differential from the home team's perspective (home_score-away_score)play_length: Duration of the the given play, in seconds.win_prob: Win probability for the home team.home: Name of the home team.away: Name of the away team.home_timeout_remaining: Number of timeouts remaining for the home team.away_timeout_remaining: Number of timeouts remaining for the away team.home_timeout_ind: Binary indicator of whether home team took a timeout in the previous 60 seconds of game time.away_timeout_ind: Binary indicator of whether away team took a timeout in the previous 60 seconds of game time.home_favored_by: Number of points by which the home team is favored, prior to tip-off. If Vegas point spread is available on ESPN, that is used as the default. When not available, an attempt is made to impute the pre-game point spread from derived team strengths. Imputed point spreads are not available for games prior to the 2016-17 season or when one of the teams is not in Division 1.game_id: ESPN game_id for the game in question.date: Date of game.
Shot Location data frames contain the following variables.
team_name: Name of shooting team.shot_text: Description of shot.color: Color hexcode used to render shot chart graphic on ESPN.date: Date of game.outcome: Whether the shot was made or missed.shooter: Player attempting the shot.assister: Playing assisting the shot.three_pt: Logical, whether the shot is a 3-point attempt.x: x-coordinate of shot location.y: y-coordinate of shot location.
The court is 50 feet by 94 feet, with (0,0) always being placed in the bottom left corner of the shot chart. Any full-court shot chart rendered using game_shot_chart() preserves ESPN shot locations as they are found online, while halfcourt charts using team_shot_chart() convert all shot locations to to a 50 feet by 47 feet halfcourt. The perspective on the halfcourt shot charts is as if one is standing under the hoop, looking toward the opposition hoop. (0,0) again represents the bottom left corner and (50, 47) represents the top right corner.
