An Overview:
The question of why sexual replication exists becomes really interesting as you think about it. It seems, at first, to have serious diadvantages when compared to asexual replication strategies. An obvious one being that sexual populations will grow much slower - since they must expend energy and time in finding a mate. If we assume that each organism only has enough energy to contribute to only two offspring, the asexual population can grow exponetially faster than the sexual population.
But given the prevalence of sexual replication in nature, there must be some great benefit of replicating in this way. Also, given that even some quite simple organisms replicate sexually (e.g. Bacterial Conjugation), we want our explanation to be as "simple" as possible, avoiding things like selective mating etc.
I'm approaching the question from a mathematical lens. The first stage of my research involved creating a series of simulations, for which this is the code.
Now, in the simulations, I have two populations: the sexual replicators and the asexual replicators. Each organism is represented by a list of N integers (e.g. [123, 34, 1234...]). These are meant to be interpreted as the organisms gene sequence, and can be thought of as a point in N dimensional space. We'll title this N dimensional space the gene space.
Both populations start of distributed normally about the origin of the gene space: PIC OF NORMAL DISTS POPULATION
Then during the simulations, the populations undergo a series of stages that are meant to mimick the evolutionary process: -Mutatation: Each gene in each member of both populations has a probaility of undergoing mutation. Mutations are random, and thier size is approximately normally distributed about 0. This stage essentially has the effect of simply spreading out the population more in the gene space: PIC OF MUTATION PROCESS
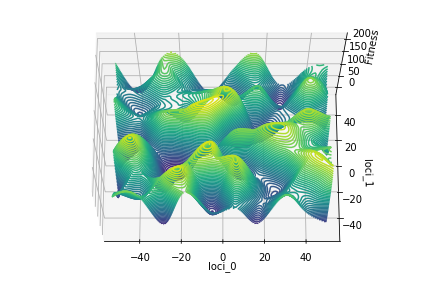
-Survival: To each point in the gene space, we associate a fitness value. his is easily visualised for the case where N = 2. Here the organisms have a gene sequence of two numbers, say [10, 25] which can be thought of as a point in a 2d plane. Then, to each point in this 2d plane, we assign some fitness value, so you end up getting a hilly landscape like this (gene sequence [10,25] -> loci_0 = 10, loci_1 = 25):
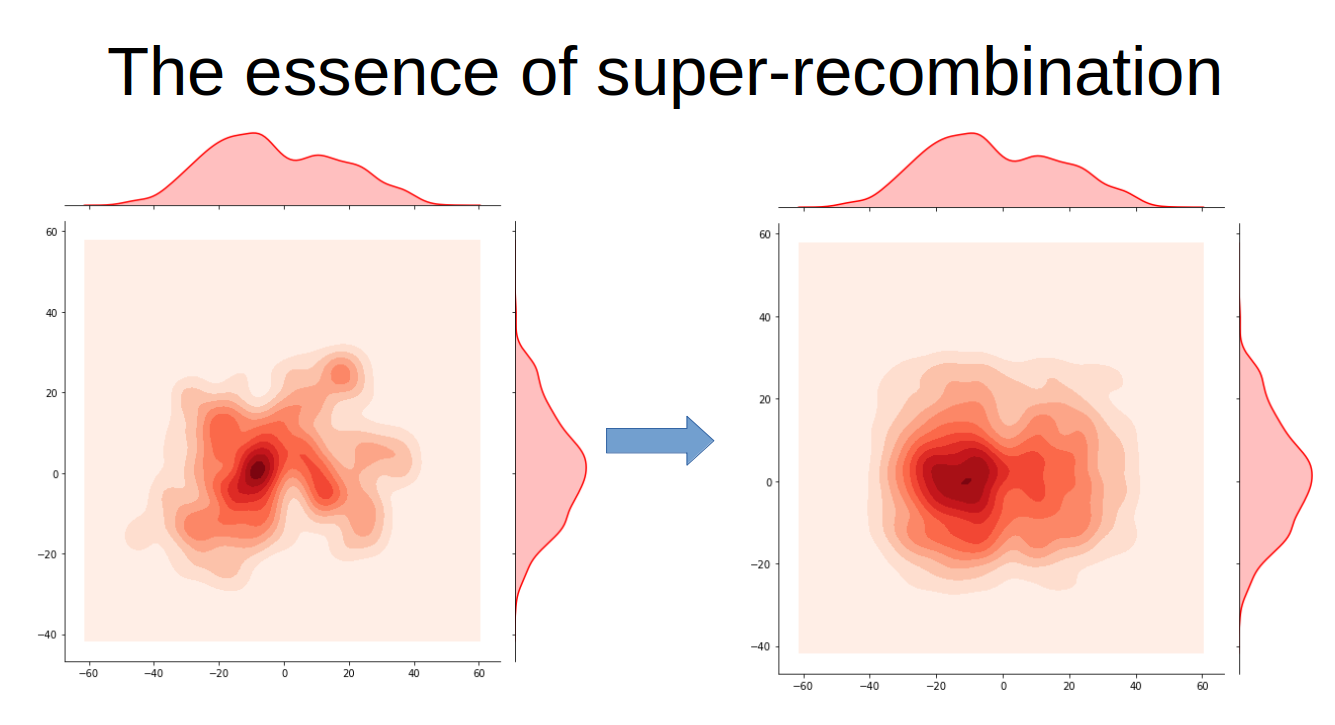
Now, in this stage each member of both populations has a chance of dying, this depends on it's fitness value. The higher the fitness value, the less likely it is that the organism dies. For the N=2 case, this simply means the population distribution changes to be more concentrated in places associated with higher fitness values - since those with lower fitness values die. PIC OF EXAMPLE SELECTION-Replication: Now in the simulations, I get two populations, one which replicates sexually and the other asexually - this process is entirely independent of the fitness values assigned to each organism. For the asexuals, they simply duplicate themselves. However the sexual replication process is a lot more interesting. In my model, I essentially have the population undergo a super recombination of the genes. It is as if, for each loci (position in the gene sequence) I take the genes (numbers) of the entire population and shuffle them around randomly. So, say I had a sexual population of size 3: [13, 123], [231, 65], [1123, 14], the first step of the super recombination would suffle the first numbers of each of these organisms randomly, so you might get [231, 123], [13, 65], [1123, 14]. Then we would shuffle the secound numbers in the gene sequence and so on. This shuffling is mathematically equivalent to the population undergoing standard, pair based, sexual mixing lots and lots. Below is a picture illustrating how such sexual recombination effects out population's distribution (in the N=2 case):
Results from the simulations: The key variable in these simulations was the fitness landscape I chose. Generally, in nature, small mutations have a small effect on a particular organisms fitness. Hence we restrict our attention to smooth fitness landscapes. However, if we consider any general landscape, where our populations of asexuals and sexuals are spread over several 'hills' and 'valleys' - we see that the asexuals have an obcious advantage. This is because the recombination stage in the sexual replication stage shifts the population to places between hills- i.e. to valleys. Meanwhile the asexual populations just stay where they are.
PICTURE SHOWING SEX VS ASEX PERFORMANCE ON GENRAL LANDSCAPES.
Hence the sexual poulation only has a competitive chance against the asexual population when the populations aren't spread out across hills and valleys. In other words, when the poulations are located in some patch of the fitness landscape with no more than one zero gradient point or line:
LOCAL LANDSCAPES PIC
When focussing on these landscapes, the simulations showed a clear result:
When the fitness landscape was increasing in some diagonal direction, such that a diagonal move in the landscape conferred a greater advantage than a vertical or horizontal move, THEN the sexual population increased it's average fitness faster than the asexual population. PIC OF DIAGONAL LANDSCAPE
The clue as to why lies in our earlier image of the recombination process. REPEAT PIC WITH MORE EXPLANATION Essentially, the sexual population can use this 'rectangularising' operation to move faster in the diagonal direction. Since for the asexual population to do the same, mutations would need to occur at each of it's genes.
I'm currently looking at formalising all this and trying to find a way to prove a general result. My current approach involves approximating the 'local' landscapes with a quadratic function and then intergrating over it using the population distribution as my measure.


