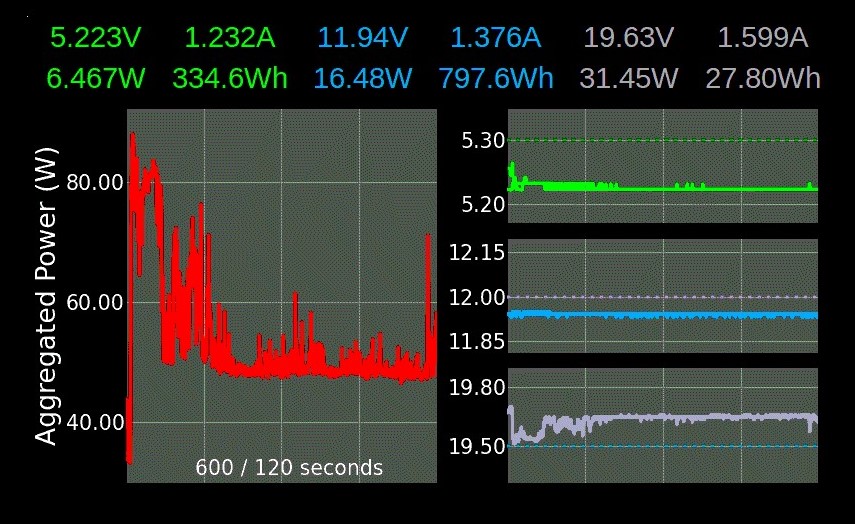
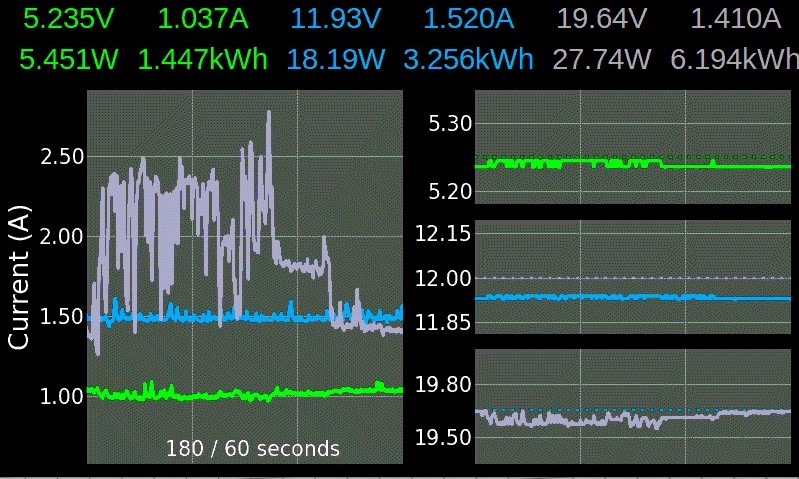
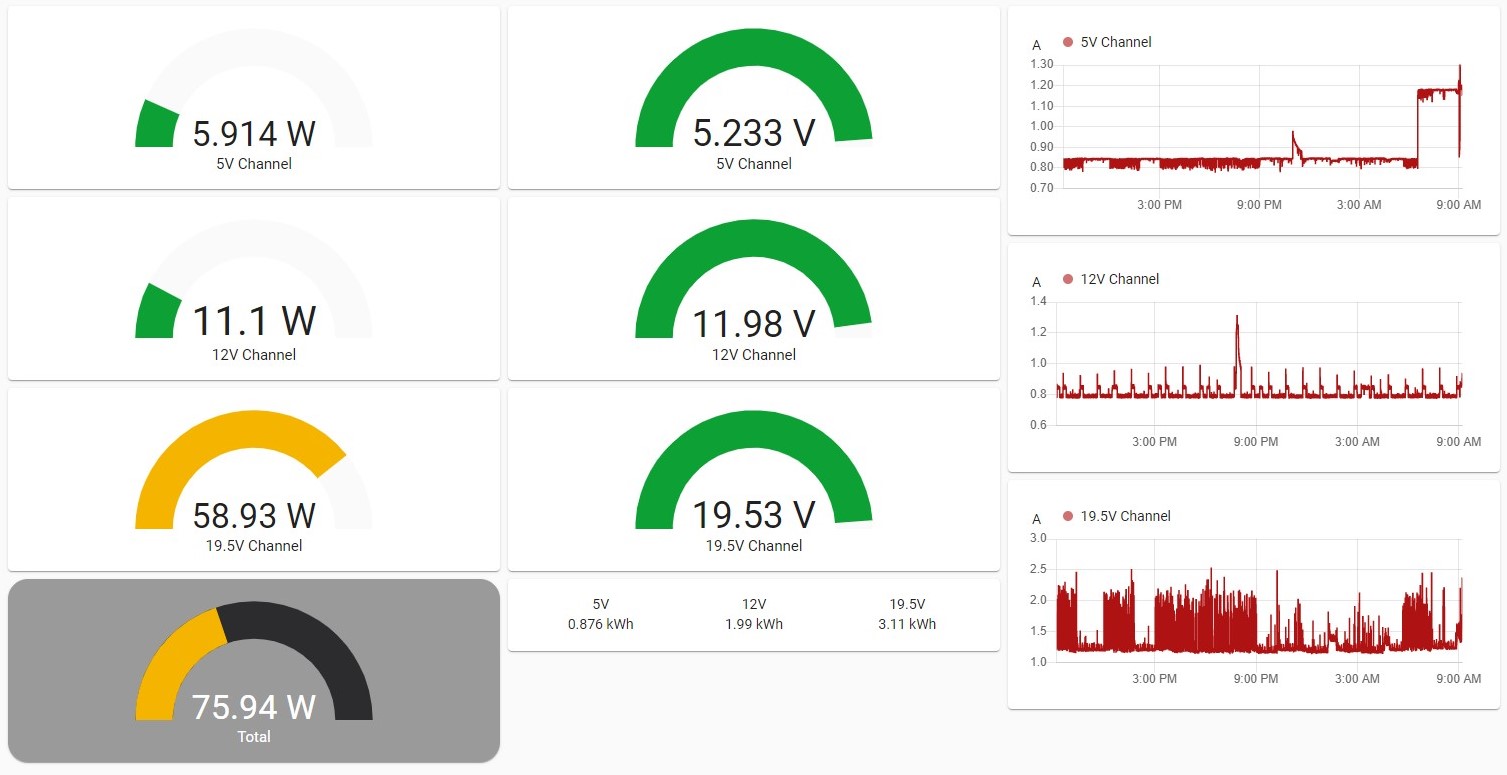
Power Monitor for the INA3221 sensor.
- 3 Channels (Voltage, Current, Power, Energy Wh/Ah)
- MQTT support
- Home assistant auto discovery
- Runs headless as service or with tkinter GUI
- Fullscreen mode
- Idle detection to reduce CPU load
- Long time monitoring with energy calculation (averaging mode from 4 times per second to 3.75 times per minute)
- High res mode with over 7000 samples per second (energy is disabled in high res mode)
- MQTT averaging can be configured independently from the live preview
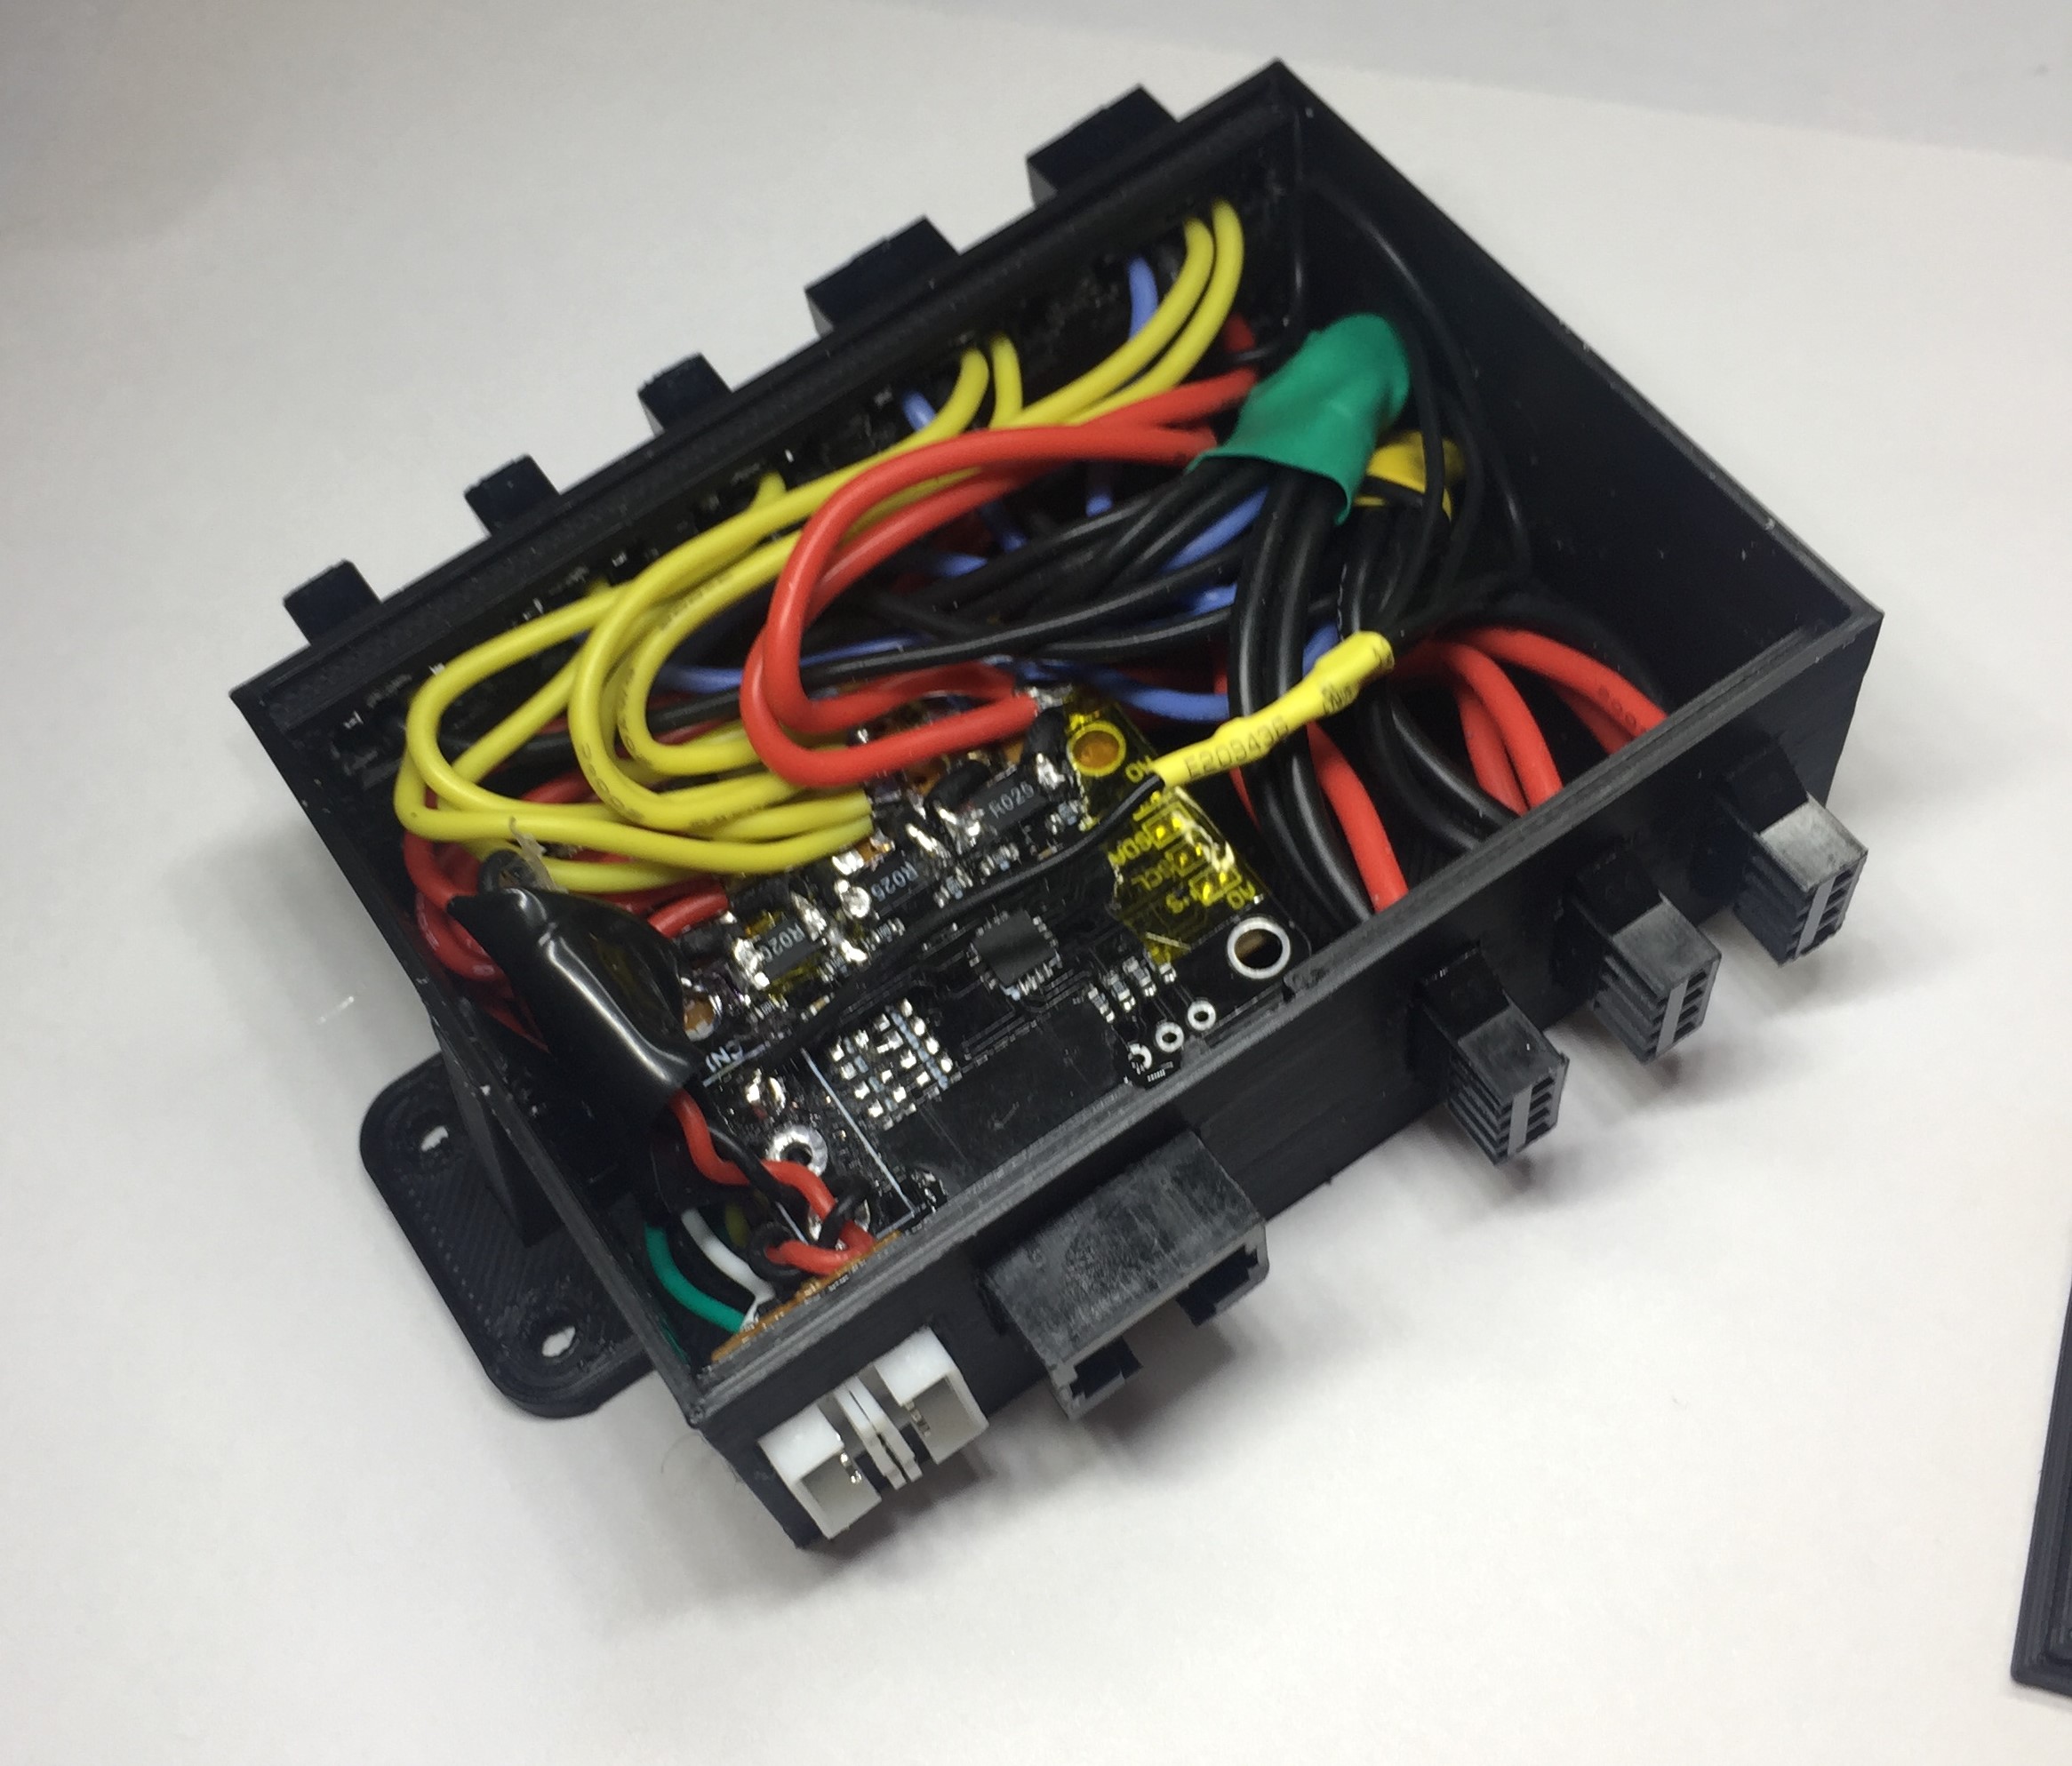
The INA3221 board is from aliexpress and turned out to be wired with common VCC. It required major rework. Take a close look to get the correct one. For high currents (5-10A), the shunts need to be replaced and the traces reinforced. The precision with 0.02Ohm is still pretty good in the mA range.
- python3
- python3-smbus
- python3-numpy
- sqlite3
apt install <package>Currently running on Python 3.9.2, Debian 11.2 (armv7l)
Tested with Python 3.7.8 on Windows and Python 3.7.3 on Debian (armv7l)
- The tkinter GUI has some issues using mathplotlib with bitblt and refreshing the screen
- The menu is not implemented yet
- Storing raw data in influxdb is not working. This might be a minor issue with the json data posted, which I did not address yet
NOTE: some packages require apt install with debian bullseye
Run pip3 install -r requirements.txt to install all python packages
- paho.mqtt for MQTT support
- commentjson for reading configuration files with comments
- matplotlib and tkinter for the GUI (
apt install python3-matplotlib python3-tk) - beeprint
- colorlog
- colour
- influxdb (apt ..., consider to add the influxdb repository to apt sources)
pip3 install <package>An adapter to read the sensor via I2C is required. Reading data over WiFi using an ESP8266 is possible, but currently not implemented. The INA3221 class is generating random values to run and debug it on Windows
Start the power monitor with python3 ./power_monitor.py
Make sure the first line in power_monitor.py points to the correct python interpreter
chmod 755 power_monitor.py
ln -s "$(pwd)/power_monitor.py" /usr/bin/power_monitorThe configuration is loaded from $HOME/.power_monitor/config.json by default.
Display the configuration using config.json inside the current working directory with
power_monitor --config . --check --print=json
or
power_monitor --config . --check --print=yaml
The desired parameters can be copied to config.json and modified.
The energy is stored once per minute in sqlite3 in $HOME/.power_monitor/powermonitor.db
If there is any issues reading the sensor, there is a 5 second pause before it is reset and any further attempt reading it is made.
How to get solid readings. An indication of interferences is huge spikes in voltage or current for a single reading.
- Check for loose connections first, sometimes this happens when it warms up
- Moving the wires away from anything that can cause interferences
- Shielding the I2C bus wires
- Adding additional pull-up resistors to the bus
- Reducing the data rate of the bus
Set the DISPLAY environment variable before starting the monitor or pass the display with --display=:0
NOTE: Currently it is not possible to detect screen blanking to disable the UI while the screen is off unless DPMS is used to turn of the screen
Passing the argument --headless disables the GUI and the power monitor can run as a service.
usage: power_monitor.py [-h] [-C CONFIG_DIR] [--display DISPLAY] [--headless]
                        [--fullscreen] [--daemon] [--verbose] [--check]
                        [--print {json,yaml,raw}] [--section SECTION]
                        [--key [KEY [KEY ...]]] [--debug]
                        [--ignore-warnings IGNORE_WARNINGS]

Power Monitor

optional arguments:
  -h, --help            show this help message and exit
  -C CONFIG_DIR, --config-dir CONFIG_DIR
                        location of config.json and energy.json
  --display DISPLAY     override DISPLAY variable
  --headless            start without GUI
  --fullscreen          start in fullscreen mode
  --daemon              run as daemon
  --verbose             enable debug output
  --check               check configuration
  --print {json,yaml,raw}
                        check and display configuration
  --section SECTION     config section to display
  --key [KEY [KEY ...]]
                        config key(s) to display
  --debug               enable debug mode
  --ignore-warnings IGNORE_WARNINGS
number of warnings to ignore and continue- Top labels: Display/hide channel
- Left center to bottom: Toggle displayed plots (Main plot, voltage)
- Right center to bottom: Toggle main plot from (Current, power and aggregated power)
- Top right and left corner below the labels: Increase/decrease displayed timeframe
The keyboard bindings can be configured in the section gui.key_bindings in config.json
| Key | Action |
|---|---|
| Escape | Leave fullscreen |
| F11 | Toggle full screen |
| Alt-F4 | Quit |
For more bindings, check power_monitor --print=yaml --section=app.gui.key_bindings
end_fullscreen: '<Escape>'
menu: '<F1>'
plot_display_energy: '<F4>'
plot_primary_display: '<F3>'
plot_visibility: '<F2>'
quit: '<Alt-F4>'
raw_sensor_values: '<Control-r>'
reload_config: '<Control-F5>'
reset_plot: '<Control-F10>'
toggle_debug: '<Control-F9>'
toggle_fullscreen: '<F11>'


