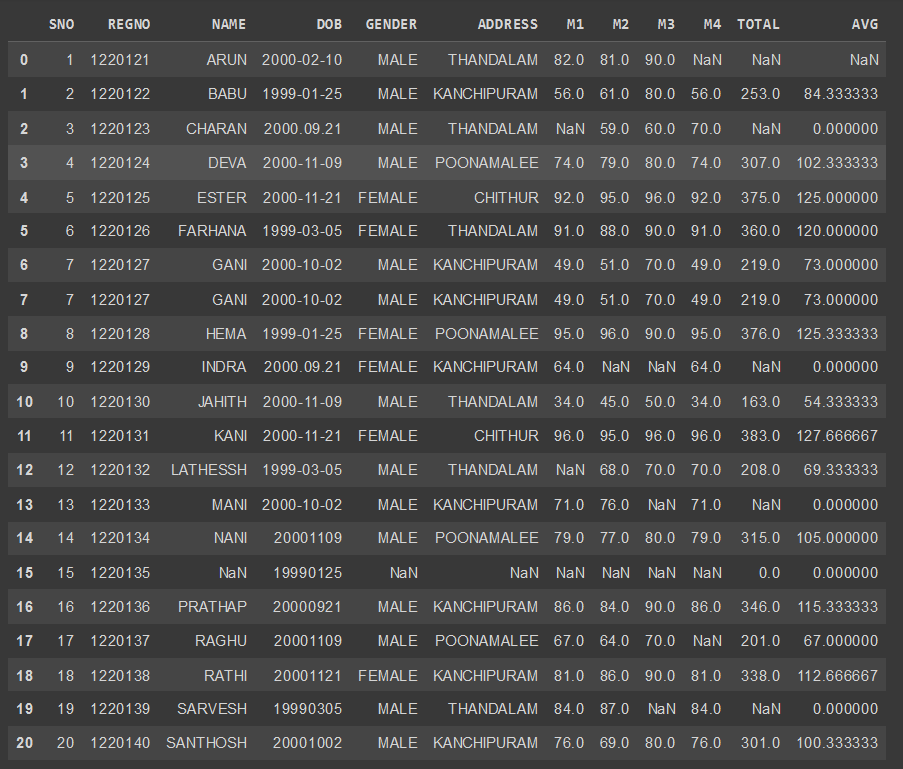
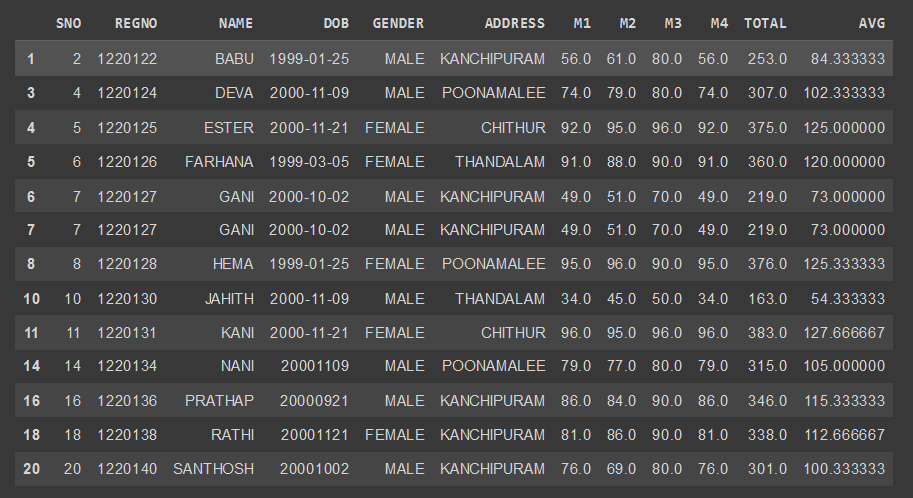
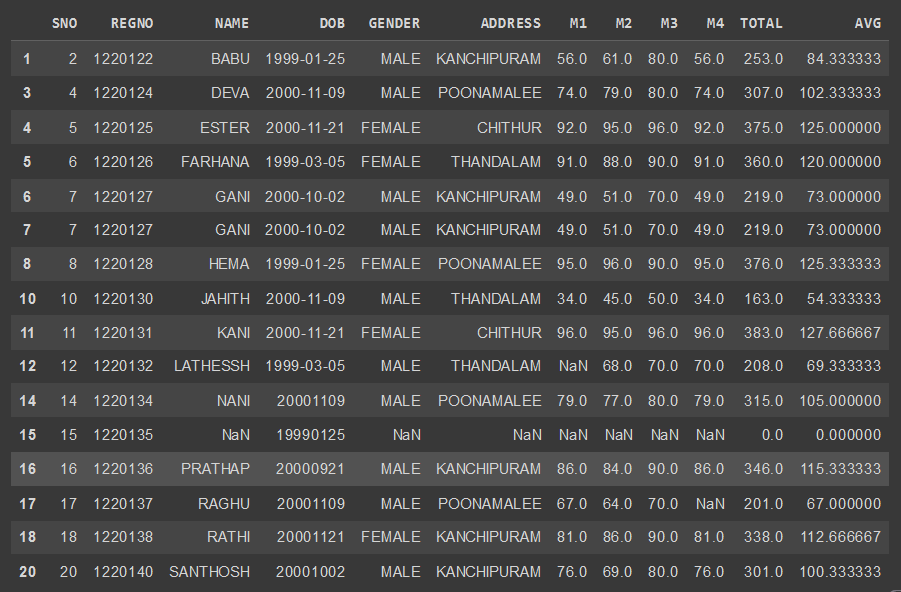
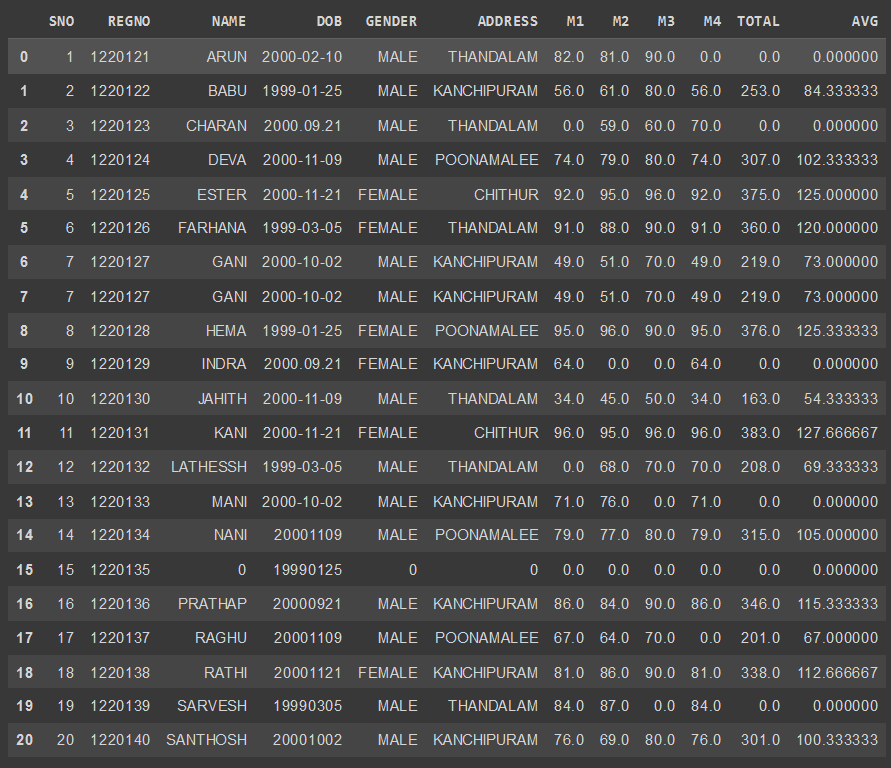
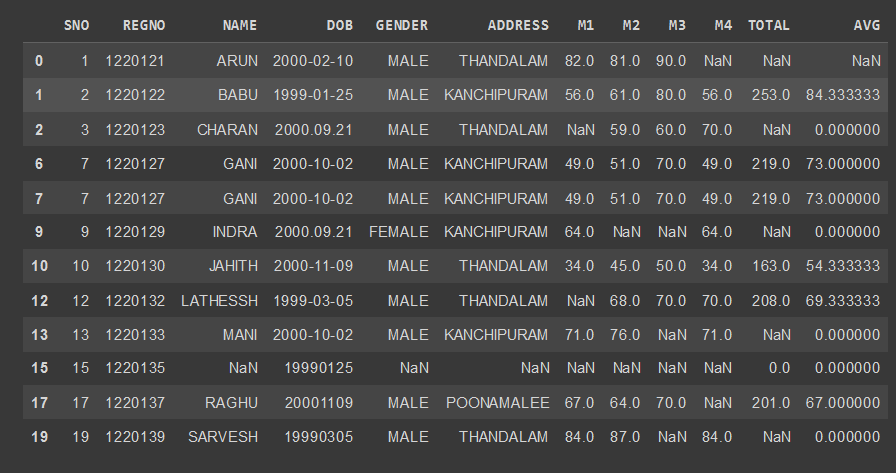
To read the given data and perform data cleaning and save the cleaned data to a file.
Data cleaning is the process of preparing data for analysis by removing or modifying data that is incorrect ,incompleted , irrelevant , duplicated or improperly formatted. Data cleaning is not simply about erasing data ,but rather finding a way to maximize datasets accuracy without necessarily deleting the information.
STEP 1: Read the given Data
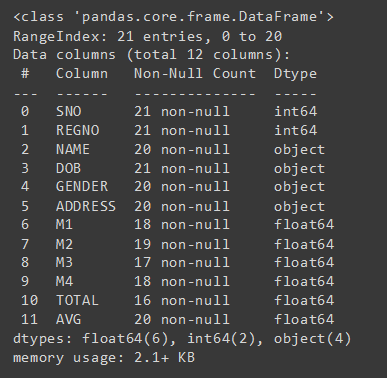
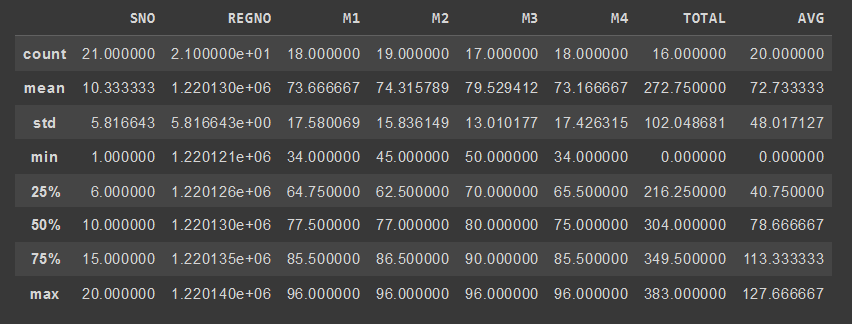
STEP 2: Get the information about the data
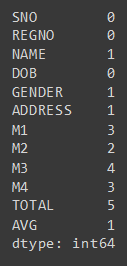
STEP 3: Remove the null values from the data
STEP 4: Save the Clean data to the file
STEP 5: Remove outliers using IQR
STEP 6: Use zscore of to remove outliers
            Developed by: Sathish R
Regno: 212222100048import pandas as pd
df=pd.read_csv('/content/SAMPLEDS.csv')
dfdf.head()df.tail()df.info()df.describe()df.shapedf.isnull().sum()x=df.dropna(how='any')
xtot=df.dropna(subset=['TOTAL'],how='any')
totdf.fillna(0)mn=df.TOTAL.mean()
mnfor x in df.index:
if df.loc[x,"AVG"]>100:
df.drop(x,inplace=True)
dfimport pandas as pd
import seaborn as sns
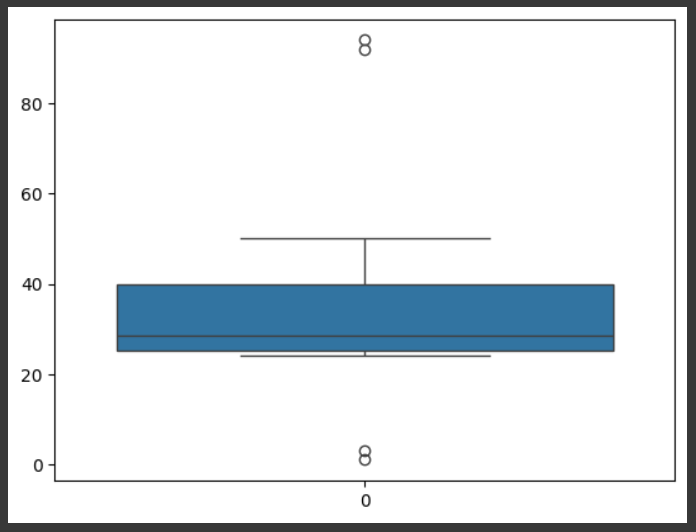
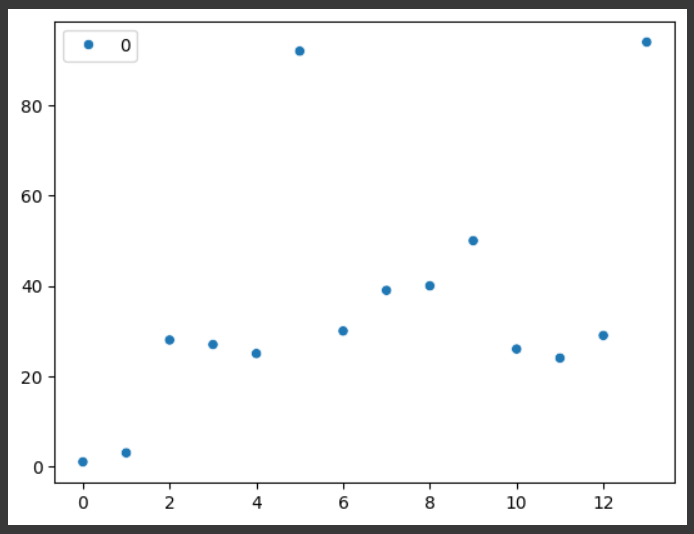
age=[1,3,28,27,25,92,30,39,40,50,26,24,29,94]
dff=pd.DataFrame(age)
dffdsf=sns.boxplot(dff)dsf=sns.scatterplot(dff)q1=dff.quantile(0.25)
q2=dff.quantile(0.5)
q3=dff.quantile(0.75)
iqr=q3-q1
iqrlow=q1-1.5*iqr
low
high=q3+1.5*iqr
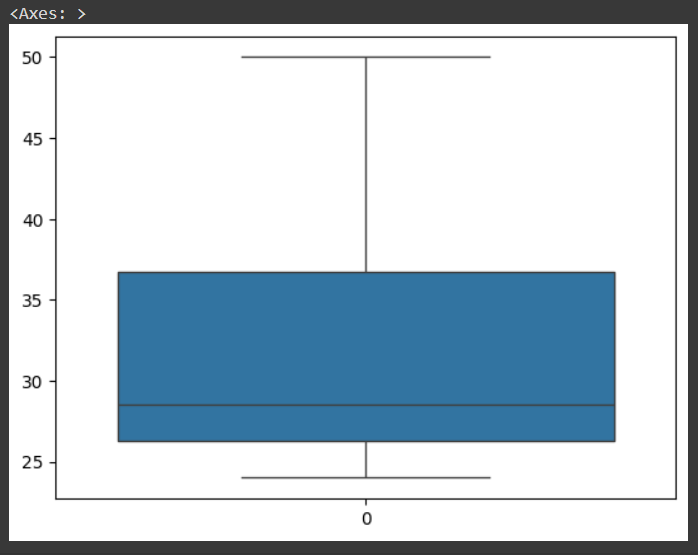
highdff=dff[((dff>=low)&(dff<=high))]
dffdff.dropna()sns.boxplot(data=dff)import pandas as pd
import seaborn as sns
import numpy as np
from scipy import stats
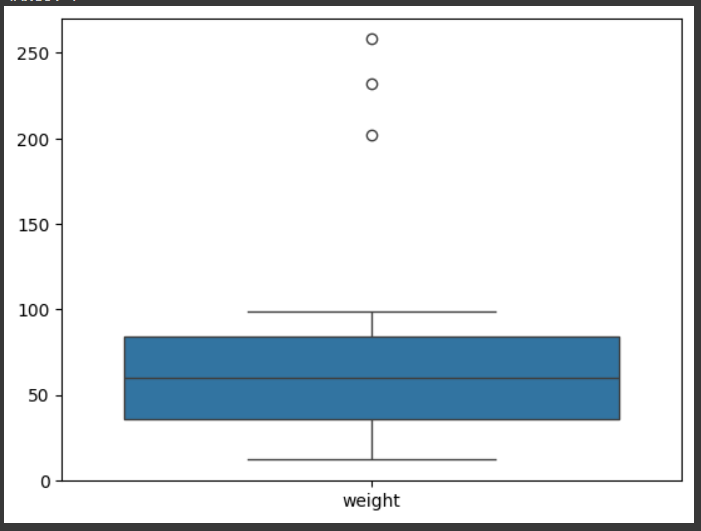
data={'weight':[12,15,18,21, 24, 27, 30, 33, 36, 39, 42, 45, 48, 51, 54, 57,60,63,66,69,202,72, 75, 78, 81, 84, 232, 87, 90, 93,96,99,258]}
ds=pd.DataFrame(data)
dsimport pandas as pd
import seaborn as sns
import numpy as np
from scipy import stats
data={'weight':[12,15,18,21, 24, 27, 30, 33, 36, 39, 42, 45, 48, 51, 54, 57,60,63,66,69,202,72, 75, 78, 81, 84, 232, 87, 90, 93,96,99,258]}
ds=pd.DataFrame(data)
dssns.boxplot(data=ds)z=np.abs(stats.zscore(ds))
zprint(ds[z['weight']>3])Hence the data was cleaned , outliers were detected and removed.
