CLV is one of the Key metrics to track and monitor. CLV measures the customers’ total worth to the business over the course of their lifetime relationship with the company. This metric is important to keep track of acquiring new customers. It is generally more expensive to acquire new customers than to keep existing ones, so knowing the lifetime value and costs associated with acquiring new customers is essential in order to build marketing strategies with a positive ROI. Calculations We calculate customer’s average purchase amount, purchase frequency to determine their average value per month. If we have before hand knowledge of a average customer lifespan we can use this determine the Customer Lifetime Value. But here since we do not have the customer lifespan so we resort to predict the CLV over a 3 month, 6 month, 12 month or 24 month as per the Business requirement. Here we will focussing on 3 month estimation. We will be using Regression Model to arrive at a customer Lifetime Value.
To predict Customer Value over a 3 month period based on historical data.
Each row of data represents a transaction and each column contains a transaction's attributes.
InvoiceNo : A unique identifier for the invoice. An invoice number shared across rows means that those transactions were performed in a single invoice (multiple purchases).
StockCode : Identifier for items contained in an invoice.
Description : Textual description of each of the stock item.
Quantity : The quantity of the item purchased.
InvoiceDate : Date of purchase.
UnitPrice : Value of each item.
CustomerID : Identifier for customer making the purchase.
Country : Country of customer.
-
Loading Dependencies
-
Loading Data
-
Data Exploration
-
Data Processing and Exploration
-
Building Recency and Frequency Feature
-
Training Model
In order to measure the performance of the model, Mean Squared Error and R-square for the model is used.
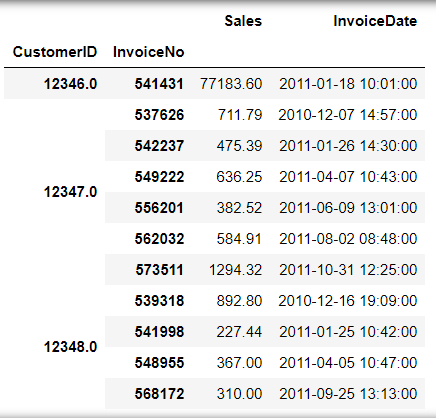
Ordered Data
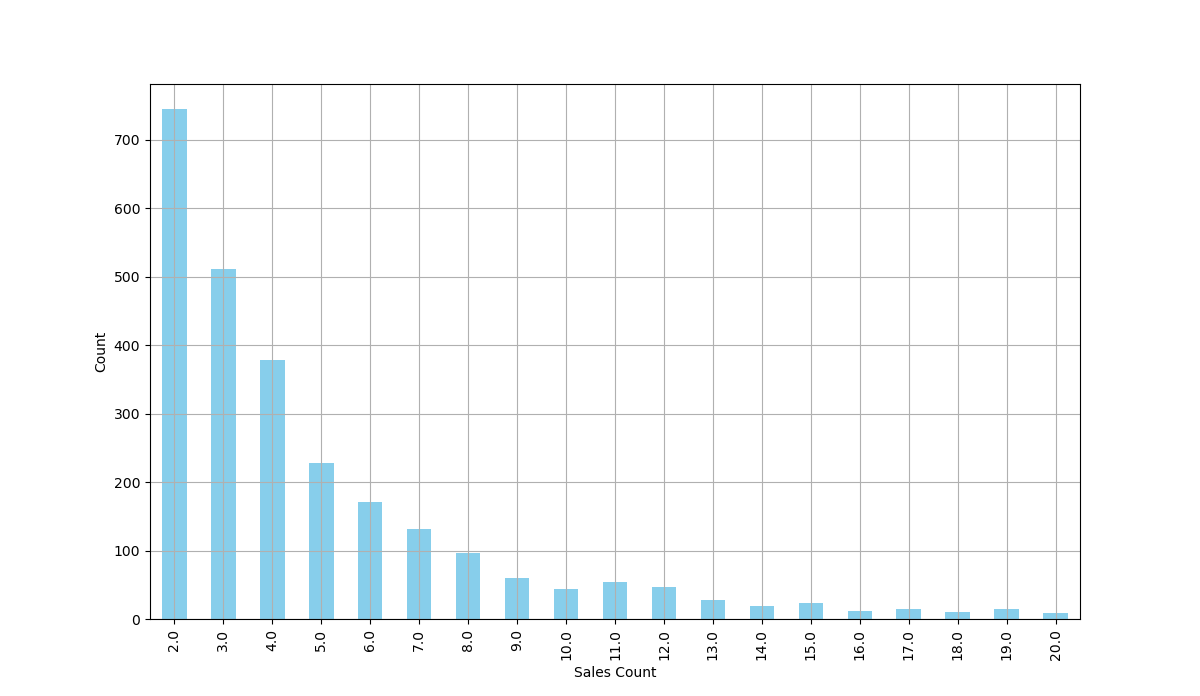
Number of Purchases by Customers
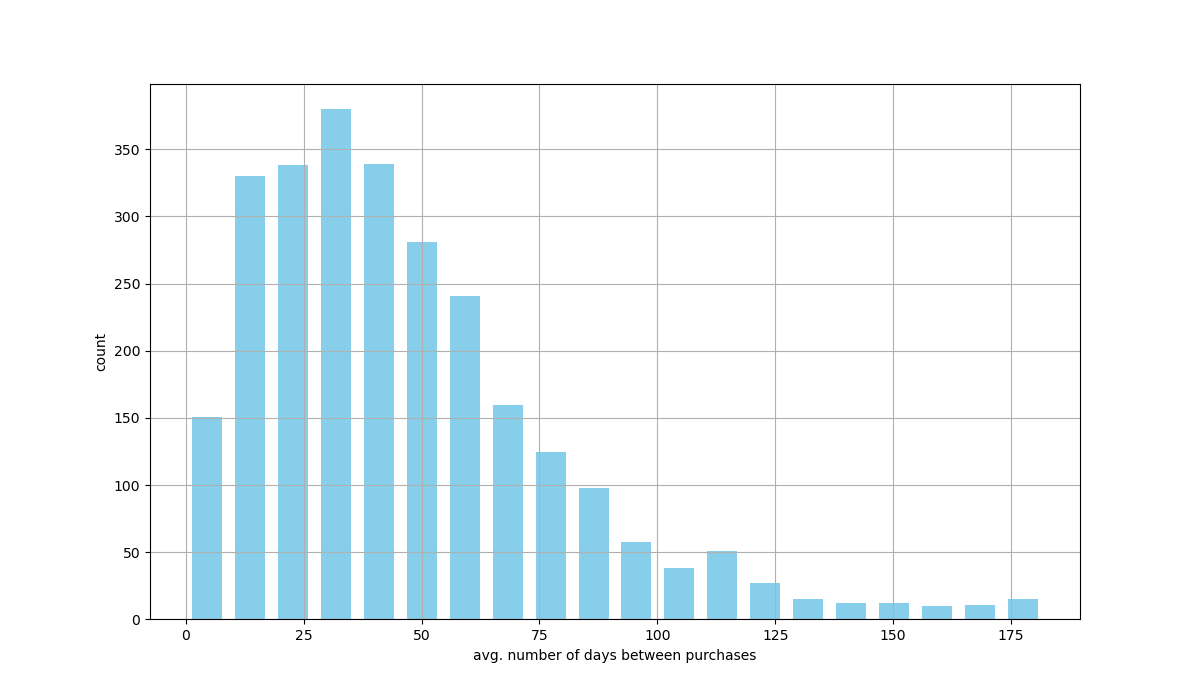
Days Between Purchases
Final Processed Data
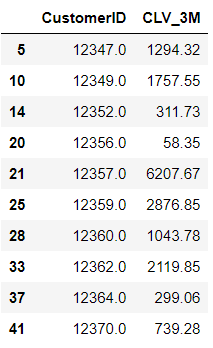
Sample CLV
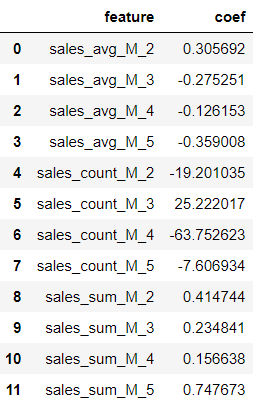
Coefficient Output
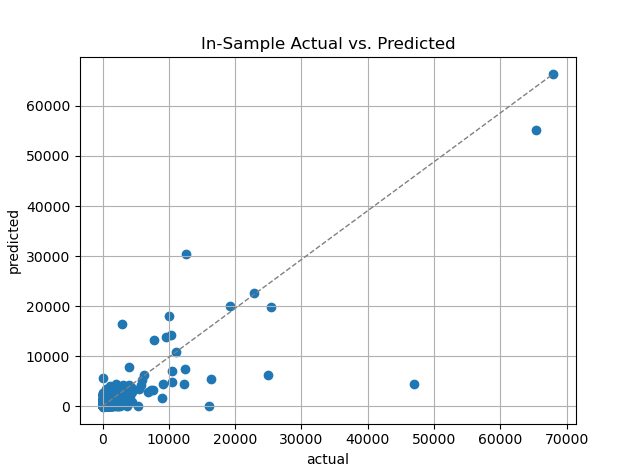
Training Data
Cross validation R-squared:: 0.727
MSE :: 174.024
Regression Model Plot
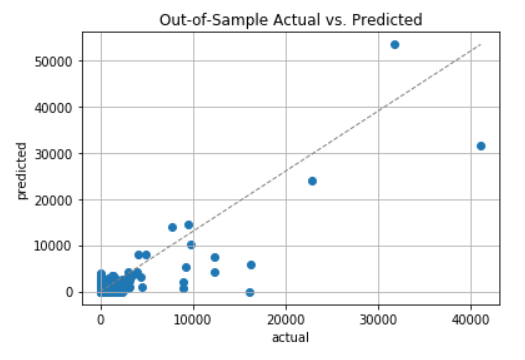
Testing Model
R-squared ::0.6739
MSE: 198.896
Regression Model Plot
From the Coefficeient output we can see the features that have negative correlation with the target (CLV value) and features that have positive correlation. We can experiment further with more algorithms to have even a better R-square and lower MSE. Using the customer value prediction output we can custom tailor our marketing strategies in different ways as we know the expected revenue from individual customers for the next 3 months. This can help create marketing campaigns with higher ROI as those high value customers predicted by this model are likely to bring in more revenue than others.

