Behind this idea is learning about:
- Use the open-source JavaScript library Leaflet for playing with maps
- Web Components
Checkout the demo.
A more interesting example could be the integration with dropping images, as we can see here.
GeoJSON is a format for encoding a variety of geographic data structures.
A GeoJSON object may represent a region of space (a Geometry), a spatially bounded entity (a Feature), or a list of Features (a FeatureCollection).
GeoJSON supports the following geometry types: Point, LineString, Polygon, MultiPoint, MultiLineString, MultiPolygon, and GeometryCollection.
Features in GeoJSON contain a Geometry object and additional properties, and a FeatureCollection contains a list of Features. GeoJSON Specification (RFC 7946)
Web Components1 use three separate technologies together:
- Custom Elements2. Quite simply, these are fully-valid HTML elements with custom templates, behaviors and tag names (e.g. ) made with a set of JavaScript APIs.
- Shadow DOM3. Capable of isolating CSS and JavaScript. This is defined in the Living Standard DOM specification.
- HTML templates4. User-defined templates in HTML that aren’t rendered until called upon.
Custom elements are like the standard elements -
Custom elements contain their own semantics, behaviors, markup and can be shared across frameworks and browsers.
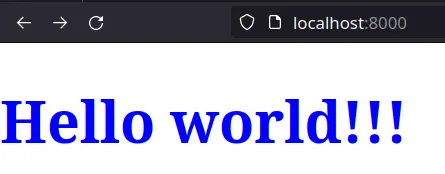
A basic example,
class SayHello extends HTMLElement {
    constructor() {
        super(); // Required

        const root = this.attachShadow({ mode: 'open' });
        root.innerHTML = `
        <style>
        h1 {
            color: blue;
            font-size: 4em;
        }
        </style>
        <h1>Hello world!!!</h1>
        `
}

customElements.define('say-hello', SayHello);<say-hello></say-hello>The content of the generated HTML code will be as follows
<say-hello>
    <!-- #shadow-root (open) -->
    <style>
    h1 {
        color: blue;
        font-size: 4em;
    }
    </style>
    <h1>Hello world!!!</h1>
</say-hello>
All custom elements must in some way extend an HTMLElement in order to be registered with the browser.
The mode option6 in attachShadow specifies the encaptulation mode for the shadow DOM tree. See further, Element.attachShadow()
The shadow DOM is an encapsulated version of the DOM that is inaccessible from it and defines its own behavior and style.
The HTML <template> element allows us to define a re-usable templates of code that won’t be rendered, but can be used at a later time.
Copy the directory /components/leaflet-map-component/ to any directory in your project.
To get started you need to import the Web Component
<head>
    <script type="module" src="./components/leaflet-map-component/leaflet-map.js"></script>
</head>
<body>
    <leaflet-map></leaflet-map>
</body>Change easily the tile layer on the map using the tileServer property.
Note that most tile servers require attribution, which you can set using the tileCopyrigth property.
<body>
<leaflet-map
longitude="-3.7001448634709626"
latitude="40.4237577382345"
zoom="13"
tileCopyright="Map data: © <a href='https://www.openstreetmap.org/copyright'>OpenStreetMap</a> contributors, <a href='http://viewfinderpanoramas.org'>SRTM</a> | Map style: © <a href='https://opentopomap.org'>OpenTopoMap</a> (<a href='https://creativecommons.org/licenses/by-sa/3.0/'>CC-BY-SA</a>)"
tileServer="https://{s}.tile.opentopomap.org/{z}/{x}/{y}.png">
</leaflet-map>
</body>Leaflet Provider Demo is a good resource for Leaflet layer providers
The Web Component leaflet-map allows the following attributes: latitude; longitude; maxZoom; tileCopyright; tileServer; zoom; and, the specials allowAddMarker, customStyle and fitToBounds or flyToBounds.
All attributes are optional.
Default values are
{
latitude: 51.505,
longitude: -0.09,
maxZoom: 19,
tileCopyright: '© <a href="http://www.openstreetmap.org/copyright">OpenStreetMap</a>',
tileServer: 'https://tile.openstreetmap.org/{z}/{x}/{y}.png',
zoom: 13
}The optional attribute allowAddMarker triggers the 'x-leaflet-map:marker-pointed-out' event on adding a new marker. Nothing is done on the map.
The optional attribute customStyle defines the name of the custom class and style file separated by a colon. This allows custom styling of elements within the Web Component.
The special attributes fitToBounds or flyToBounds, without or with animation, the map view to contain all added GeoJSON objects at the hightst possible zoom level.
For example, to change the background colour of all pop-up, we would include a CSS file
custom-popup-style.css
.custom-leaflet-popup-style .leaflet-popup-content-wrapper {
    background: #2c3e50;
    color: #fff;
}

.custom-leaflet-popup-style .leaflet-popup-tip {
    background: #2c3e50;
}
and the customStyle attribute as following
<body>
    <leaflet-map customStyle="custom-leaflet-popup-style:<path to file>/custom-popup-style.css"></leaflet-map>
</body>
Obviously the name of the class 'custom-leaflet-popup-style' is the same as the one that encapsulates the styles in the css file.
Check this on the demo start map and click on the point to get a pop-up window with a dark background.
The Web Component leaflet-map defines two events as actions.
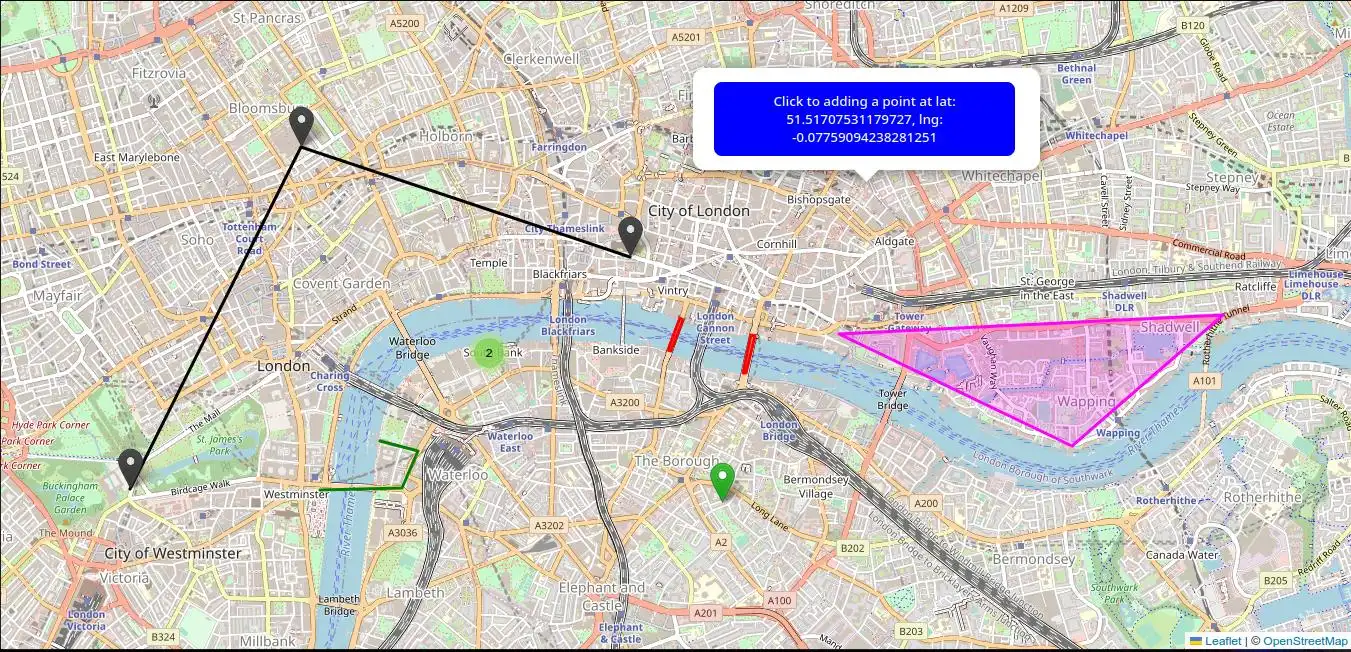
Use it to adding GeoJSON Features and FeatureCollections as they allow you to describe features with a set of properties (samples bellow).
This event requires an object with the property:
- geojson, the GeoJSON object to be added
Use it to removing all GeoJSON features from the map (see Clear a map).
This event requires no object.
Adding GeoJSON objects
The style and popupContent properties are optional.
The coordinates property is an array of numbers. There MUST be two or three elements. The first two elements are longitude and latitude, or easting and northing, precisely in that order and using decimal numbers. Altitude or elevation MAY be included as an optional third element.
The icon property for a marker is optional.
<body>
    <leaflet-map></leaflet-map>

    <script>
        setTimeout(function () {
            const map = document.querySelector('leaflet-map');

            const marker = {
                type: "Feature",
                geometry: {
                    type: "Point",
                    coordinates: [-0.09, 51.5]
                },
                properties: {
                    popupContent: "<b>Hello world!</b><br>I am a popupContent.",
                    icon: {
                        iconUrl: 'https://raw.githubusercontent.com/pointhi/leaflet-color-markers/master/img/marker-icon-green.png',
                        shadowUrl: 'https://cdnjs.cloudflare.com/ajax/libs/leaflet/0.7.7/images/marker-shadow.png',
                        iconSize: [25, 41],
                        iconAnchor: [12, 41],
                        popupAnchor: [1, -34],
                        shadowSize: [41, 41]
                    }
                }
            }

            map.dispatchEvent(new CustomEvent('x-leaflet-map-geojson-add', {
                detail: {
                    geojson: marker
                }
            }));
        }, 1000);
    </script>
</body>
A marker allows to be dragged by adding the draggable property in as follow
const marker = {
    type: "Feature",
    geometry: {
        type: "Point",
        coordinates: [-0.09, 51.5]
    },
    properties: {
        ...,
        draggable: true
        }
    ...
}The radius property defines a circle and is the only one required.
<body>
    <leaflet-map></leaflet-map>

    <script>
        setTimeout(function () {
            const map = document.querySelector('leaflet-map');

            const circle = {
                type: "Feature",
                geometry: {
                    type: "Point",
                    coordinates: [-0.11, 51.508]
                },
                properties: {
                    radius: 40,
                    popupContent: "I am a circle.",
                    style: {
                        color: 'red',
                        fillColor: '#f03',
                        fillOpacity: 0.5,
                    }
                }
            }

            map.dispatchEvent(new CustomEvent('x-leaflet-map-geojson-add', {
                detail: {
                    geojson: circle
                }
            }));
        }, 1000);
    </script>
</body><body>
<leaflet-map></leaflet-map>
<script>
setTimeout(function () {
const map = document.querySelector('leaflet-map');
const multiPoint = {
type: "Feature",
geometry: {
type: "MultiPoint",
coordinates: [
[-0.14082945900490862, 51.500729712288845],
[-0.126152411319017, 51.518999110271444],
[-0.09791411489411447, 51.513123787337804]
]
},
properties: {
popupContent: "I am a MultiPoint.",
icon: {
iconUrl: 'https://raw.githubusercontent.com/pointhi/leaflet-color-markers/master/img/marker-icon-black.png',
shadowUrl: 'https://cdnjs.cloudflare.com/ajax/libs/leaflet/0.7.7/images/marker-shadow.png',
iconSize: [25, 41],
iconAnchor: [12, 41],
popupAnchor: [1, -34],
shadowSize: [41, 41]
}
}
};
map.dispatchEvent(new CustomEvent('x-leaflet-map-geojson-add', {
detail: {
geojson: multiPoint
}
}));
}, 1000);
</script>
</body><body>
<leaflet-map></leaflet-map>
<script>
setTimeout(function () {
const map = document.querySelector('leaflet-map');
const lineString = {
type: "Feature",
geometry: {
type: "LineString",
coordinates: [
[-0.14082945900490862, 51.500729712288845],
[-0.126152411319017, 51.518999110271444],
[-0.09791411489411447, 51.513123787337804]
]
},
properties: {
popupContent: "I am a LineString.",
style: {
color: "black",
opacity: 1,
}
}
};
map.dispatchEvent(new CustomEvent('x-leaflet-map-geojson-add', {
detail: {
geojson: lineString
}
}));
}, 1000);
</script>
</body><body>
<leaflet-map></leaflet-map>
<script>
setTimeout(function () {
const map = document.querySelector('leaflet-map');
const multiLineString = {
type: "Feature",
geometry: {
type: "MultiLineString",
coordinates: [
[
[-0.12452174238299801, 51.50066274018154],
[-0.11752654129293857, 51.50076292147487]
],
[
[-0.11752654129293857, 51.50076292147487],
[-0.11614252143672825, 51.50273310885865]
],
[
[-0.11614252143672825, 51.50273310885865],
[-0.11935044340901013, 51.50326738227206]
],
]
},
properties: {
popupContent: "I am a MultiLineString.",
style: {
color: "green",
opacity: 1,
}
}
};
map.dispatchEvent(new CustomEvent('x-leaflet-map-geojson-add', {
detail: {
geojson: multiLineString
}
}));
}, 1000);
</script>
</body>The property popupContent is optional.
<body>
    <leaflet-map></leaflet-map>

    <script>
        setTimeout(function () {
            const map = document.querySelector('leaflet-map');

            const polygon = {
                type: "Feature",
                geometry: {
                    type: "Polygon",
                    coordinates: [[
                        [-0.08, 51.509],
                        [-0.06, 51.503],
                        [-0.047, 51.51]
                    ]]
                },
                properties: {
                    popupContent: "I am a polygon.",
                    style: {
                        color: "magenta",
                        opacity: 1,
                    }
                }
            };

            map.dispatchEvent(new CustomEvent('x-leaflet-map-geojson-add', {
                detail: {
                    geojson: polygon
                }
            }));
        }, 1000);
    </script>
</body><body>
<leaflet-map></leaflet-map>
<script>
setTimeout(function () {
const map = document.querySelector('leaflet-map');
const multiPolygon = {
type: "Feature",
geometry: {
type: "MultiPolygon",
coordinates: [
[
[
[-0.09365488101163101, 51.509838432977276],
[-0.09341884661902165, 51.5097449490648],
[-0.0944273572056253, 51.50808891653398],
[-0.09470630694234546, 51.508142337877736]
],
],
[
[
[-0.08751798680378747, 51.508930295422665],
[-0.08723903706706732, 51.50887687500278],
[-0.0879685979169508, 51.506926986810356],
[-0.08820463230956016, 51.506940342492776]
]
]
]
},
properties: {
popupContent: "I am a MultiPolygon.",
style: {
color: "red",
opacity: 1,
}
}
};
map.dispatchEvent(new CustomEvent('x-leaflet-map-geojson-add', {
detail: {
geojson: multiPolygon
}
}));
}, 1000);
</script>
</body><body>
<leaflet-map></leaflet-map>
<script>
setTimeout(function () {
const map = document.querySelector('leaflet-map');
const features = {
type: "FeatureCollection",
features: [{
type: "Feature",
geometry: {
type: "Point",
coordinates: [-0.09, 51.5]
},
properties: {
popupContent: "<b>Hello world!</b><br>I am a popup."
}
},
{
type: "Feature",
geometry: {
type: "Point",
coordinates: [-0.11, 51.508]
},
properties: {
radius: 500,
popupContent: "I am a circle.",
style: {
color: 'red',
fillColor: '#f03',
fillOpacity: 0.5,
}
}
},
{
type: "Feature",
geometry: {
type: "Polygon",
coordinates: [[
[-0.08, 51.509],
[-0.06, 51.503],
[-0.047, 51.51]
]]
},
properties: {
popupContent: "I am a polygon."
}
}]
};
map.dispatchEvent(new CustomEvent('x-leaflet-map-geojson-add', {
detail: {
geojson: features
}
}));
}, 1000);
</script>
</body><body>
<leaflet-map id="first-map"></leaflet-map>
<leaflet-map id="second-map"></leaflet-map>
<script>
setTimeout(function () {
const firstMap = document.getElementById('first-map');
const secondMap = document.getElementById('second-map');
const point = {
type: "Feature",
geometry: {
type: "Point",
coordinates: [-0.09, 51.5]
},
properties: {
popupContent: "<b>Hello world!</b><br>I am a popup.",
icon: {
iconUrl: 'https://raw.githubusercontent.com/pointhi/leaflet-color-markers/master/img/marker-icon-green.png',
shadowUrl: 'https://cdnjs.cloudflare.com/ajax/libs/leaflet/0.7.7/images/marker-shadow.png',
iconSize: [25, 41],
iconAnchor: [12, 41],
popupAnchor: [1, -34],
shadowSize: [41, 41]
}
}
};
const circle = {
type: "Feature",
geometry: {
type: "Point",
coordinates: [-0.11, 51.508]
},
properties: {
radius: 40,
popupContent: "I am a circle.",
style: {
color: 'red',
fillColor: '#f03',
fillOpacity: 0.5,
}
}
};
firstMap.dispatchEvent(new CustomEvent('x-leaflet-map-geojson-add', {
detail: {
geojson: point
}
}));
secondMap.dispatchEvent(new CustomEvent('x-leaflet-map-geojson-add', {
detail: {
geojson: circle
}
}));
}, 1000);
</script>
</body>Actually adding a marker only triggers the 'x-leaflet-map:marker-pointed-out' event and any action must be performed by whoever uses the web component by adding functionality to that marker. Nothing is done on the map.
Adding a marker to the map could be done clicking with the right button in any point.
This action opens a popup with a button for confirmation as follows
Clicking in it triggers the 'x-leaflet-map:marker-pointed-out' event by exposing the latitude and longitude of the point as follows
x-leaflet-map:marker-pointed-out {
    target: leaflet-map,
    isTrusted: false,
    detail: {
        latlng: {
            lat: 51.52540664057756,
            lng: -0.07201194763183595
        }
    }
    ...
}
You can use the file example.html of the project as a small demo using the allowAddMarker attribute.
Any of the markers added to the map can be deleted by double clicking on it and confirming the deletion.
Web Component leaflet-map triggers the 'x-leaflet-map:marker-removed' event when any marker is removed from map by exposing its GeoJSON as follows
x-leaflet-map:marker-removed {
    target: leaflet-map,
    isTrusted: false,
    detail: {
        feature: {
            type: "Feature",
            geometry: {
                type: "Point",
                coordinates: [-0.09, 51.5]
            },
            ...
        }
    }
    ...
}
You can use the file example.html of the project as a small demo using the flyToBounds attribute.
<body>
    <leaflet-map id="first-map"></leaflet-map>
    <leaflet-map id="second-map"></leaflet-map>

    <script>
        const map = document.querySelector('leaflet-map');

        setTimeout(function () {
            const point = {
                type: "Feature",
                geometry: {
                    type: "Point",
                    coordinates: [-0.09, 51.5]
                },
                properties: {
                    popupContent: "<b>Hello world!</b><br>I am a popup.",
                    icon: {
                        iconUrl: 'https://raw.githubusercontent.com/pointhi/leaflet-color-markers/master/img/marker-icon-green.png',
                        shadowUrl: 'https://cdnjs.cloudflare.com/ajax/libs/leaflet/0.7.7/images/marker-shadow.png',
                        iconSize: [25, 41],
                        iconAnchor: [12, 41],
                        popupAnchor: [1, -34],
                        shadowSize: [41, 41]
                    }
                }
            };

            map.dispatchEvent(new CustomEvent('x-leaflet-map-geojson-add', {
                detail: {
                    geojson: point
                }
            }));
        }, 1000);

        setTimeout(function () {
            map.dispatchEvent(new Event('x-leaflet-map-geojson-clear'));
        }, 3000);
    </script>
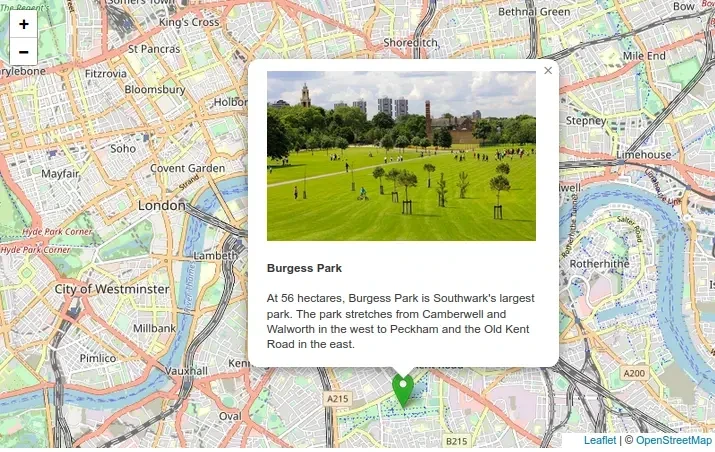
</body>Using a point feature with a small card.
<!DOCTYPE html>
<html lang="en">
<head>
    <meta http-equiv="content-type" content="text/html; charset=UTF-8">
    <meta charset="utf-8">
    <meta name="viewport" content="width=device-width, initial-scale=1">

    <title>Web Component - Leaflet Map</title>

    <link rel="shortcut icon" type="image/x-icon" href="assets/favicon.ico">

    <script type="module" src="./components/leaflet-map-component/leaflet-map.js"></script>

    <style>
        html,
        body {
            height: 100%;
            margin: 0;
        }

        leaflet-map {
            height: 500px;
            width: 800px;
            display: inline-block;
            position: relative;
            outline: none;
        }

        .card {
            box-shadow: 0 4px 8px 0 rgba(0, 0, 0, 0.2);
            transition: 0.3s;
            border-radius: 5px;
        }

        .container {
            padding: 2px 16px;
        }

        img {
            border-radius: 5px 5px 0 0;
        }
    </style>
</head>

<body>
    <leaflet-map></leaflet-map>

    <script>
        setTimeout(function () {
            const map = document.querySelector('leaflet-map');

            const burgessPark = {
                type: "Feature",
                geometry: {
                    type: "Point",
                    coordinates: [-0.08144411512541307, 51.48288683515307]
                },
                properties: {
                    popupContent: `
<div class="card">
    <img src="https://www.southwark.gov.uk/_images/pageside/8257/Burgess%20Park.jpg" alt="Burguess Park" style="width:100%">
    <div class="container">
        <h4><strong>Burgess Park</strong></h4>
        <p>
            At 56 hectares, Burgess Park is Southwark's largest park.
            The park stretches from Camberwell and Walworth in the west to Peckham and the Old Kent Road in the east.</p>
    </div>
</div >
`,
                    icon: {
                        iconUrl: 'https://raw.githubusercontent.com/pointhi/leaflet-color-markers/master/img/marker-icon-green.png',
                        shadowUrl: 'https://cdnjs.cloudflare.com/ajax/libs/leaflet/0.7.7/images/marker-shadow.png',
                        iconSize: [25, 41],
                        iconAnchor: [12, 41],
                        popupAnchor: [1, -34],
                        shadowSize: [41, 41]
                    }
                }
            };

            map.dispatchEvent(new CustomEvent('x-leaflet-map-geojson-add', {
                detail: {
                    geojson: burgessPark
                }
            }));
        }, 1000);
    </script>
</body>
</html>
You have another example with all the features and the flyToBounds attribute in example.html.
A container is used for hot reloading during development.
Test your GeoJSON with GeoJSONLint.
Leaflet.markercluster is used.
Web Component behind this idea are:
Good luck and I hope you enjoy it.


