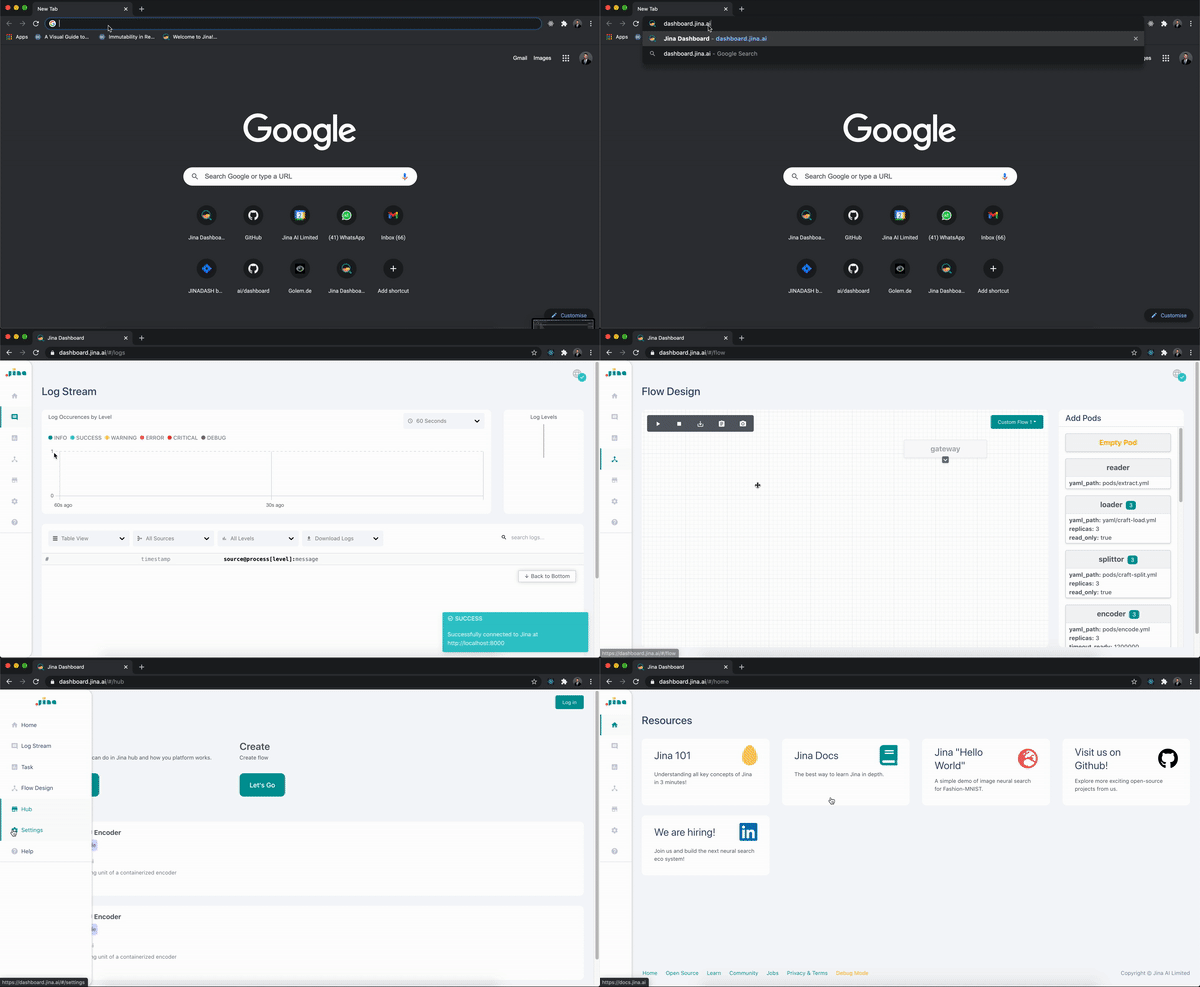
Dashboard allows you to build Jina Flows using a graphical interface. Drag and drop your pods quickly; no code required! Run Flows and monitor by exploring detailed Logs!
Jina Dashboard is a low-code monitoring and management environment for Jina. With the Dashboard, you can build Jina Flows and manage them from a central location. Get detailed insights into the health of the Flow with the use of log stream analysis!
To use the Jina hosted version of the Dashboard visit the Jina website
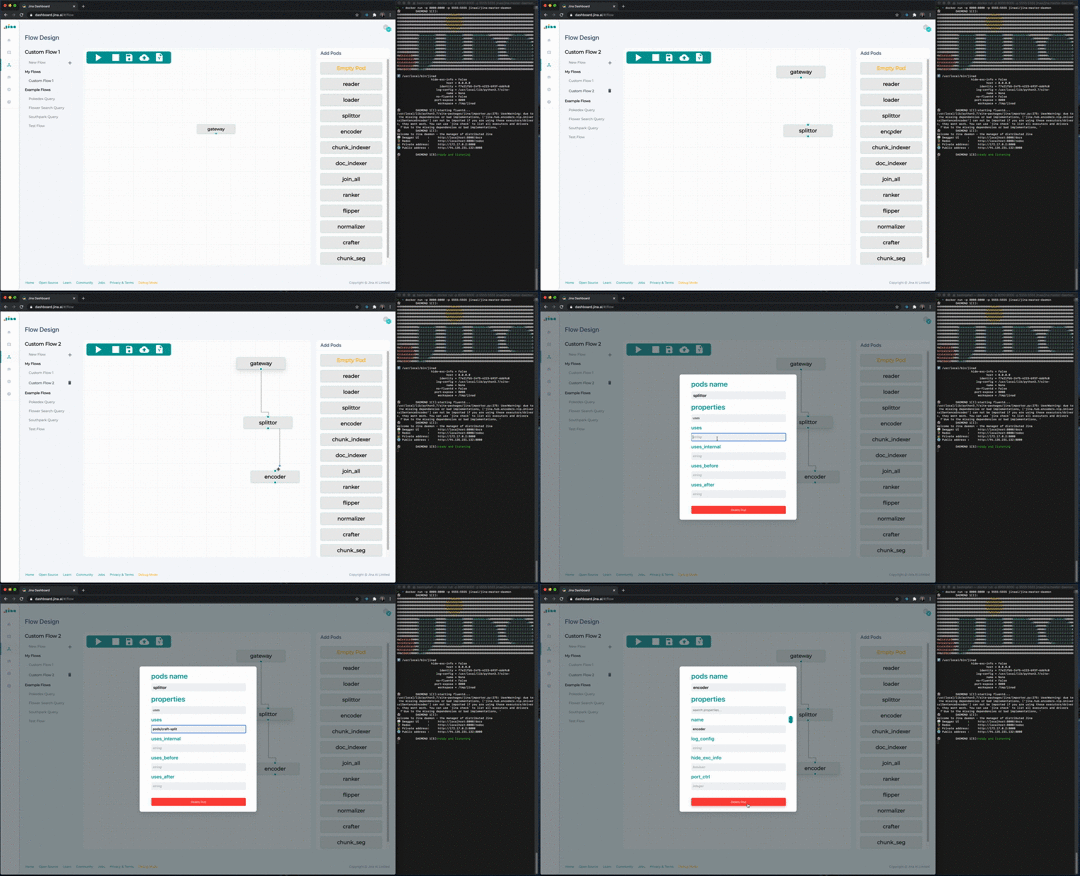
Use Jina easily in the browser; no code required! Building flows within the user-friendly interface is easy, just start dragging pods into the design canvas. View the list of Pod properties and edit them using a visual menu. To create a custom Flow: connect Pods, upload a YAML file, or use an existing Flow template!
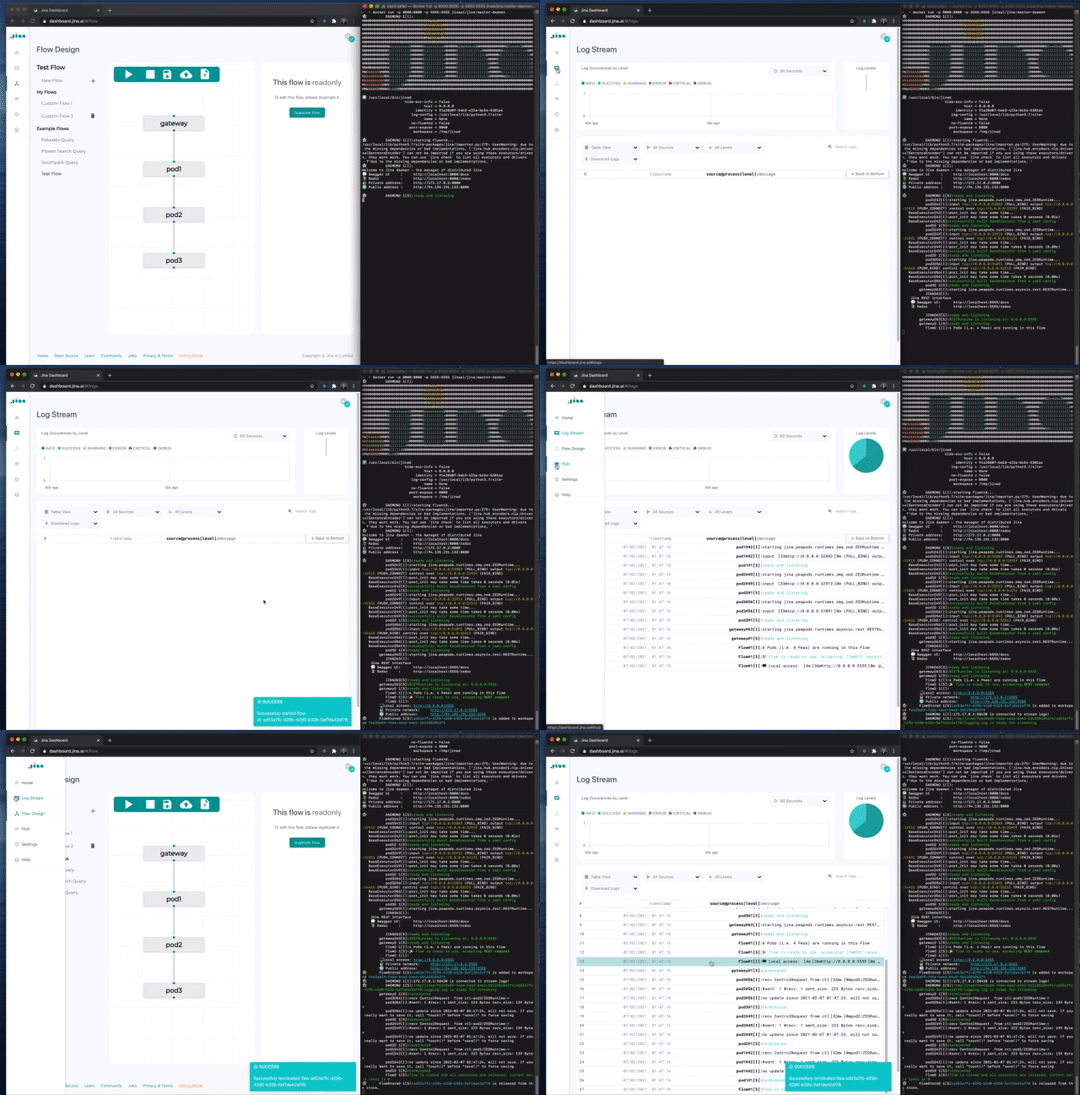
Dig deeper into your Jina Flow using the LogStream, and debug your Flow by viewing your logs in real-time! Jina makes it extremely easy to stay on top of your search deployment by allowing you to filter, group, and search logs based on Pod, log-level, or message!
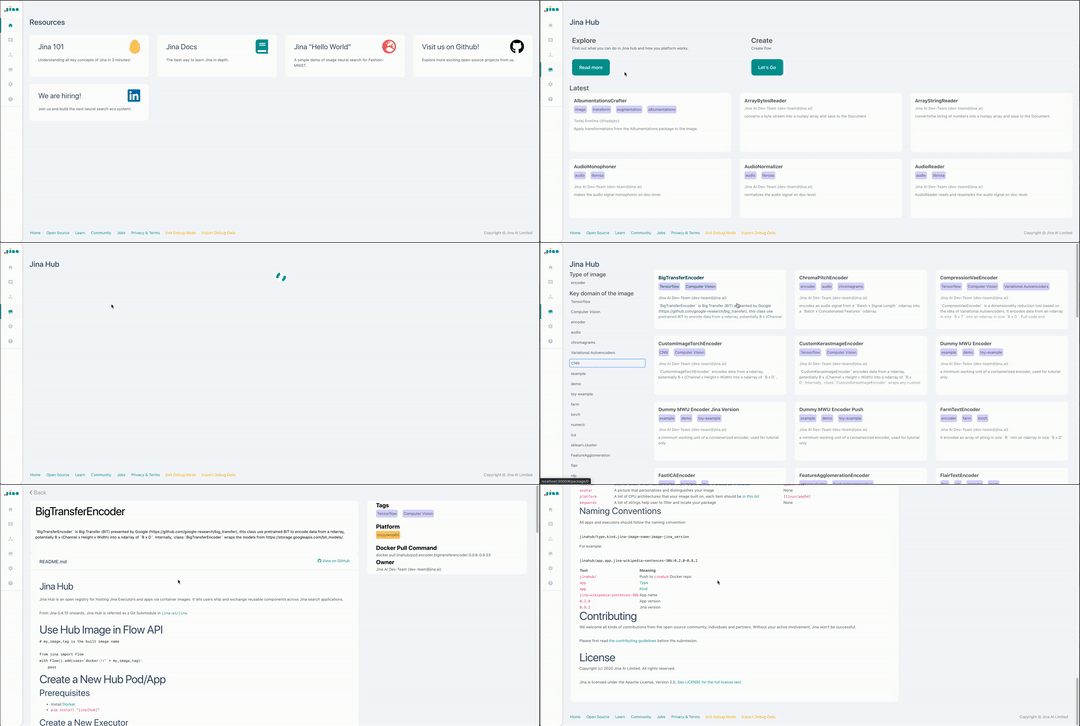
Browse Hub images uploaded by other users! Search and filter images according to various tags. Identify all information needed to use the Hub Pods with ease. All you need is a simple Docker pull command. Embrace the power of Open Source and a community-driven codebase!
- 🌟 Features:
- Contents
- Getting started
- Self-hosted Dashboard
- Contributing
- Community
- Open Governance
- Join Us
- License
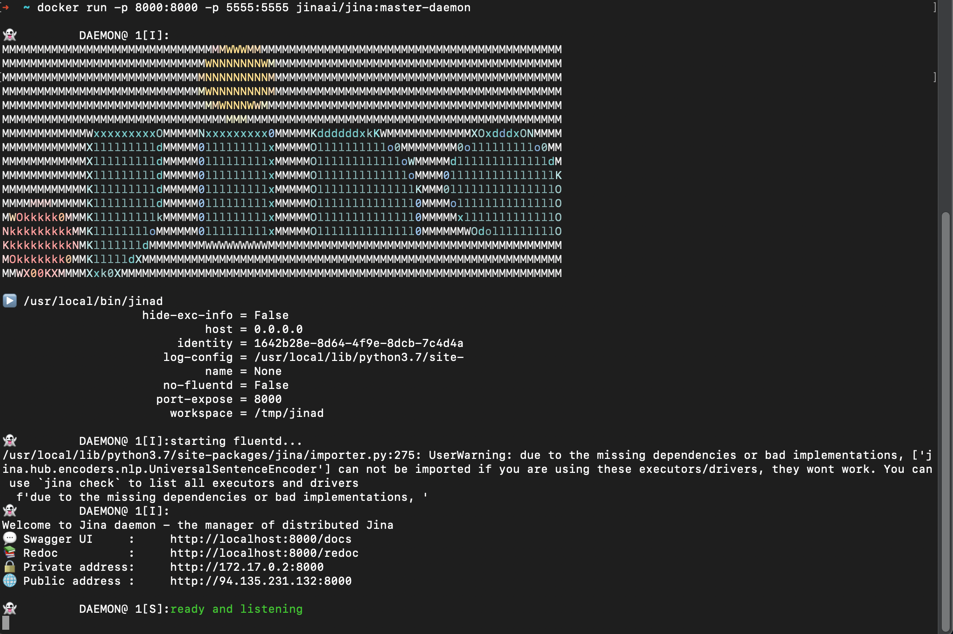
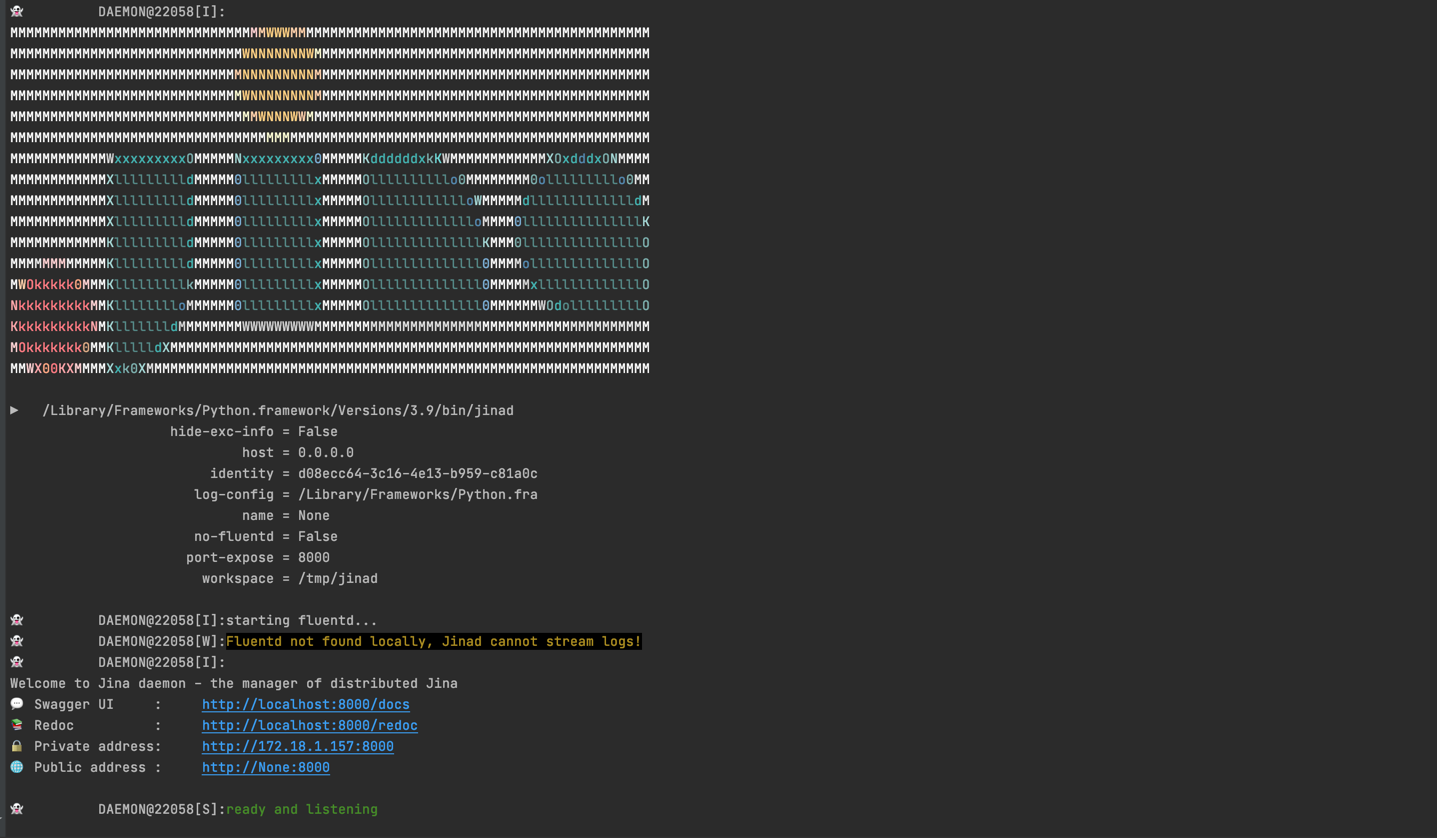
In order to use the dashboard you will need to start a Jina Deamon. You can do this by either using a Docker container that has been pre packaged for you or manually using a Command Line Interface (CLI).
- Install Docker and run Docker Desktop
- Pull the Docker image with
docker pull jinaai/jina:master-daemon- Run the Docker image with
docker run -p 8000:8000 -p 5555:5555 jinaai/jina:master-daemon- Install JinaD
- Run JinaD with
jinad- Go to Settings
- Set host to:
http://localhost - Set port to: the port specified when running JinaD (8000 in this example)
- Save changes
- Click 'Refresh' in the bottom right corner
- The globe icon in the top right corner will indicate connection status. A red X means the Dashboard is not connected to any Jina instance; a green checkmark indicates an active connection. The icon should change to green to show Dashboard, and the Jina Deamon are now connected.
- You should now be able to see the log stream and flow visualization.
You can also use a self-hosted dashboard instance locally.
Note: features like the Hub will not work when running the Dashboard locally. They are restricted to the dashboard.jina.ai origin. They are not necessary to view logs or interact with flows. If you would like to browse the Hub, do so from dashboard.jina.ai.
- Clone the GitHub repo
git clone https://github.com/jina-ai/dashboard.git && cd dashboard- Install dependencies using command
npm i- Start the testServer
npm run start_dev-server-
testServer should now be running on
http://localhost:5000by default -
Start the dashboard
npm run dashboard start- Dashboard should now be served on
http://localhost:3000by default
- Build dashboard:
npm run dashboard build- Run dashboard:
node dashboard- Dashboard should now be served on
http://localhost:3030by default
We welcome all kinds of contributions from the open-source community, individuals and partners. Without your active involvement, Jina can't be successful.
The following resources help you to make a good first contribution:
- Code of conduct - play nicely with the Jina community
- Slack workspace - join #general on our Slack to meet the team and ask questions
- YouTube channel - subscribe to the latest video tutorials, release demos, webinars and presentations.
- LinkedIn - get to know Jina AI as a company and find job opportunities
- follow and interact with us using hashtag
#JinaSearch- Company - know more about our company and how we are fully committed to open-source.
As part of our open governance model, we host Jina's Engineering All Hands in public. This Zoom meeting recurs monthly on the second Tuesday of each month, at 14:00-15:30 (CET). Everyone can join in via the following calendar invite.
The meeting will also be live-streamed and later published to our YouTube channel.
Jina is an open-source project. We are hiring full-stack developers, evangelists, and PMs to build the next neural search ecosystem in open source.
Copyright (c) 2020-2021 Jina AI Limited. All rights reserved.
Jina is licensed under the Apache License, Version 2.0. See LICENSE for the full license text.

