Load test setup with containerized Locust, Prometheus and Grafana
This project demonstrates how we can perform a load test with locust, scrape the results via locust_exporter into Prometheus and display them on Grafana.
This project is heavily insprired by this blog post by ContainerSolutions.
The locust_exporter and Grafana dashboard are directly taken from the blog post itself. This project tries to put them all into a single docker-compose file which can run them at once.
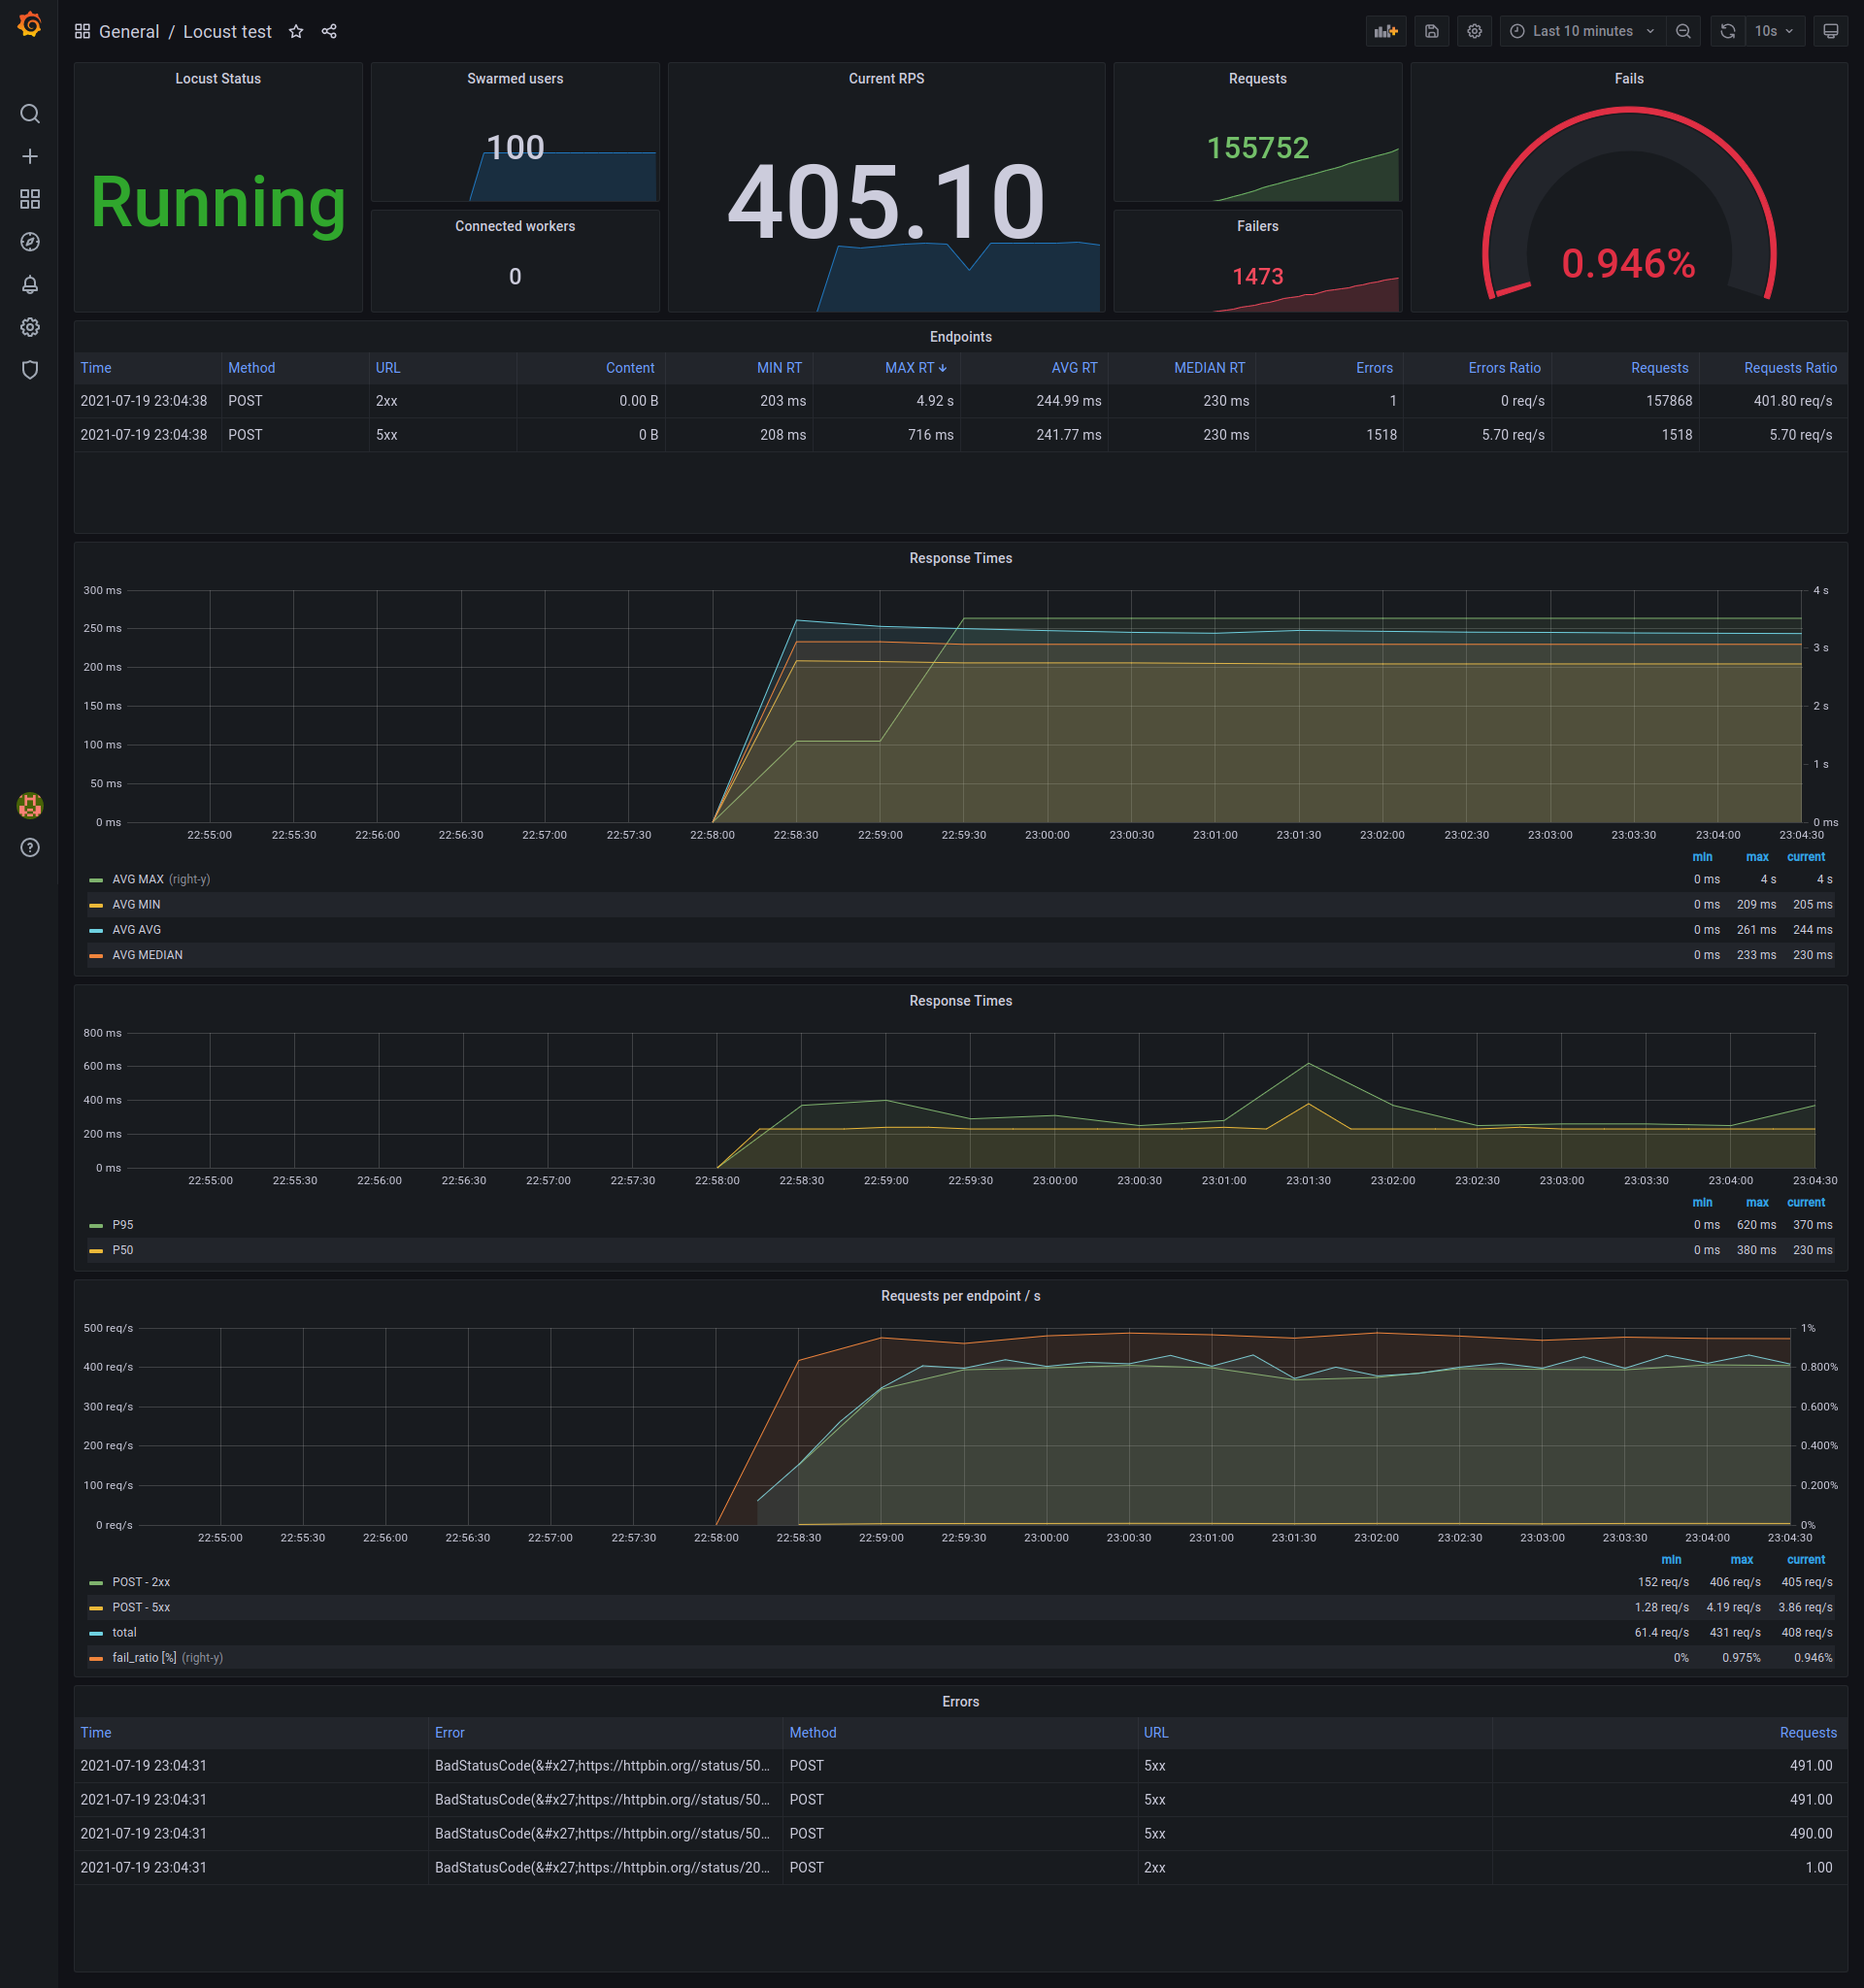
I have modified the dashboard JSON to tweak a few things, remove unwanted panels, some cosmetic changes here and there. Feel free to modify the same as per your requirements. You can find the JSON at grafana/dashboard.json.
We have kept all the ports as default ones, for ease of use. You can change them as per your convenience, in their respective config files.
- Locust starts on port
8089and sends stats on the/stats/requestsendpoint. locust_exporterscrapes this endpoint, converts the stats into a format that is understood by Prometheus and pushes them on port9646- Prometheus listens on this port (that's what we configure in
prometheus/loadtest.yaml) and pushes its metris to port9090 - Next, we configure Prometheus as datasource in Grafana (
grafana/provisioning/datasources/prom.yaml) to read from port9090. - Lastly, we configure dashboard in Grafana (in
grafana/provisioning/dashboards/loadtest.yaml).
- Make sure your script is ready to be executed. It should be named as
locustfile.pyand must be present in the same directory as thedocker_compose.yml- If you want to run a different file, you can make changes the the
docker_compose.yml.
- If you want to run a different file, you can make changes the the
Refer the tree structure below:
.
├── docker-compose.yml
├── grafana
│   ├── dashboard.json
│   └── provisioning
│       ├── dashboards
│       │   └── loadtest.yaml
│       └── datasources
│           └── prom.yaml
├── LICENSE
├── locustfile.py
├── prometheus
│   └── loadtest.yaml
├── requirements.py
└── setup.cfg
- Build and run services using
docker-compose up - Go to
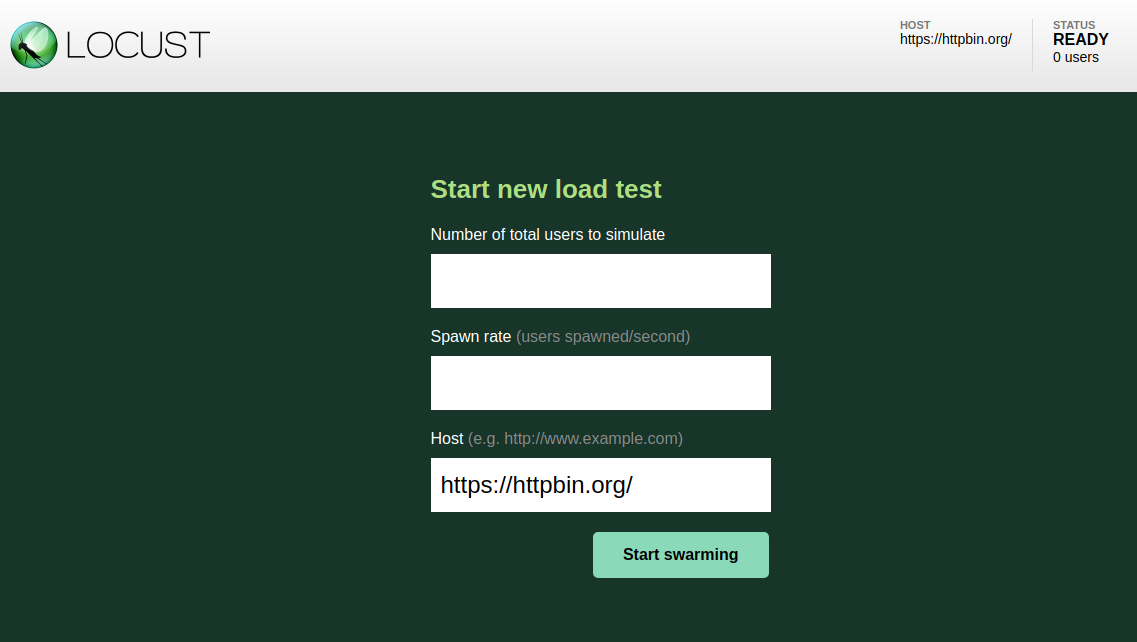
localhost:8089, enter the number of concurrent users, the spawn rate, the host, and begin.- Alternately, you can also run locust in
headlessmode and just look at the Grafana dashboard in the next step.
- Alternately, you can also run locust in
- Go to
localhost:3000to view your Grafana dashboard.

