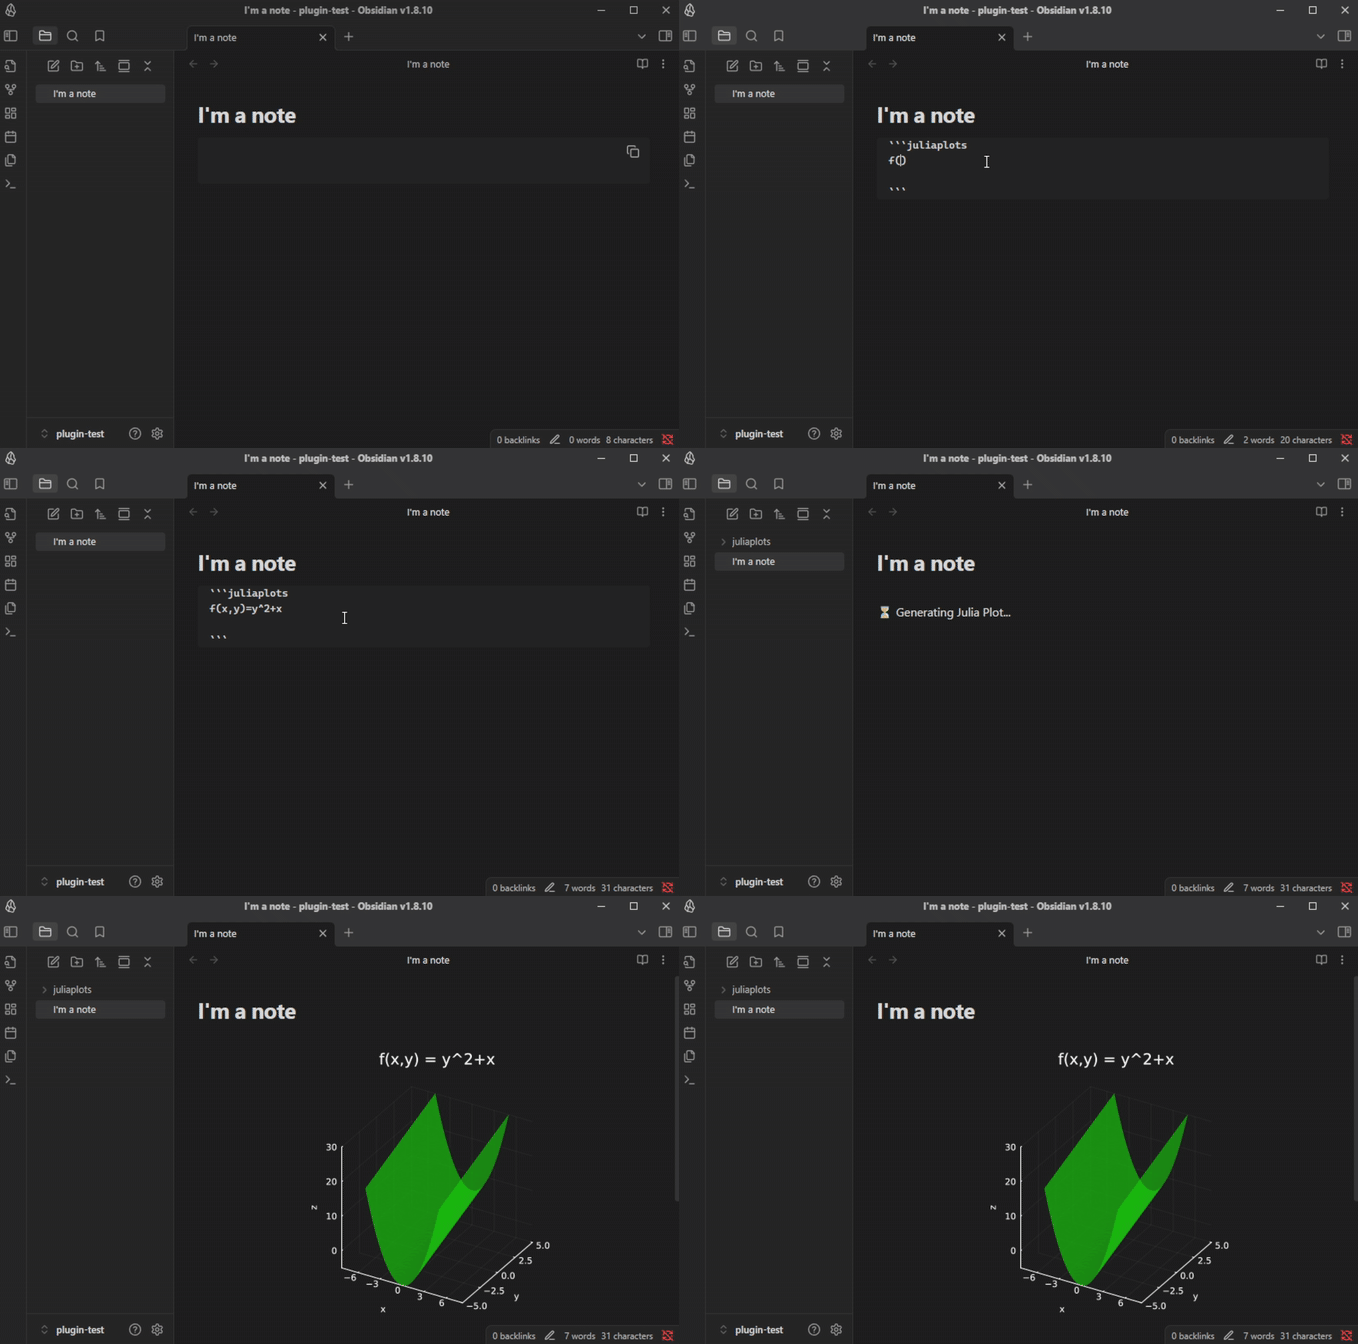
- Easily generate graphs of 2D and 3D functions directly in Obsidian using Julia
- Straightforward and fast syntax
- Customizable default parameters
- Graph customization (Colors, line width, title, labels, dark mode)
- Multiple functions rendering support
- 2D Points rendering support
⚠️ This plugin only works for the desktop Obsidian app
-
Install Julia on your system, and install the Plots package in it.
-
Download the plugin from Settings > Community plugins > Browse and enable it
-
Download juliaplots.jl from the latest release and put the file in
.obsidian/plugins/juliaplots/on your vault
| Parameter | Description |
|---|---|
<name_of_function>(x)=<math_equation>, <color> |
Function to plot in terms of x. It can have any name, as long as it ends with (x). Color can be omitted. You can add as many as you want. |
<name_of_function>(x,y)=<math_equation>, <color> |
3D Function to plot in terms of x and y. It can have any name, as long as it ends with (x,y). Color can be omitted. You can add as many as you want. |
scatter=<x>,<y>,<color>,<label> ; <x2>,<y2>... |
Points to render on the graph. Multiple points must be separated with a ;. Color and label can be omitted, but if not, they have to be in the specified order |
xmin=<number> |
Start of the range on the x-axis that will be plotted |
xmax=<number> |
End of the range on the x-axis that will be plotted |
ymin=<number> |
Start of the range on the y-axis that will be plotted (for 3D functions) |
ymax=<number> |
End of the range on the y-axis that will be plotted (for 3D functions) |
num_points=<number> |
Number of points of the function that will be plotted on the range (warning: a small number will result in a non-smooth graph) |
title=<graph_title> |
Title that will be displayed at the top of the graph |
x_label=<label> |
Label that will be displayed on the x-axis |
y_label=<label> |
Label that will be displayed on the y-axis |
z_label=<label> |
Label that will be displayed on the z-axis (for 3D functions) |
color=<color> |
Color that the functions on the graph will use if not specified |
scatter_color=<color> |
Color that the points on the graph will use if not specified |
line_width=<number> |
Width of the function lines |
dark_mode=<true/false> |
Renders the graph with a suitable view for vaults with dark themes |
☑️ If any of these parameters is omitted, the configured default value will be used! You can change them in the plugin's settings tab
   ```juliaplots
   f(x) = x^2, red
   myfunction2(x) = cos(x)
   scatter= 2,1 ; 3,2,red,point1

   xmin = -10
   xmax = 25
   num_points = 100

   title = my graph
   x_label = time (s)
   y_label = velocity (m/s)

   color = rgb(0,255,0)
   scatter_color = black
   line_width = 2
   dark_mode = false
   ```
- 🕒 Long waiting time: The plugin can take a long time to generate the graph depending on the user. If you have this problem, it is recommended to use a lower number of plot points.
- 📁 'juliaplots.jl: No such file or directory': This means that the
juliaplots.jlfile wasn't downloaded and/or isn't in the right directory. Be sure of following the installation steps!
Feel free to open an issue or a pull request if you have suggestions, improvements, or bug reports. This plugin is in a very early development stage; every contribution is appreciated.


