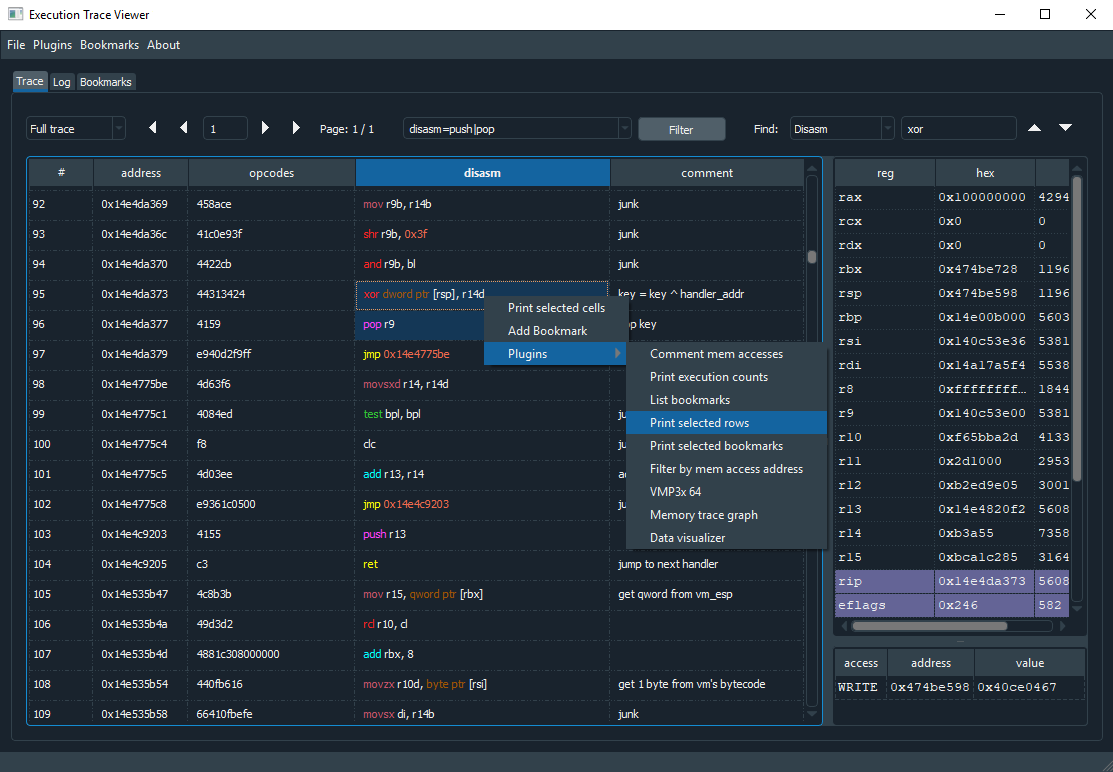
Execution Trace Viewer is an application for viewing, editing and analyzing execution traces. It was originally made for reverse engineering obfuscated code, but it can be used to analyze any kind of execution trace.
- open, edit and save execution traces
- search & filter trace by disasm, reg values, memory address/value, etc
- add comments and bookmarks
- write python plugins
- supports x64dbg traces
git clone https://github.com/teemu-l/execution-trace-viewer

pip install pyqt5 yapsy qdarkstyle capstone
python tv.pyFollowing file formats are supported:
-
.tvt - Default file format. Developed from x64dbg trace format. 3 differences with x64dbg format: comments, disasm and bookmarks added.
-
.trace32 / .trace64 - x64dbg file format. Only reading supported. Loading x64dbg traces is slow because the code needs to be disassembled.
-
json - Traces can be saved and loaded from json text files.
Traces folder contains one sample trace. It is ~11k lines of obfuscated code (by VMProtect3). All the handlers are disassembled and added to bookmarks table.
Execution Trace Viewer can be extended by Python3 plugins. Plugins are launched from plugins menu or from right-click menu on trace table. Check the example plugins and core/api.py for more info.
More plugins:
- Memory trace graph
- Data visualizer
- your link here?
Example filters:
| Filter | Description |
|---|---|
| disasm=push|pop | disasm contains word push or pop (push, pushfd, pop, etc) |
| reg_eax=0x1337 | show rows where eax is 0x1337 |
| reg_any=0x1337 | any reg value is 0x1337 |
| mem_value=0x1337 | read or write value 0x1337 to memory |
| mem_read_value=0x1337 | read value 0x1337 from memory |
| mem_addr=0x4f20 | read from or write to memory address 0x4f20 |
| mem_read_addr=0x40400 | read from memory address 0x40400 |
| mem_write_addr=0x40400 | write to memory address 0x40400 |
| opcodes=c704 | filter by opcodes |
| rows=20-50 | show only rows 20-50 |
| regex=0x40?00 | case-sensitive regex search for whole row (including comment) |
| regex=READ | show insctructions which read memory |
| iregex=junk|decrypt | inverse regex, rows with 'junk' or 'decrypt' are filtered out |
| comment=decrypt | filter by comment |
It's possible to join multiple filters together:
disasm=xor/reg_any=0x1337 ; show all xor instructions where atleast one register value is 0x1337
For more complex filtering you can create a filter plugin and save the result list using api.set_filtered_trace(). Then show the trace by calling api.show_filtered_trace().
Finds next or previous row that contains specified keyword/value in trace.
Find previous memory write:
from core.filter_and_find import TraceField
current_row = 500
next_row = find(
    trace=trace_data.trace,
    field=TraceField.MEM,
    keyword='WRITE',
    start_row=current_row,
    direction=-1
)
Trace fields: DISASM, REGS, MEM, MEM_ADDR, MEM_VALUE, COMMENT, ANY
DISASM field supports multiple keywords: "xor/shl/shr". MEM field checks all three fields in mem access (access, addr and value). Integers must be given in hexadecimal.
Dark theme can be disabled by editing prefs.py:
USE_DARK_THEME = False- add support for more trace formats & architectures
- fix x64dbg trace problem: if memory content doesn't change on write operation, the access is shown as 'READ' (bad design of the file format?)
- documentation
MIT
Developed by Teemu Laurila.
Contact:
print(''.join(map(chr,[k^86 for k in [34,51,51,59,35,58,55,22,38,36,57,34,57,56,59,55,63,58,120,53,57,59]])))