This blog should guide you how to debug Node.js addon using Visual Studio Code. You can apply it to other project too.
Don't be scared, it's very simple, let's have some fun.
It covered:
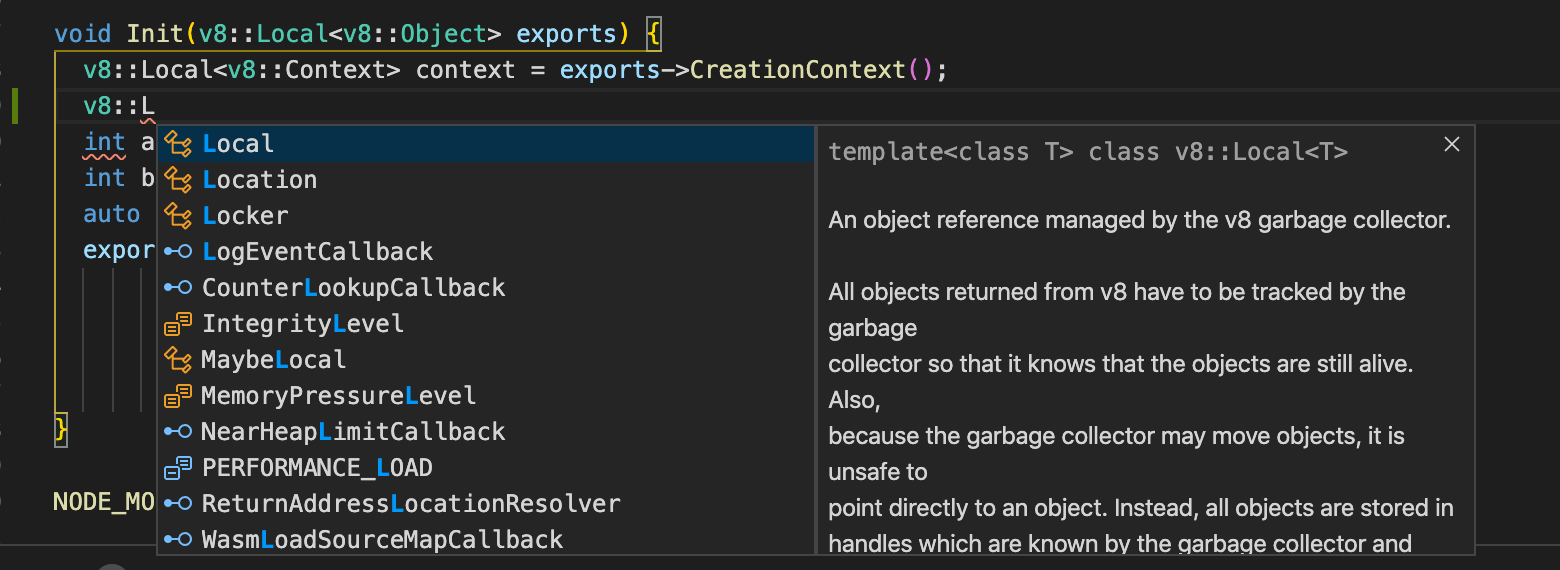
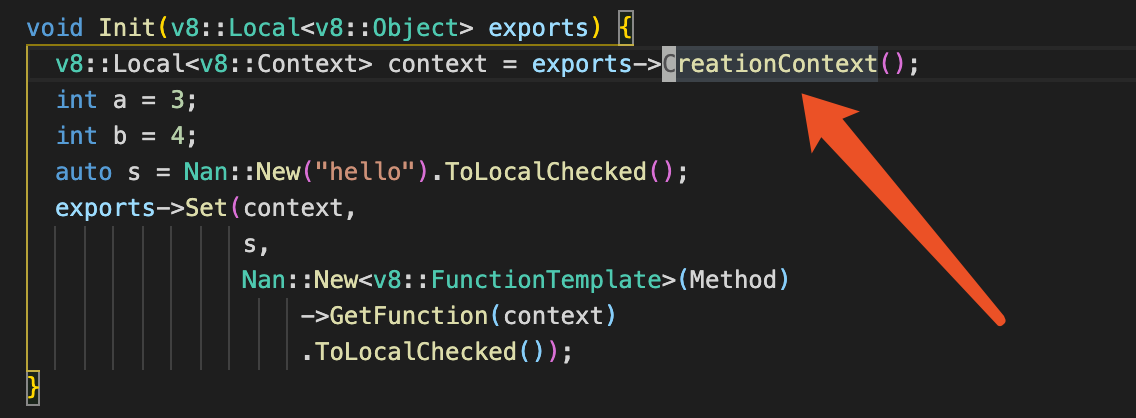
- code autocompletion and go to implementation
- debug code
Install vscode and this plugin. In the page, it will instruct you how to install Docker.
After setup all the devtools, clone this repo (most the code is copied
from https://github.com/nodejs/node-addon-examples/tree/master/1_hello_world/nan).
Run the Remote-Containers: Open Folder in Container... command and select the local folder.
After vscode open a new window. It will take some time to open this project,
mainly pulling the docker Image gengjiawen/node-build.
Execute node-gyp configure -- -f compile_commands_json in terminal.
By running the command C/C++: Edit Configurations (UI) from the Command Palette,
this would generate .vscode/c_cpp_properties.json file for you
Edit it by adding "compileCommands": "${workspaceFolder}/Debug/compile_commands.json",
This final file look like this:
{
    "configurations": [
        {
            "name": "Linux",
            "includePath": [
                "${workspaceFolder}/**"
            ],
            "defines": [],
            "compilerPath": "/usr/bin/clang",
            "compileCommands": "${workspaceFolder}/Debug/compile_commands.json",
            "cStandard": "c11",
            "cppStandard": "c++17",
            "intelliSenseMode": "clang-x64"
        }
    ],
    "version": 4
You now should edit the code, open hello.cc, now you can use code completion and navigation
Debug plugin relies vscode-lldb
Press F5, and choose LLDB in prompt

After generated config (location in .vscode/launch.json), edit program and args part.
This final config looks like this
{
    "version": "0.2.0",
    "configurations": [
        {
            "type": "lldb",
            "request": "launch",
            "name": "Debug",
            "program": "node",
            "args": ["hello.js"],
            "cwd": "${workspaceFolder}"
        }
    ]
}
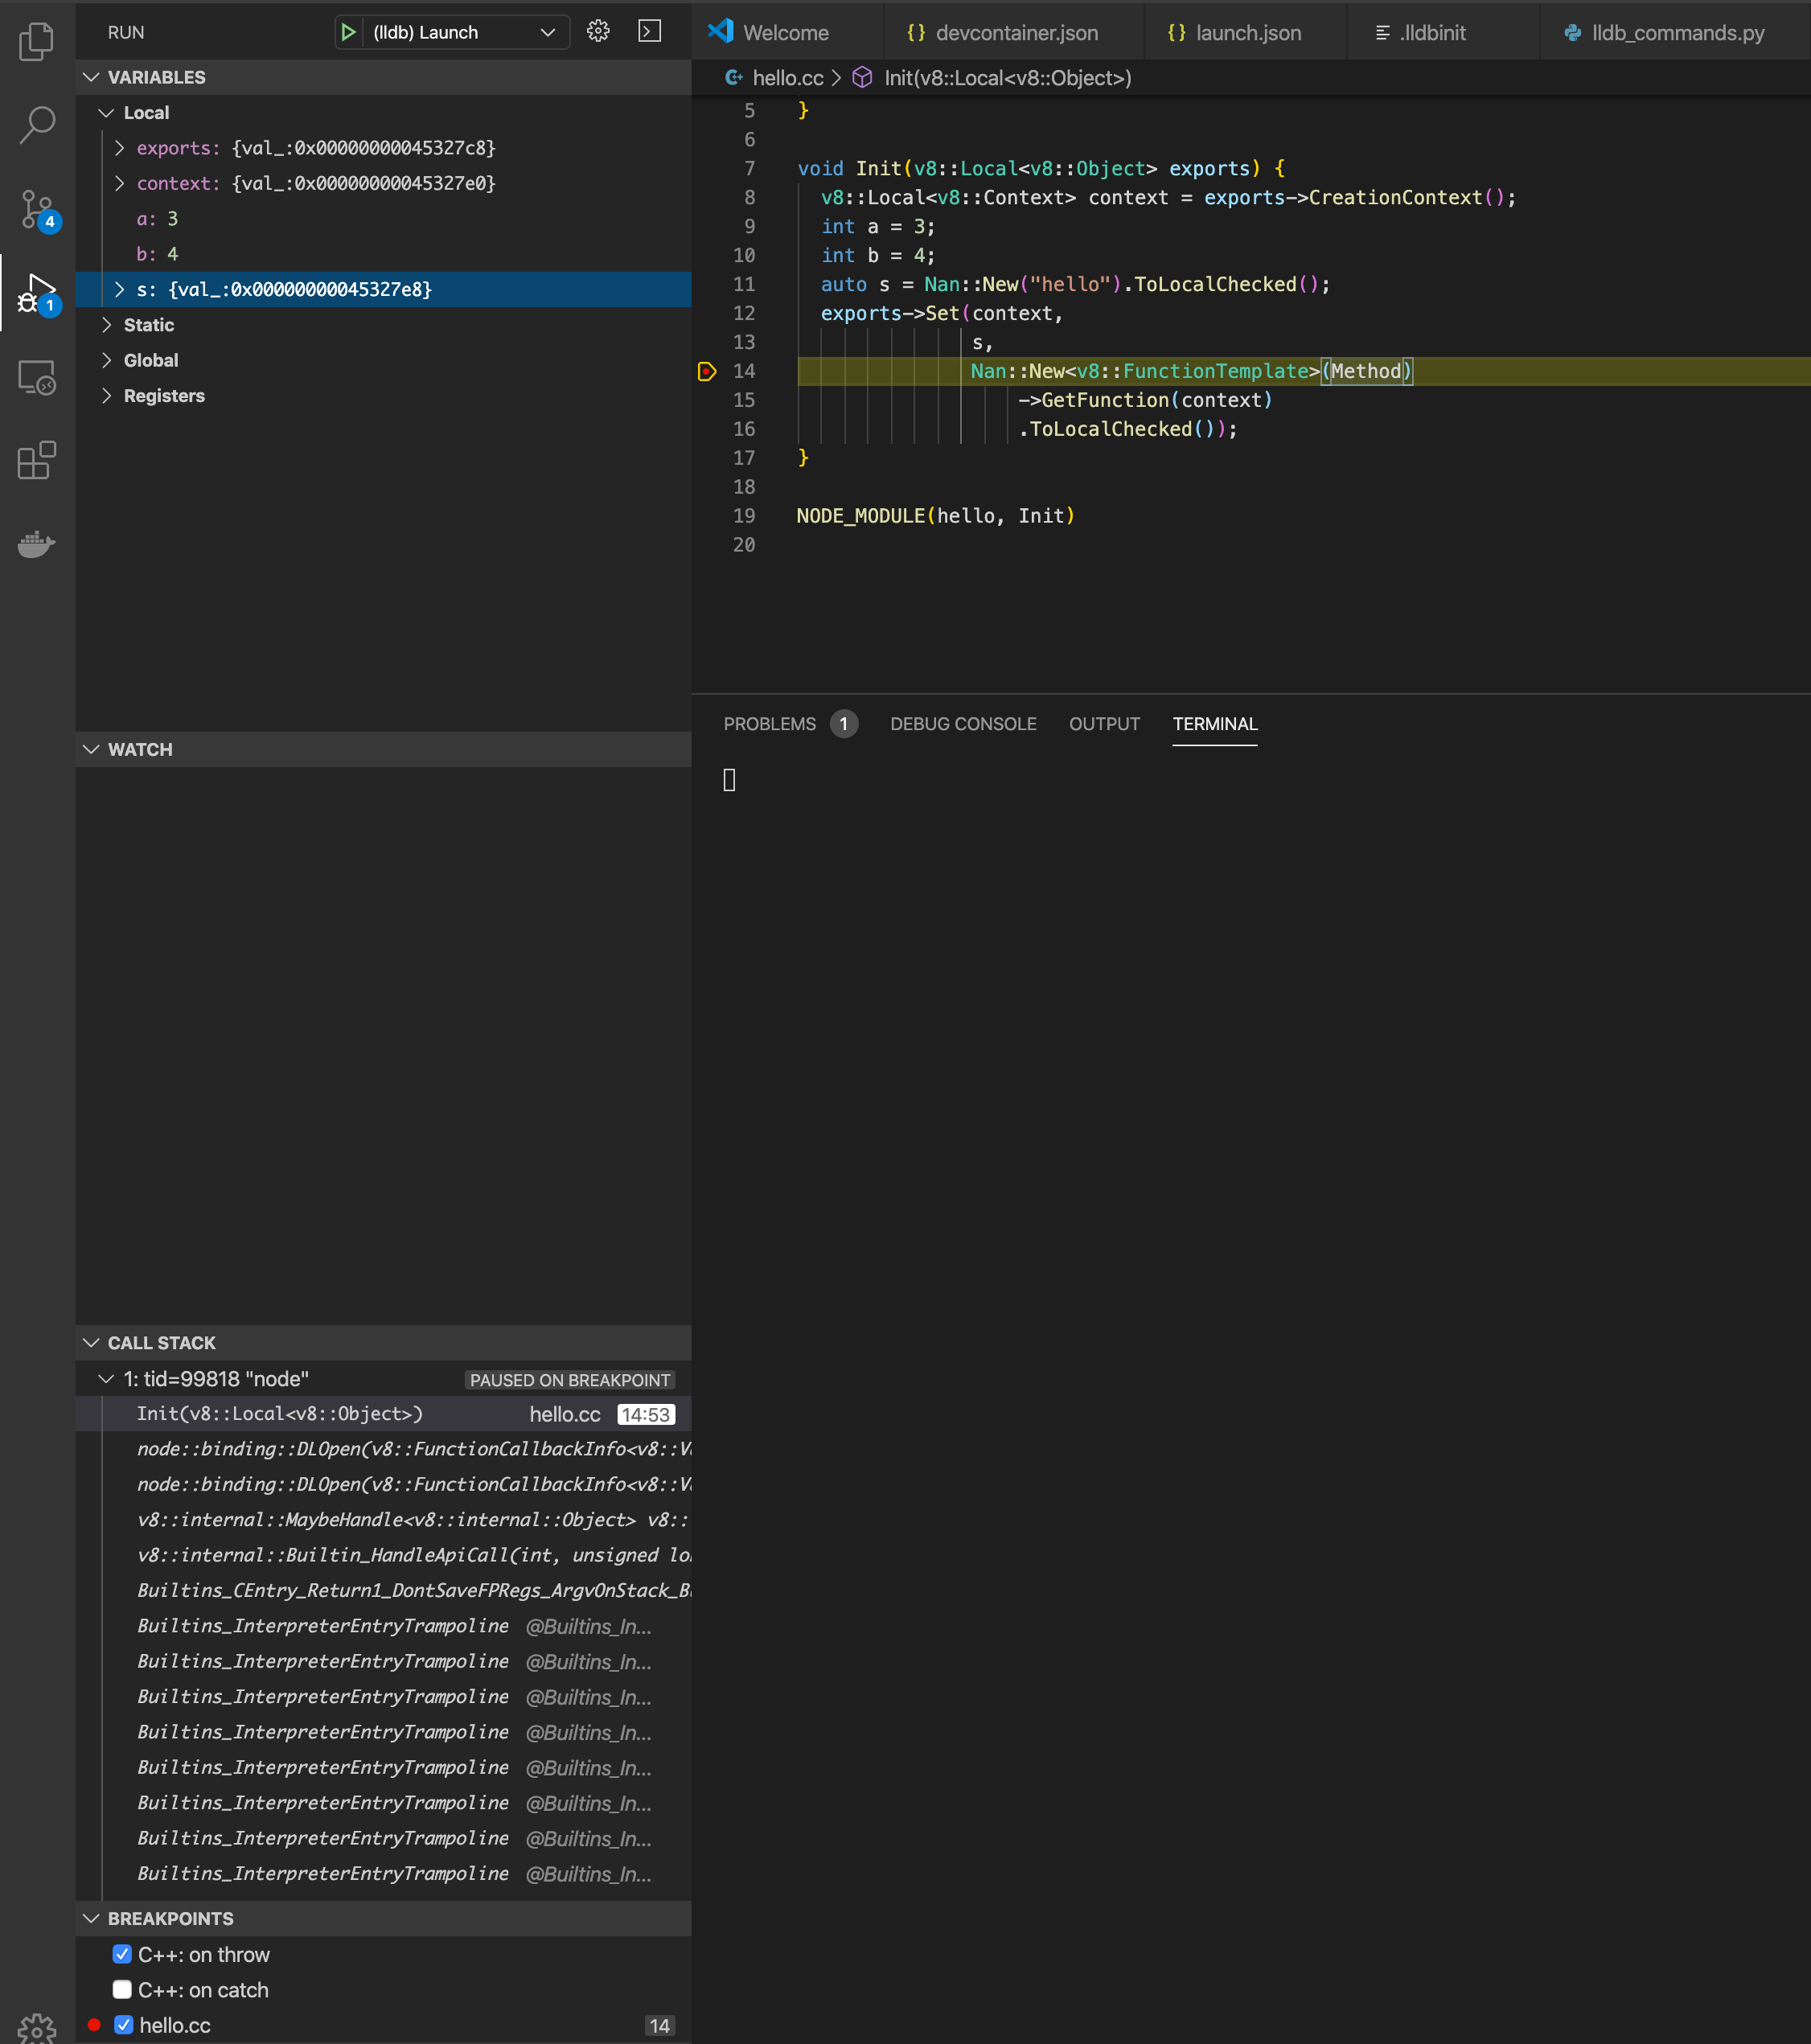
Then set breakpoint in hello.cc, then print F5 again. You should see something like this
You may notice the variable s value information is not helpful. It's a v8::Value,
we are working on it to make it more informative.
If you want to debug native OS api like windows specific api, you can
use the same way. But you need to setup the whole dev yourself, like C++
compiler, python and other staff. You can also try other IDE support like
Visual studio or Clion by generating cmake config using node-gyp configure -- -f cmake.
Most thankful to @joyeecheung @danbev @addaleax @bnoordhuis @hsiaosiyuan0 for their amazing work and inspirations.
- https://joyeecheung.github.io/blog/2018/12/31/tips-and-tricks-node-core/
- https://code.visualstudio.com/docs/remote/containers
- https://github.com/vadimcn/vscode-lldb
- https://medium.com/fhinkel/debug-v8-in-node-js-core-with-gdb-cc753f1f32
- bnoordhuis/v8-cmake#8
- https://github.com/Microsoft/vscode-remote-try-node
- nodejs/node#32402


