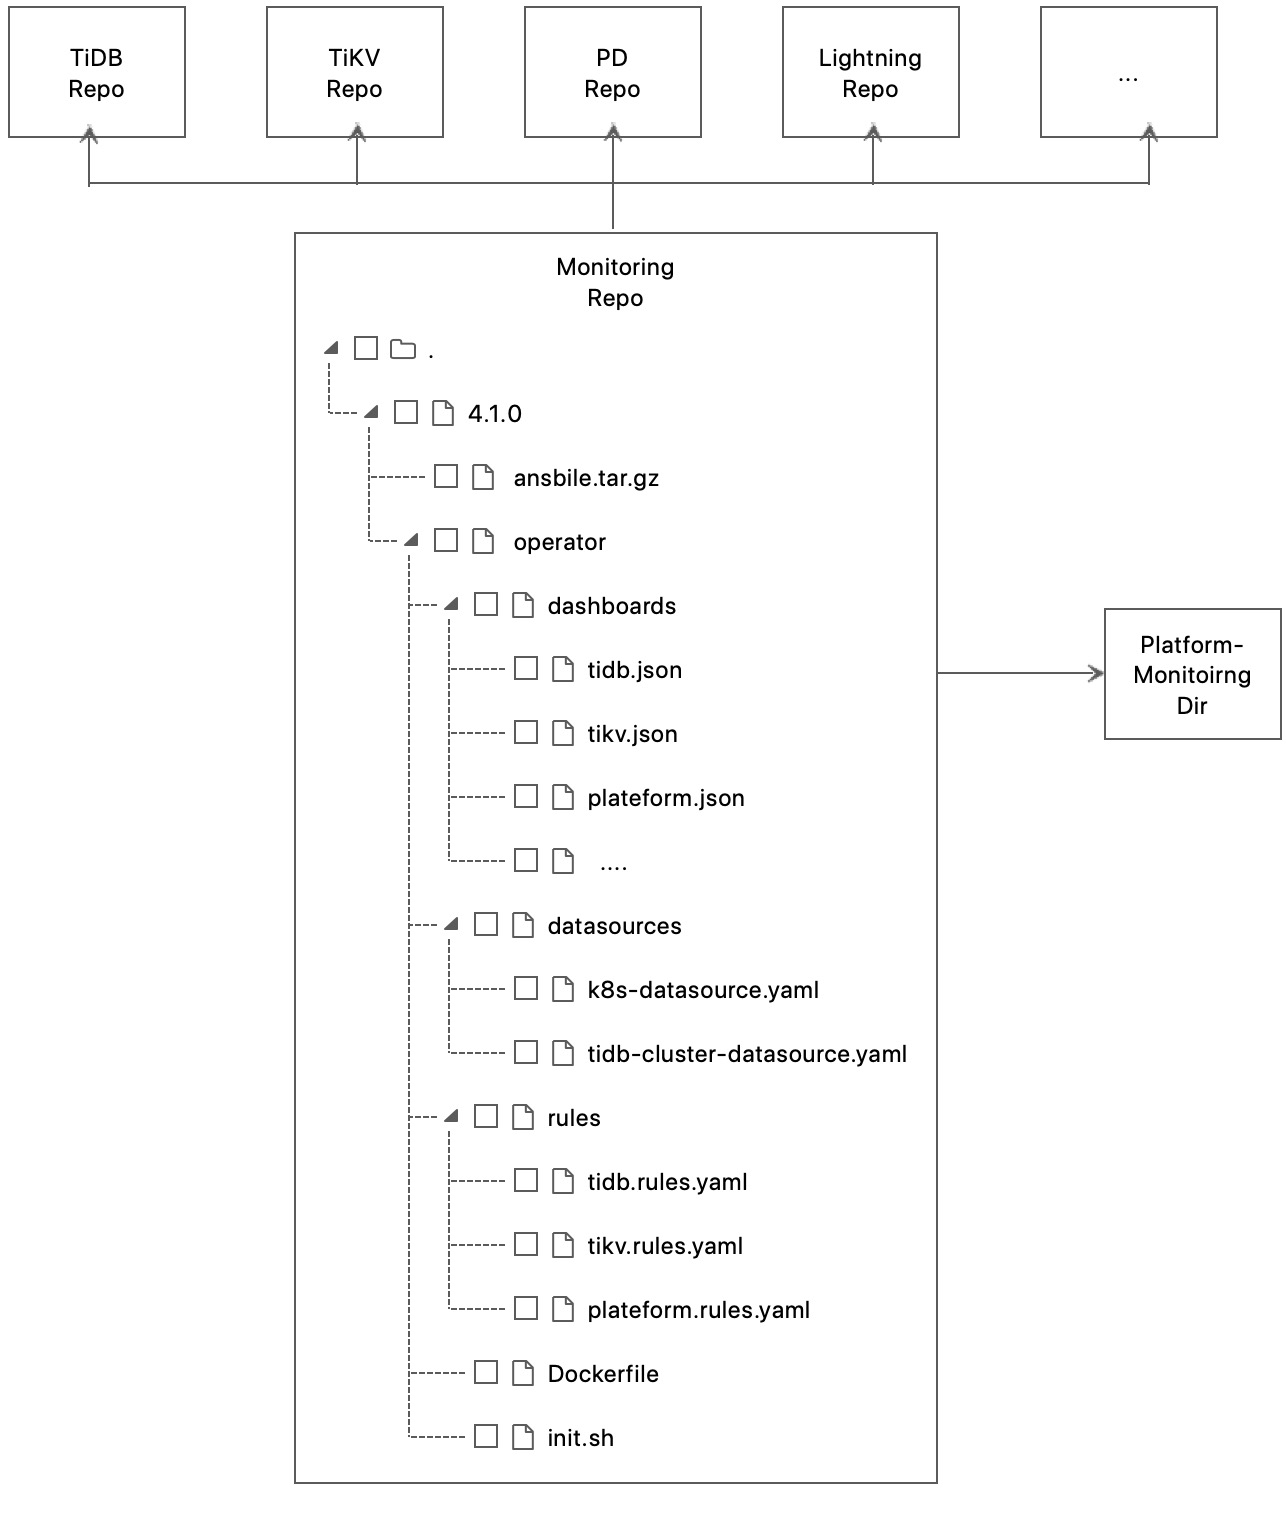
This repo contains three functions. One support dynamic reload rules of prometheus, the other is used to support multi TiDB version.
Function1 - Automatic generation monitoring configurations for ansible deployment and operator deployment
Generate versioned monitoring data that is used by tidb-operator or tidb-ansible. It is a binary to load monitoring configurations from special component repo and it also contain platform monitoring from platform-monitoring directory.
 Ansible deployment and operator deployment has different platform monitoring files. The structure of platform monitoring directory is here:
platform-monitoring/
     |-- ansbile
     |       |---- grafana
     |       |        | ---- machine.json
     |       |
     |       |---- rule
     |                | ---- machine.rules.yaml
     |
     |-- operator
             |---- grafana
             |        |
             |        |----- node.json
             |---- rule
             |        |
             |        |---- node.rules.yaml
             |---- datasource
                      |
                      |---- k8s-cluster.yaml
                      |
                      |---- tidb-cluster.yaml
The binary will automate load platform monitoring based on the above directory structure to different deployment directory.
go build -o pull-monitoring  cmd/monitoring.go

./pull-monitoring
Error: required flag(s) "config" not set
Usage:
  load [flags]

Flags:
      --auto-push                        auto generate new branch from master and push auto-generate files to the branch
      --config string                    the monitoring configuration file.
  -h, --help                             help for load
      --output-dir string                the base directory of the program (default ".")
      --tag string                       the tag of pull monitoring repo.
It is a simple binary to trigger a reload when Rules are updated. It watches dirs and call reload API that the rules has been changed.
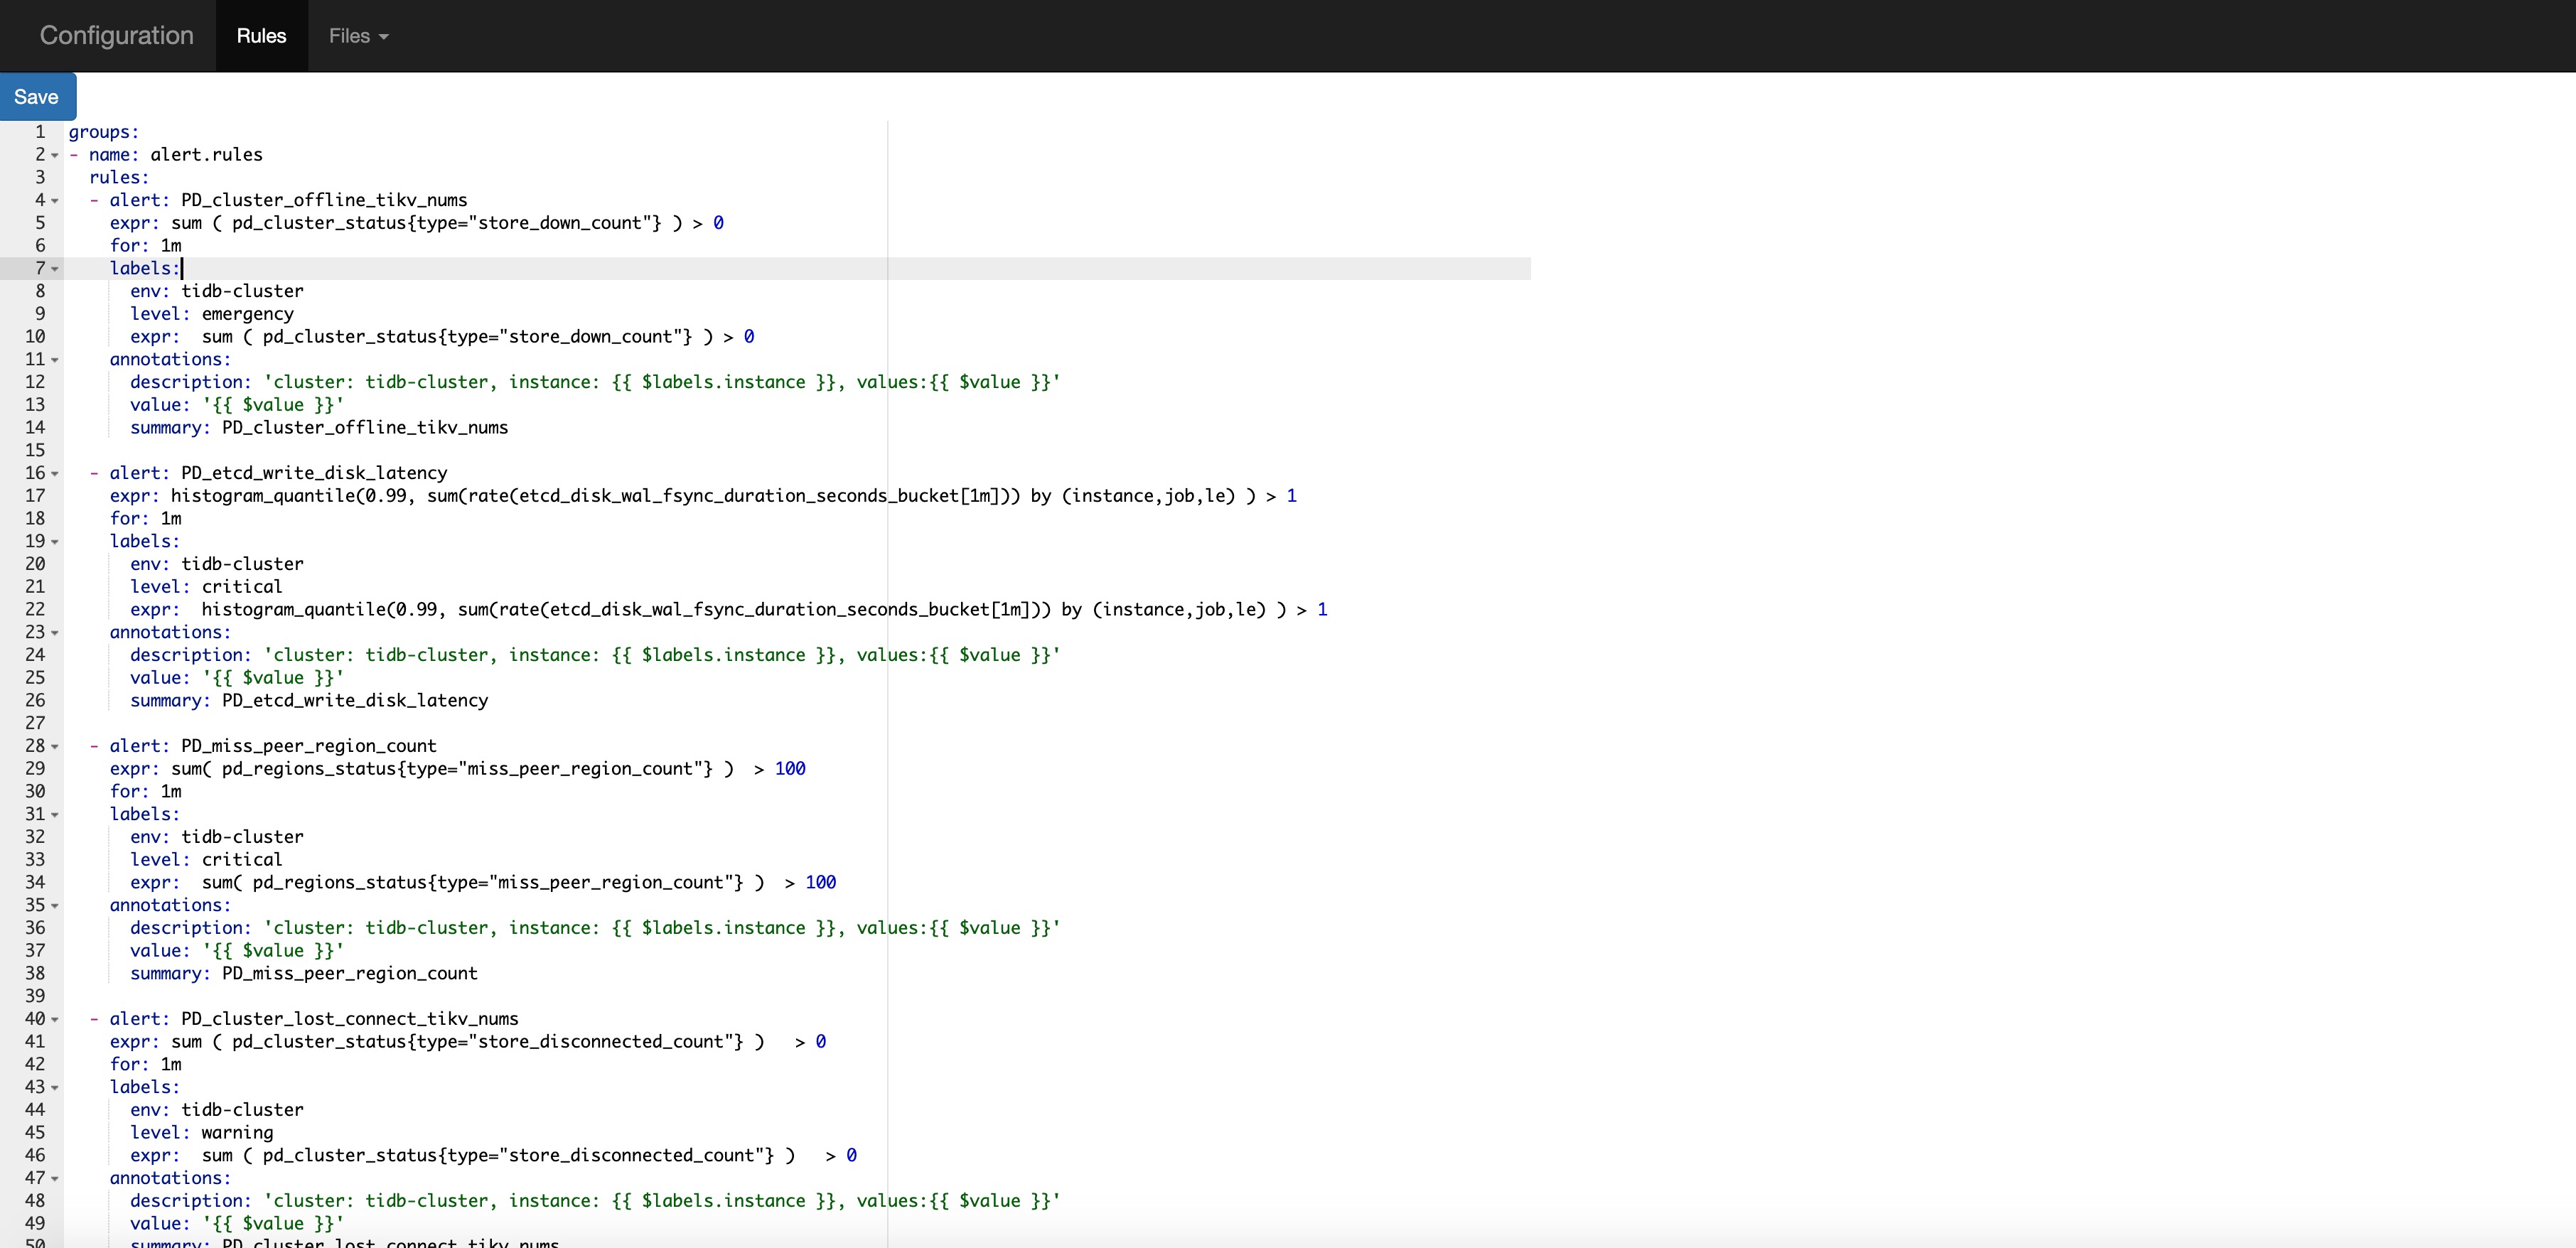
It provide a UI to update rules(For ease of use, the UI is similar with UI of Prometheus).

The text editor is friendly to Yaml format. To quickly verify that the modification is successful, there is Rules UI which get rules from Prometheus (You can also verify it by Prometheus.).
make
There is binary in reload/build/{plateform}/reload, you can run it like this
./reload --watch-path=/tmp/prometheus-2.8.0.darwin-amd64/rules --prometheus-url=http://127.0.0.1:9090
Generate versioned monitoring data that is used by tidb-operator. This project pulls TiDB monitoring data from tidb-ansible and uses the git tag to understand the TiDB version.
All TiDB version monitoring information is automatically generated (by default it generates for TiDB version >= 2.1.8). The structure of monitor directory is like this
 monitor/
    |── v2.1.8
    |   ├── dashboards
    |   │   ├─ overview.json
    |   │   ├─ binlog.json
    |   │   |_ pd.json
    |   |   |_ tikv_pull.json
    |   |   |_ tidb.json
    |   |
    |   |── rules
    |   |   ├── tidb.rule.yml
    |   |   ├── tikv.rule.yml
    |   |   └── pd.rule.yml
    |   |—— Dockerfile
    |   |__ init.sh
    |
    |── v3.0.0
    |   ├── dashboards
    |   │   |- overview.json
    |   │   |- binlog.json
    |   │   |- pd.json
    |   |   |- tidb.json
    |   |   |- tikv_details.json
    |   |   |- tikv_sumary.json
    |   |   |_ tikv_trouble_shooting.json
    |   |
    |   |── rules
    |   |   ├── tidb.rule.yml
    |   |   ├── tikv.rule.yml
    |   |   └── pd.rule.yml
    |   |—— Dockerfile
    |   |__ init.sh
    |___ ...
make
There will be monitoring binary, you can run it like this
./monitoring --path=.
The program will replace some variables and the docker will receive 4 variables:
GF_PROVISIONING_PATH // grafana provisioning path
TIDB_CLUSTER_NAME // TiDB cluster name
TIDB_ENABLE_BINLOG // whether enable binlog
PROM_CONFIG_PATH // proemtheus rules config path