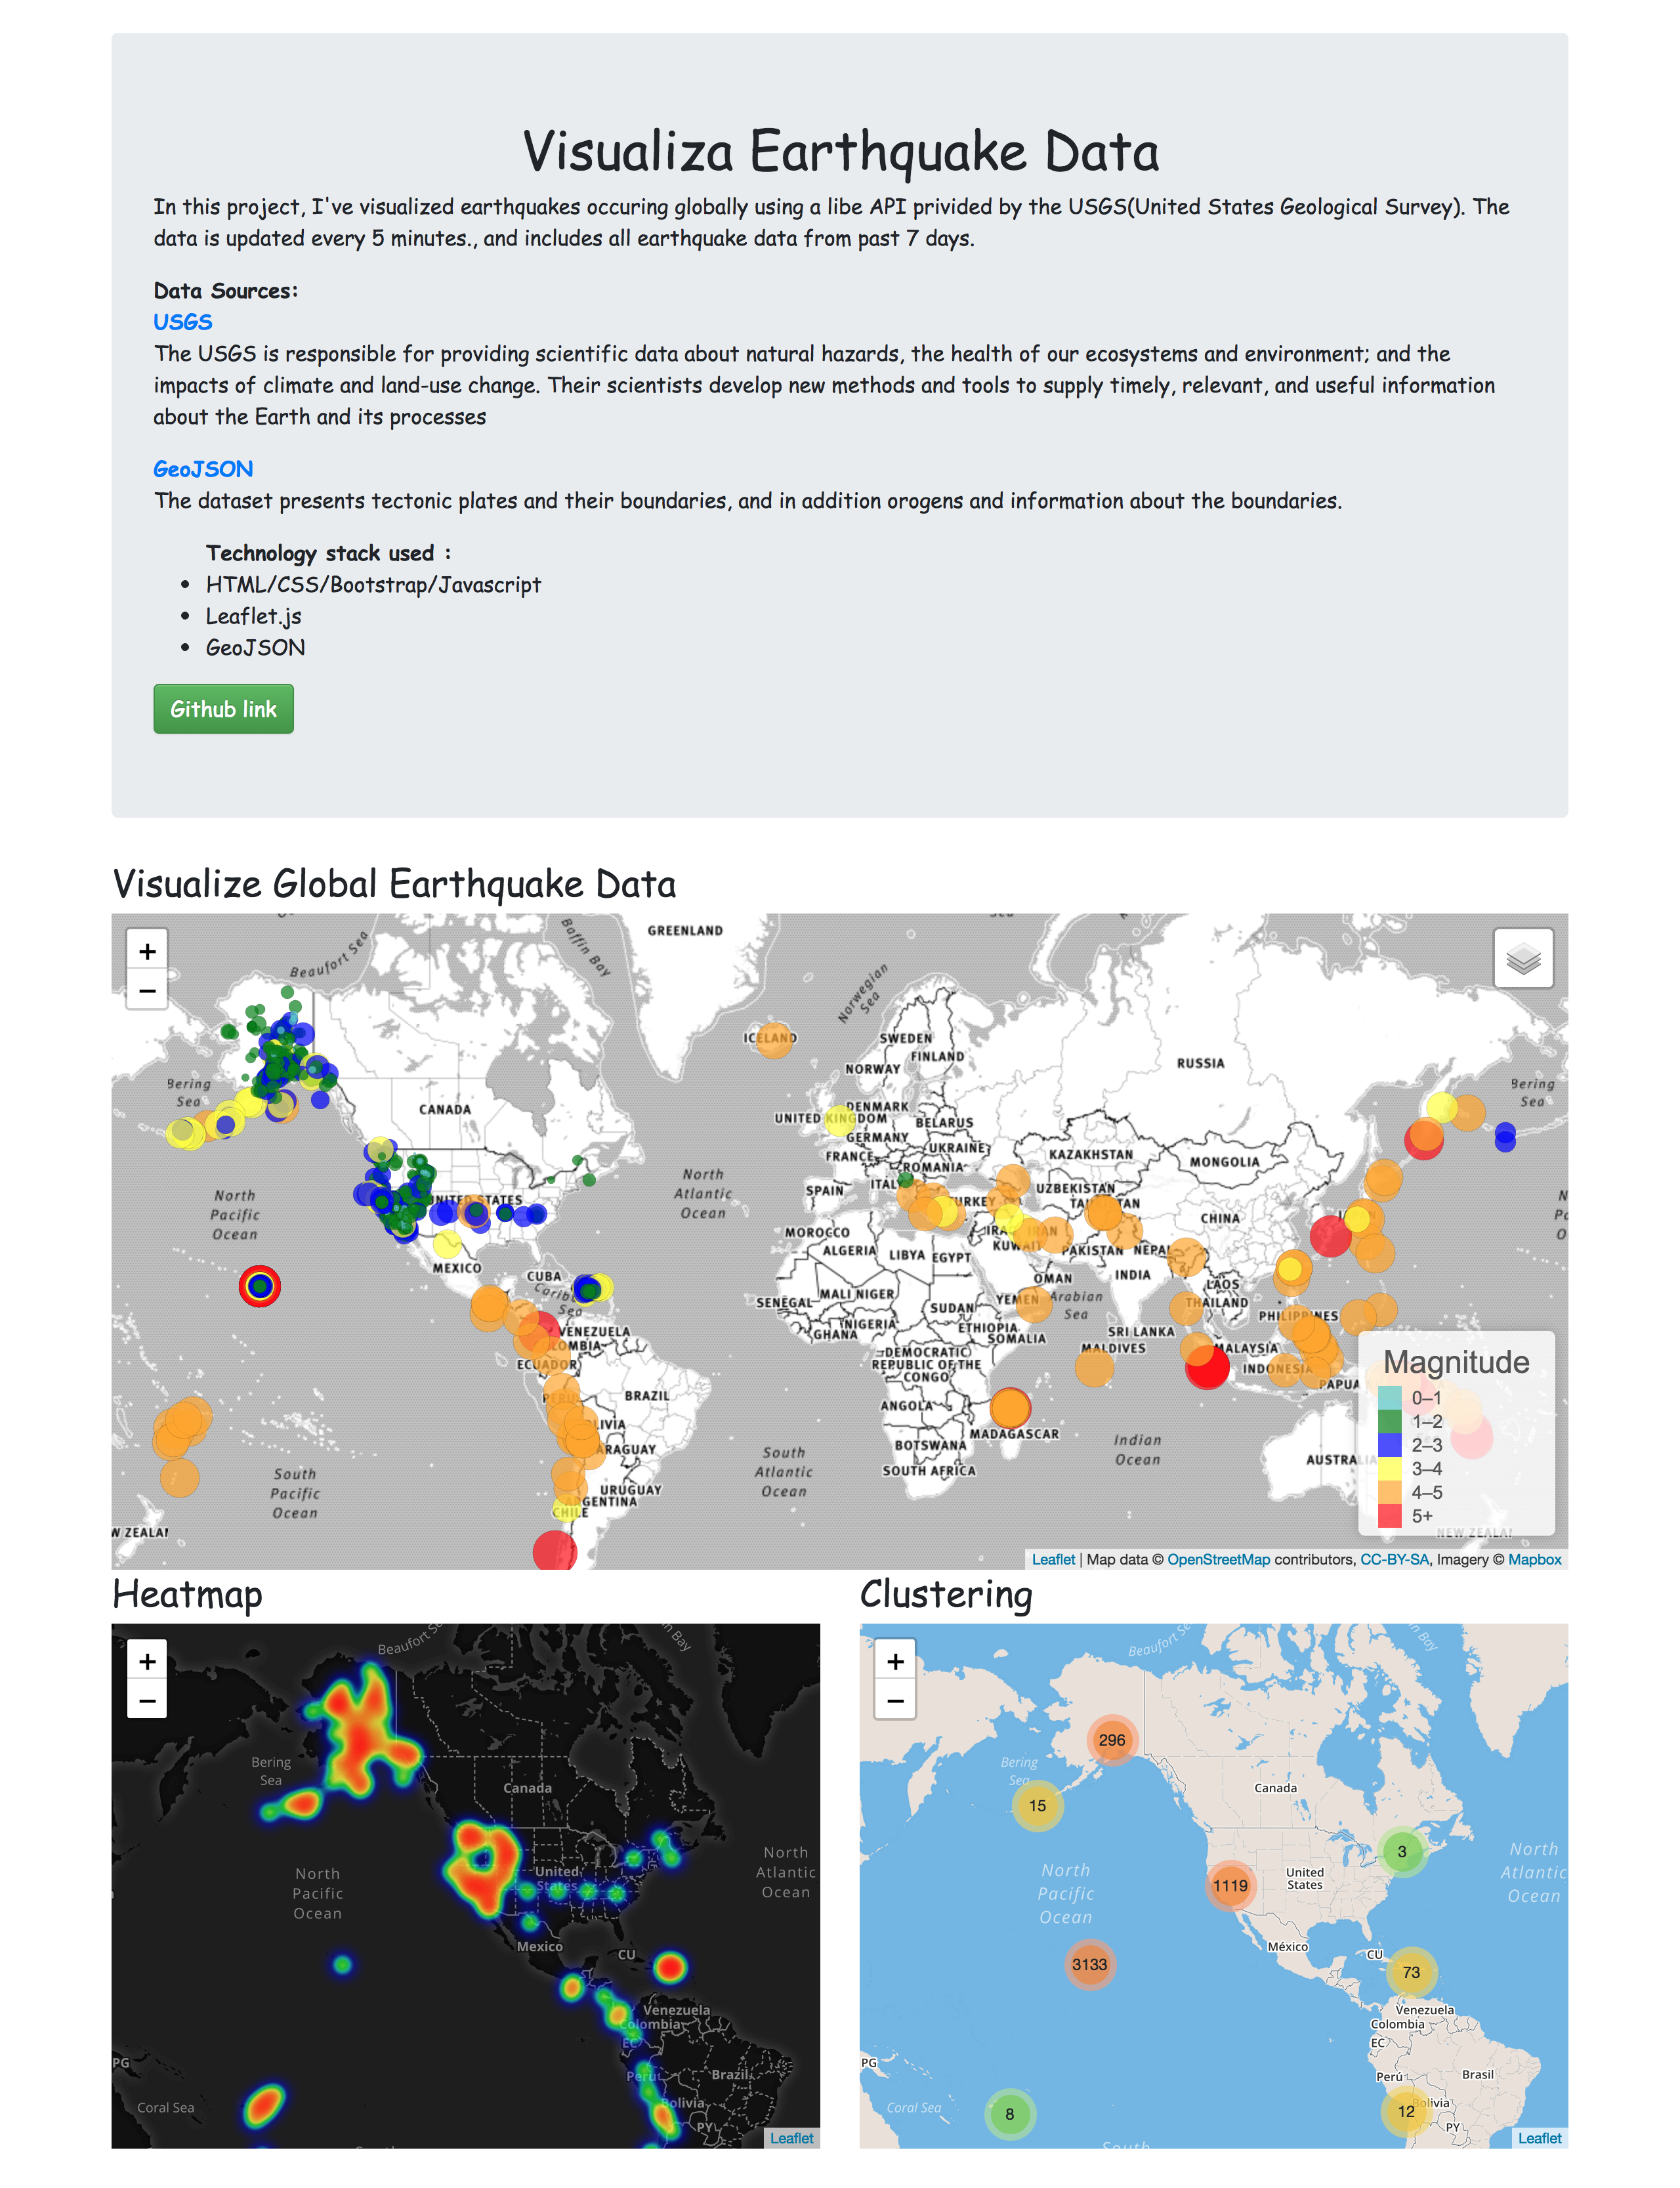
You can click here to access the web application.
Background • Data Sources • Technology Stack Used • User Interface
In this project, I've visualized earthquakes occuring globally using a libe API privided by the USGS(United States Geological Survey). The data is updated every 5 minutes., and includes all earthquake data from past 7 days.
- USGS
- The USGS is responsible for providing scientific data about natural hazards, the health of our ecosystems and environment; and the impacts of climate and land-use change. Their scientists develop new methods and tools to supply timely, relevant, and useful information about the Earth and its processes
- GeoJSON
- The dataset presents tectonic plates and their boundaries, and in addition orogens and information about the boundaries.
- HTML/CSS/Bootstrap/Javascript
- Leaflet.js
- GeoJSON
