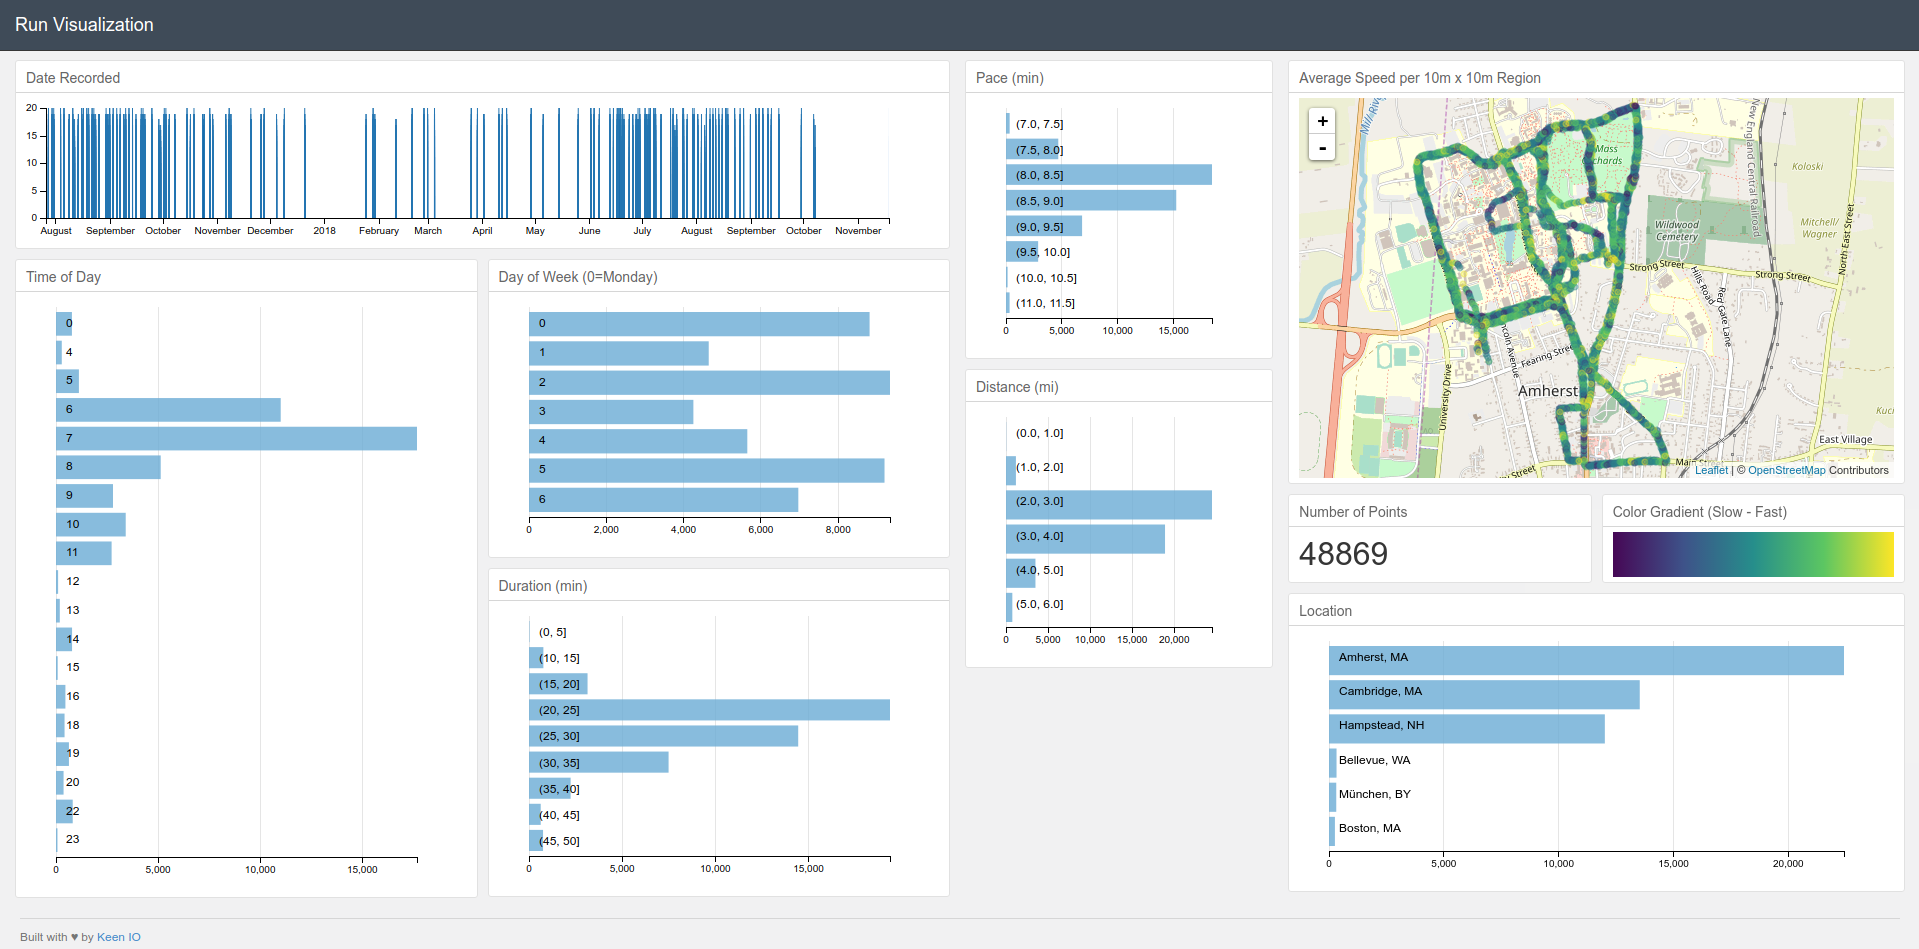
Inspiration for this visualization: Interactive Data Visualization of Geospatial Data using D3.js, DC.js, Leaflet.js and Python
I modified it to show my run habits. Here is my blog post that inspired me to make this: Becoming a Better Runner using Data
You need Python 2.7.x and 3 Python libraries: Pandas, Flask, Shapely.
The easiest way to install Pandas is to install it as part of the Anaconda distribution.
You can install Flask and Shapely using pip.
pip install flask shapely
- Install all Python dependencies
- Download your data from RunKeeper
- Save the dataset where you want and modify the path in
app.py - From the root folder, run
python app.py
