Ever since moving to Melbourne from New York, I have been keenly aware of the lack of good Mexican food in Australia. Overtime, this encouraged me to try and find the best Mexican food by webscraping Zomato.com for every review of Mexican restaurants in Melbourne that I could find.
In the end, I was able to scrape about 6,700 reviews. Unfortunately, I found that almost 3,500 reviews did not have numerical review scores. Instead, as a result of Zomato purchasing Urbanspoon.com in 2015, these review ratings consisted of a sentiment, positive or negative. Zomato encourages former Urbanspoon users to update their sentiment reviews to reflect a numerical score, but this doesn't appear to be happening.
While Zomato certainly utilises the data from the sentiment reviews already, the sentiment is not factored into a restaurant's rating. Given that over half of the reviews didn't have scores, this is substantial. Fortunately, there is an alternative: use machine learning techniques on the entries with numerical scores to predict review scores for the sentiment reviews.
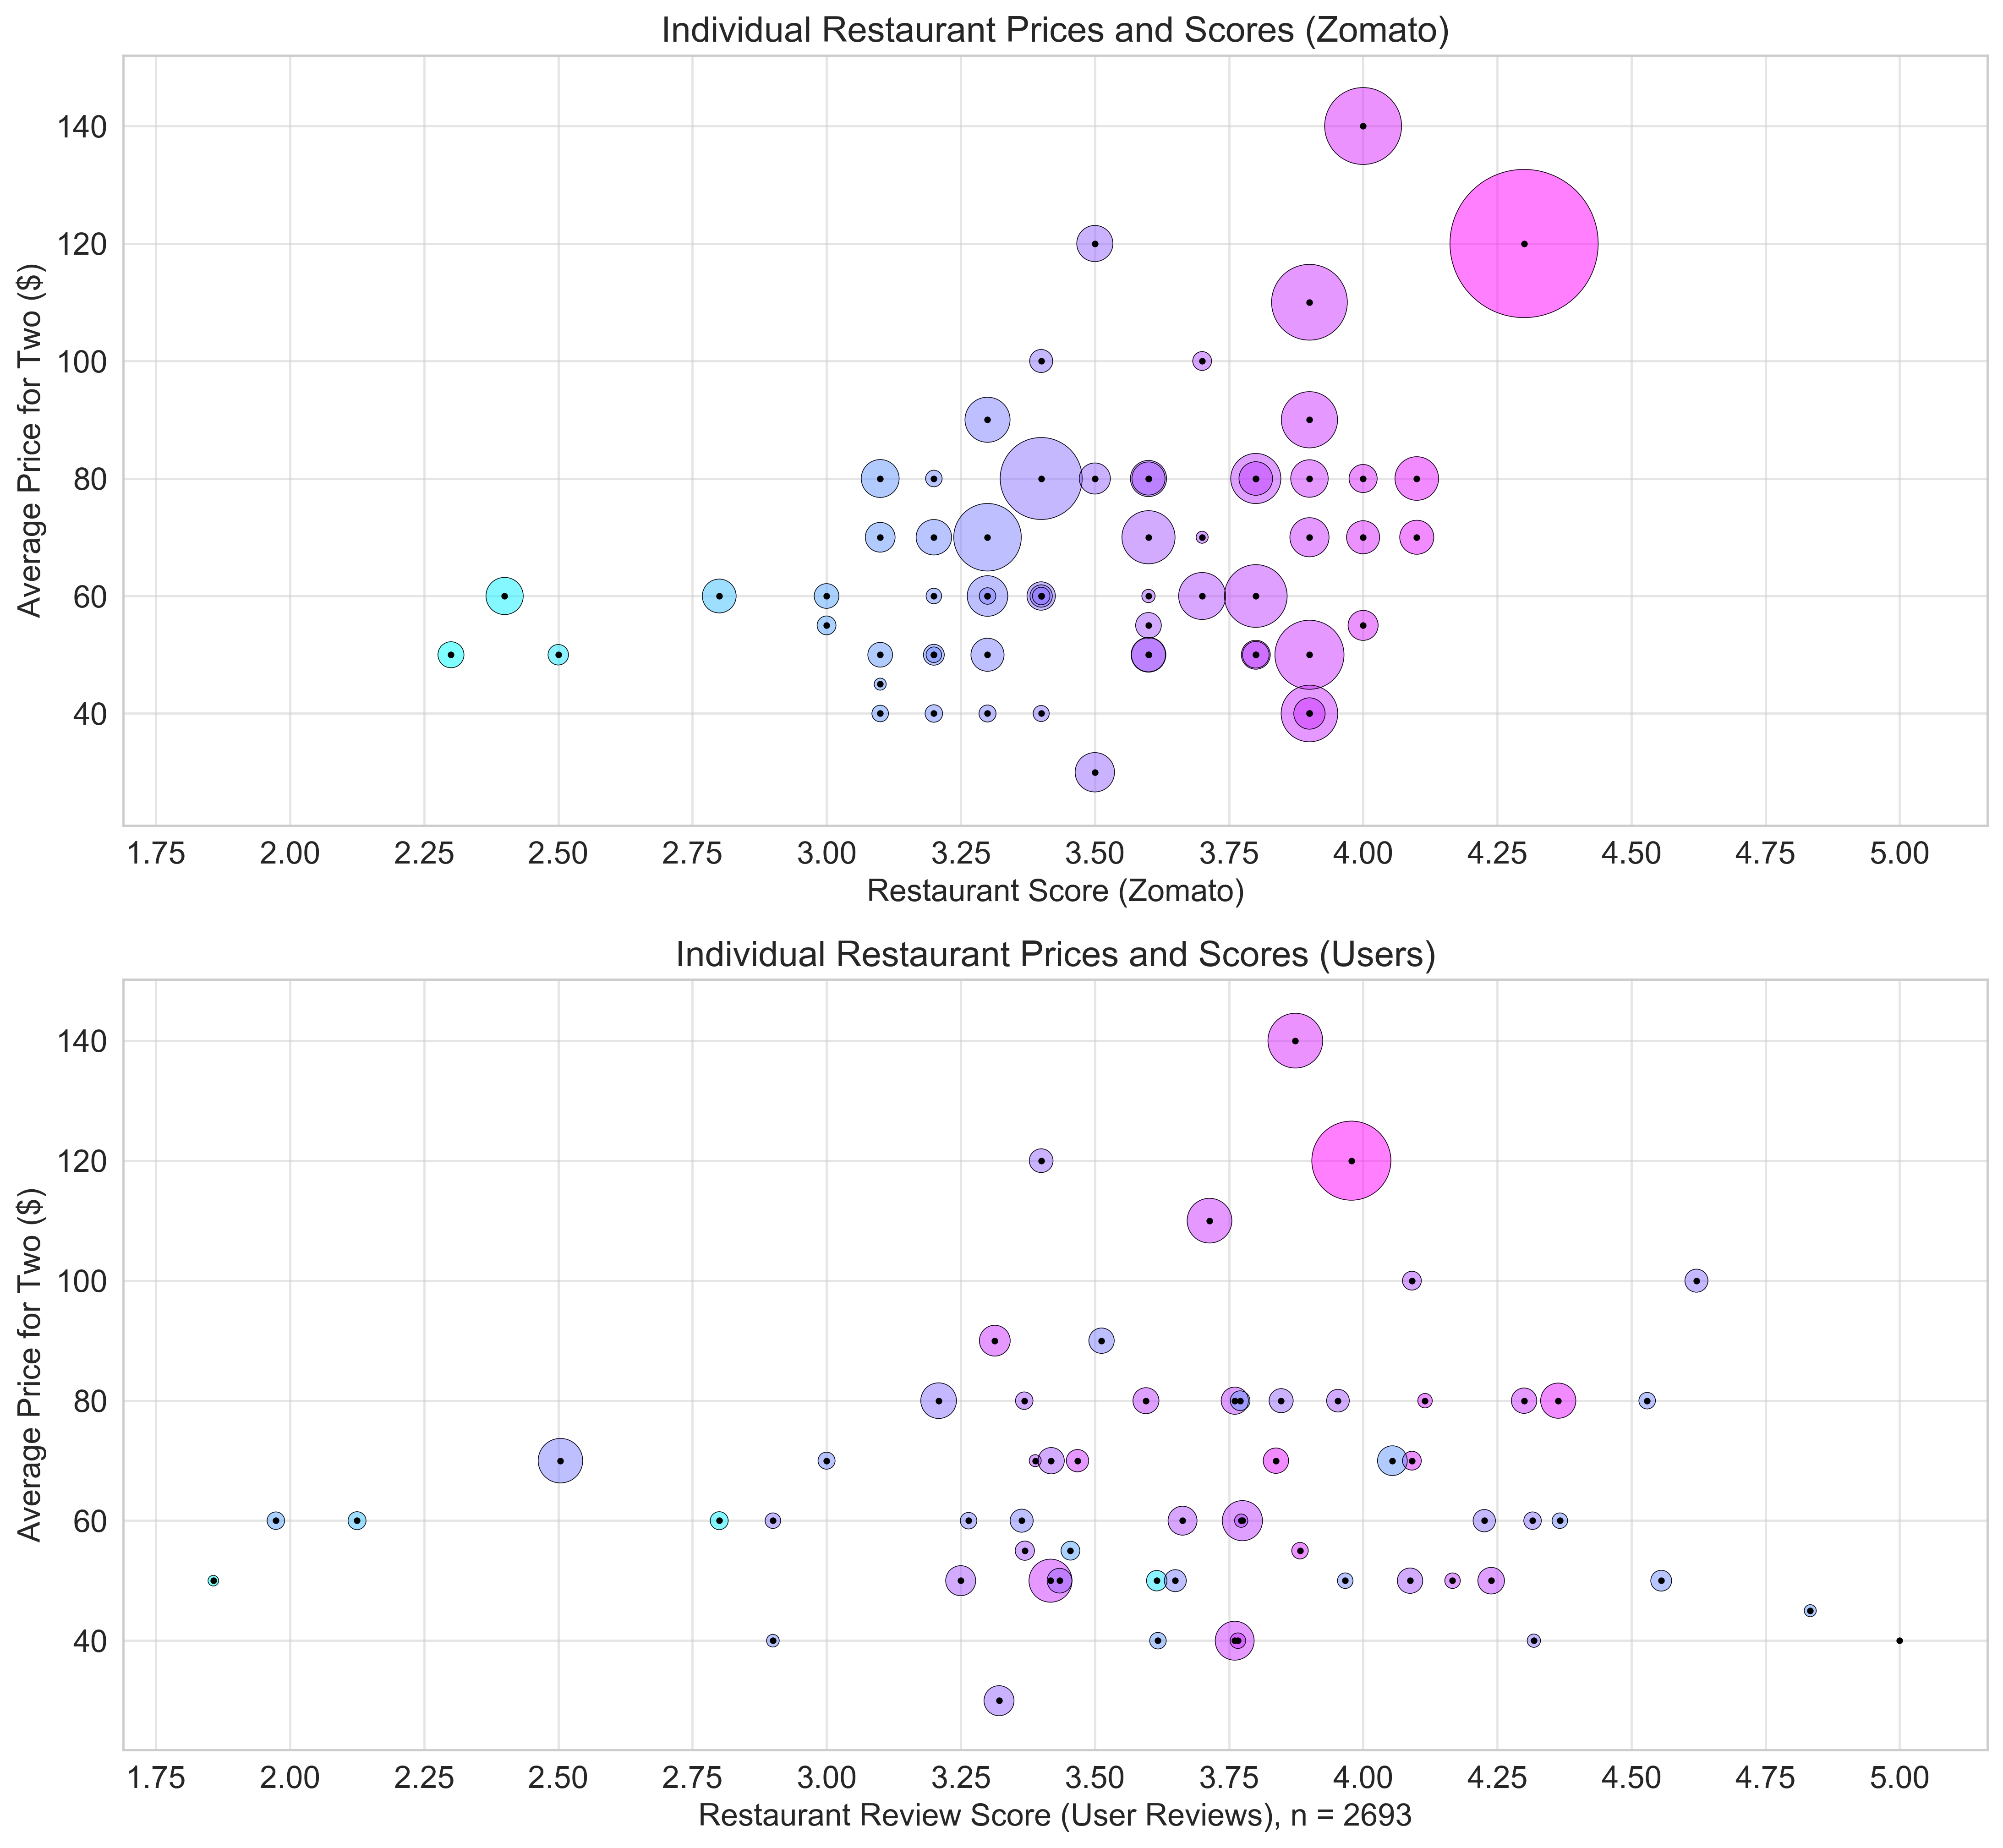
I began by using a bubble plot to examine the difference between a restaurant's score on Zomato, and the average of all review scores for a given restaurant.
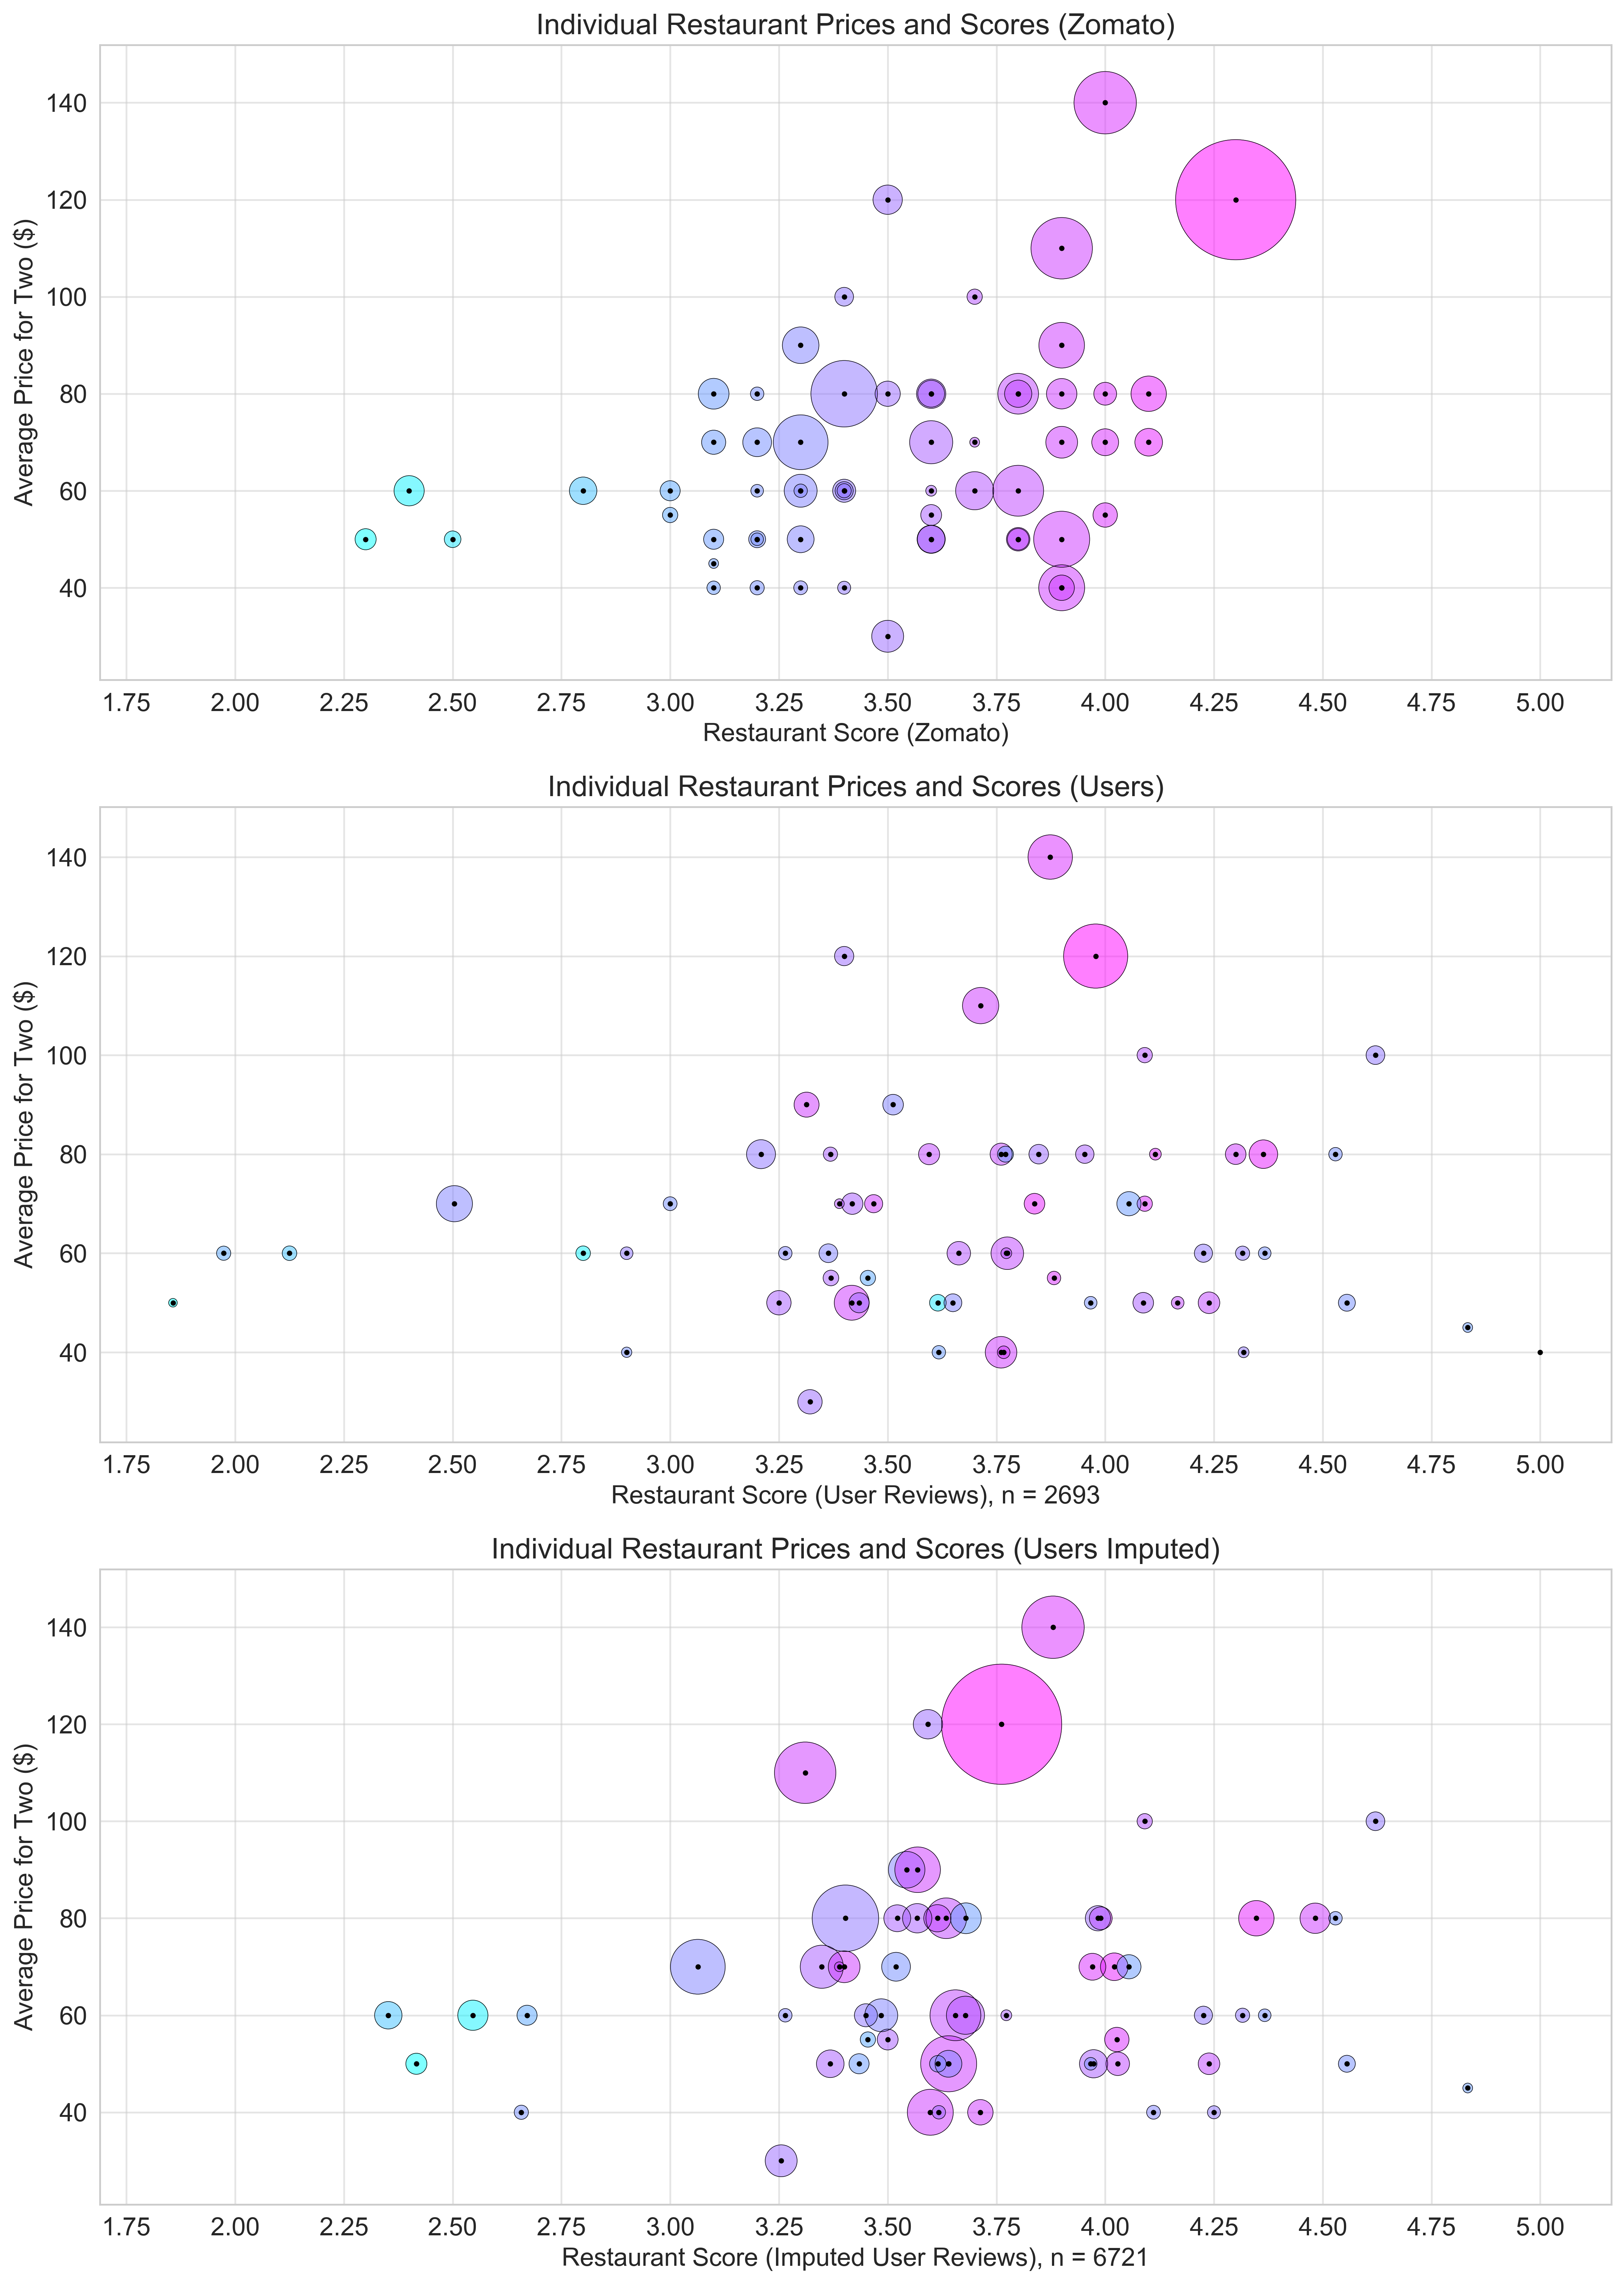
- Each 'bubble' is a restaurant, and the size of the bubbles is determined by how many reviews each restaurant has.
- The scores on the first plot corresponds to Zomato's score for the restaurant, and determines bubble size by counting all reviews (numerical and sentimental) for each restaurant.
- The scores on the second plot corresponds to the average of review scores for each restaurant, and determines bubble size by only counting the numerical reviews each restaurant had.
- The color of each bubble is consistent across plots and restaurants, and shows shifts in bubbles between the two plots.
Interestingly, the first plot (Zomato score) has a trend where higher ratings are generally associated with more expensive restaurants. Additionally, the colors show that some restaurants shift to a dramatically different score.
For this prediction of review score on the sentiment reviews to be reliable, I needed to build a good model using the 2,500 reviews that had numerical scores. The first thing I did was use spacey to analyze the review text I had. This created word type features, which kept track of proportions of each word type (noun, verb, adverb) for each review. I also used vader to analyze the sentiment of each review, which created positive, neutral, objective and compound features, and I used Scikit-Learn's Term-Frequency-Inverse-Document-Frequency (TFIDF) to create a sparse matrix of the top 2000 words from the review text.
Lastly, I trained a Logistic Regression model on the sentiment reviews and classified if a review is positive or negative. This model was highly accurate. The model had an r2 score of 0.95 (baseline 0.68), and misclassifyied sentiment on only 35 of 696 reviews (5.0%). Given the high accuracy I decided to use the model to impute sentiment on the 2,500 numerical score reviews as a feature.
With the features that the first model utilised (with the top 500 TFIDF features, instead of 2000), I trained a Random Forest Regression model that had an r2 score of 0.69. Using this model to impute numerical ratings on the sentiment reviews, I was able to generate the third plot in the below, which utilises the imputed review scores when calculating the new average review scores for each restaurant.
It is worth mentioning that several restaurants had all numerical reviews, and the corresponding bubble thefore did not move or increase in size between plots two and three. I think it would be interesting to see what happens to the distribution of bubbles in the first plot. if Zomato were to incorporate the imputed scores into the overall restaurant scores.

