BluePill is an open-source dynamic analysis framework for handling evasive malware. Its goal is to reconcile the transparency properties needed for automatic analyses with the fine-grained execution inspection and patching capabilities required for manual analysis.
BluePill is an academic prototype that we maintain in our spare time: your feedback is precious!
BluePill can counter many red pills targeting hypervisors, debuggers, third-party tools, and timing artifacts. It builds on dynamic binary instrumentation (DBI) to monitor queries that malware can make on the environment looking for artifacts, altering their results when they may reveal the presence of an automated analysis system or a human agent. BluePill offers a GDB remote interface to debug a sample while taking care of evasions of behalf of the analysts, along with a new stealth patching mechanisms to hide code changes made in the debugger from self-checksumming schemes.
We tested BluePill on heterogeneous PE32 Windows malware running on 32-bit Windows 7 SP1: as an example, we can run executables protected with recent versions of VMProtect and Themida and highly evasive samples like Furtim.
BluePill has been presented in:
- Black Hat Europe 2019. BluePill: Neutralizing Anti-Analysis Behavior in Malware Dissection. [link] [slides] [video]
- IEEE Transactions on Information Forensics and Security 2020. On the Dissection of Evasive Malware. [link] [preprint]
To counter DBI evasions, BluePill uses a library of mitigations that we wrote for Intel Pin as part of our paper SoK: Using Dynamic Binary Instrumentation for Security (And How You May Get Caught Red-Handed) from ASIACCS 2019. In BluePill, we extended the library with further mitigations for time overheads and red pills targeting the GDB remote debugging interface and exception handling. You can read more about DBI evasions in the paper Evaluating Dynamic Binary Instrumentation Systems for Conspicuous Features and Artifacts recently appeared in ACM DTRAP (preprint).
Below a partial list of the evasions BluePill countered in our tests on a Windows 7 SP1 32-bit VirtualBox 5.2 machine for a large deal of executable protectors and armored samples:
| Category | Instances |
|---|---|
| Hypervisor | Guest additions, files, registry entries, libraries, and drivers from VirtualBox |
| Hardware | BIOS and firmware strings, MAC address, cpuid, disk size, power/thermal capabilities |
| Time | Slowdown detection using rtdsc and Windows time-related APIs |
| Software | Artifacts of common monitoring tools (running processes, GUI windows), parent process, HKL keyboard layout, frozen mouse cursor |
| Debugging | Single-step exceptions, int 2d, OS queries for active/installed debuggers (e.g. NtQueryInformationProcess), Process Entry Block fields |
| WMI queries | CPU, disk size, MAC address, ACPI, MUI languages, VirtualBox VBOXVIDEO |
| DBI | Pointer leaks with FPU instructions, memory contents and permissions (e.g. guard pages, NX enforcing) |
NOTE: Before going public for BH Europe 2019, we made radical changes that broke the handling of 64-bit code and (to a small extent) of the WoW64 subsystem: please consider these scenarios experimental as we complete the regression testing, and feel free to report issues.
BluePill builds on Intel Pin (v3.16 recommended) and requires Visual Studio 2015 or higher for its compilation.
Pin has some dependencies that require manual inclusion in the project. We created a Locals.props file that simplifies the project configuration. Its defaults are Pin being installed in C:\Pin316 and the SDK 8.1 headers being in use:
  <PropertyGroup Label="UserMacros">
    <PinFolder>C:\Pin316</PinFolder>
    <WinHPath>C:/Program Files (x86)/Windows Kits/8.1/Include/um</WinHPath>
  </PropertyGroup>
For instance, if you wish to use the SDK 10.0.17763.0 headers, after modifying the Project settings in Visual Studio
you should also change the value of the WinHPath property to C:/Program Files/Windows Kits/10/Include/10.0.17763.0/um. Similary, modify the property value if your SDK 8.1 headers are installed in C:/Program Files/ instead of C:/Program Files (x86)/. The purpose of this field is to assist Pin when it includes the absolute path of Windows.h from its CRT headers.
You should now be able to compile BluePill. Once compilation ends, you will find a bluepill32.dll library in the Pin directory. If you encounter a missing msvc_compat.h error, make sure that $(PinFolder)\extras\crt\include is a valid path.
To run an executable under BluePill use:
C:\Pin316\pin.exe -t bluepill32.dll [options] -- <file.exe>
BluePill supports the following command-line options:
| Option | Meaning |
|---|---|
-evasions |
Detect and handle the majority of evasions supported (see below for DBI) |
-debugger |
Enable debugger mode via GDB remote interface |
-leak |
DBI evasions: fix leaks of real EIP (e.g. FPU instructions) |
-nx |
DBI evasions: check that code pages are executable |
-rw |
DBI evasions: hide pages that belong to the DBI engine |
For instance, to run an evasive program named sample.exe in a sandbox-like automatic mode try:
C:\Pin316\pin.exe -t bluepill32.dll -evasions -leak -- sample.exe
Enabling the -leak mitigation has minimal performance impact, while -nx and ultimately -rw can help with complex packers that attempt conformance checking on the address space of the program.
BluePill will create a file named evasions.log under Pin's folder C:\Pin316 (modify the LOGPATH variable inside pintool\src\logging.h to change it) that logs possible evasion attempts intercepted during the execution.
BluePill supports the use of a debugger to control the execution and carry out malware dissection. We rely on the GDB remote interface of Pin: BluePill can thus be used as a remote backend from your debugger tool if it supports the GDB protocol. In the following we provide instructions to set up a debugging session with IDA Pro.
To enable the debugger interface, you need to provide additional command-line options to both Pin (-appdebug -appdebug_server_port <port>) and BluePill (-debugger) as follows:
C:\Pin316\pin.exe -appdebug —appdebug_server_port 10000 -t bluepill32.dll -debugger [other options] -- <file.exe>
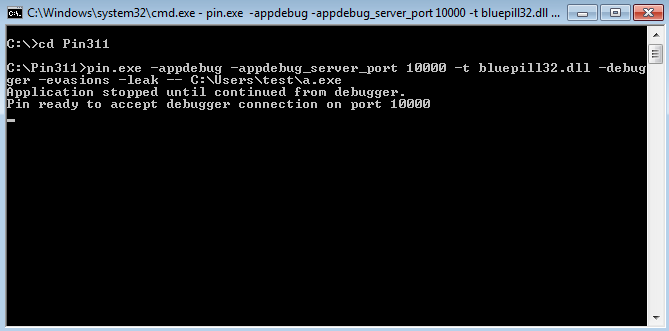
We will use 10000 as port number in this guide. The application will stay paused until you connect a debugger to the socket: however, if you try attaching a local debugger to the process, you will end up debugging the whole Pin engine instead of just the application. The expected output on screen will be something like:
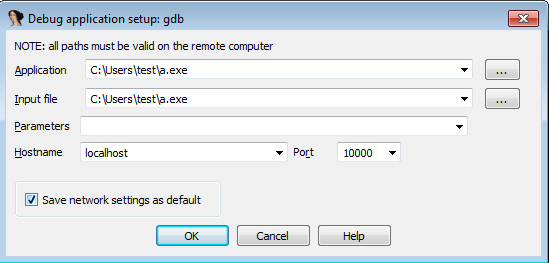
You can now open the executable in IDA and select the Remote GDB debugger backend from Debugger->Switch debugger. Check that the options (e.g. port number) are correct using Debugger->Process options like in the screenshot below:
At this point it helps to insert a breakpoint on some address in the main executable section, for instance on the entrypoint. Then you can start your debugging session with Debugger->Start process. IDA will notify you that "There is already a process being debugged by remote. Do you want to attach to it?". Just click Yes and the debugging session will start, with EIP being somewhere inside in ntdll.dll.
Since memory mapping information is not available by default over the GDB remote protocol, we added a custom debugger command vmmap that instructs BluePill to build such a map. We automated this process with a script addSegments.py available in the scripts/ folder: just load it in IDA with File->Script file. The script will populate the Segments subview of IDA with the memory layout information (i.e. sections and their permissions) for each code module. Note: we will soon add code to update the Module subview, which currently stays stale.
You can now debug your sample as BluePill shields you from a whole lot of evasions :-)
Please note that exception handling requires a workaround for the current GDB server support in Pin. When an exception should not be passed to the application (e.g., 0xc0000008 for an invalid handle passed to CloseHandle), send a wait command in the GDB console right after you receive the exception message, then disconnect and reconnect IDA to BluePill. In the meantime, the debugger helper will keep the executable on hold in response to the command.
NOTE: we originally relied on the disconnection trick also for other exception kinds. For them, newly introduced changes in some Pin release after the 3.5 one lead to an internal assertion failure when reattaching the debugger (A: source\pinvm\debugger-connection\debugger-connection.cpp: PINVM::DEBUGGER_CONNECTION::NotifyThreadsStopped: 1004: assertion failed: focus != PIN::INVALID_THREADID). Therefore, when you face e.g. a 0xc0000005 exception from an int 3 opcode or an int 2d evasion, you shoud pass the exception to the application. The debugger interface of Pin will not be detected directly, but the adversary may still do that by using a write watch. We are currently thinking of a workaround to shield such artifacts too.
BluePill implements a unique functionality to patch a code portion when debugging while hiding it from the executing code. An applied patch remains invisible to anti-tampering schemes (e.g. self-checksumming sequences) as it is tighly coupled with the JIT mechanism of Pin. In a nutshell, we redo the JIT compilation to add trampolines that override the compiled (original) instructions and go unnoticed by code protection mechanisms, as memory reads keep being redirected to the original program instructions.
The creation of a patch is divded into three steps:
- identifying the code portion you want to overwrite (start and end addresses);
- assembling a piece of code to execute instead of the one identified at the previous step;
- selecting the continuation address where to transfer execution once the patch has executed.
Consider the code block in the image below, and suppose we want to overwrite the mov ebp, esp instruction at address 0x771X37A5 with a mov eax, esp instruction (89 e0 in binary), and then make execution resume at address 0x771X37A8.
When BluePill is operating in debugger mode, we can instruct Pin for patches through a custom GDB command: set_<START_ADDR>_<END_ADDR>_<CONT_ADDR>_<PATCH_CODE_BYTES>, with addresses expressed as hex numbers and code patch bytes separated by a comma. For the example above we can use: set_771c37a6_771c37a6_771c37a8_89,e0.
Patches can then simply be removed using another custom GDB command: rm_<START_ADDR>_<END_ADDR>.
If you are using BluePill in an academic project or you believe it would fit some discussion section in your paper, we would be grateful if you could reference our work using the following BibTeX entry:
@ARTICLE{BluePill,
  author={D'Elia, Daniele Cono and Coppa, Emilio and Palmaro, Federico and Cavallaro, Lorenzo},
  journal={IEEE Transactions on Information Forensics and Security},
  title={On the Dissection of Evasive Malware},
  year={2020},
  volume={15},
  number={},
  pages={2750-2765},
  doi={10.1109/TIFS.2020.2976559}}


