![]()
This script will show weather data from openweathermap.org on an LED matrix using color gradients. Using a button you can switch between weather properties.
For this process to work, the script needs to do the following:
- For each pixel, determine its latitude and longitude. This is done by dividing the horizontal and vertical axes into sections and using the center point for each cell.
- For each pixel, determine whether it's inside the shape/polygon that should be displayed. This may be a country or any other region. Store the lookup in a file for faster loading times.
- On regular intervals, get weather data for the grid.
- To reduce the number of API calls, run an initial call for each 25 square degree (limitation of the API) square inside the area of interest. This will return all cities in that area.
- For each pixel, determine the closest city. If the distance is below a threshold, use that city's data. Otherwise, send an individual API request for the specific location.
- Display the weather information on the grid using the color gradient and a normalization step to map the value to the corresponding color.
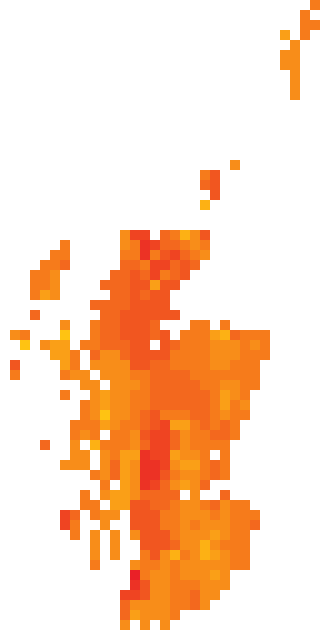
This approach allows the script to be run for arbitrary areas of interest. I'm using it to show weather data for Scotland, but by using a different shapefile and bounding box, any region can be used.
Keep in mind that the aspect ratio of the LED matrix will affect the area you can specify. I'm using a 1:2 aspect ratio panel, which is ideal for Scotland if you include Orkney and the Shetland Islands. Depending on your setup and configuration the result may look skewed/stretched/squeezed.
Saved as an image, the resulting image for Scotland may look like this:
I'm using the following hardware to run this setup:
- Raspberry Pi 3b+ and a Micro SD card of appropriate size. Other Pis can be used, but at least the Pi Zero was not powerful enough resulting in a lof of flickering.
- Adafruit RGB Matrix Bonnet for Raspberry Pi (https://shop.pimoroni.com/products/adafruit-rgb-matrix-bonnet-for-raspberry-pi)
- LED matrix panel 32x64 4mm pitch (https://shop.pimoroni.com/products/rgb-led-matrix-panel)
- 5V 4A power supply
- Squid Button - Non-Latching
- Soldering equipment to make hardware modification which reduces flickering (https://github.com/hzeller/rpi-rgb-led-matrix#improving-flicker)
- Install Raspberry Pi OS Lite on the SD card.
- Solder a connection between pin
4and18on the Adafruit Bonnet or HAT. This will enable PWM which reduces flickering. - Either directly solder the button cables to
GNDand pin15on the Adafruit Bonnet or HAT or solder break-away pins into those places and connect the button to them. - Connect the power supply (5V 4A) to the Bonnet/HAT. The Pi will be powered through this as well, so no need for a dedicated power supply for the Pi itself.
To use this script, there are a few Python packages that need to be installed as well as the library that talks to the LED matrix.
According to the maintainer, the latter needs to be run as root to ensure best performance. To make sure that all Python packages I'm using are available to the root user, I used a virtual environment for the setup.
# Update the pi and install some python packages
sudo apt-get update
sudo apt-get upgrade
sudo apt-get install -y git python3-dev python3-pillow python3-venv

# Create a virtual environment
python3 -m venv env

# Activate it
source env/bin/activate

# Install python packages
python3 -m pip install colour
python3 -m pip install shapely
python3 -m pip install fiona
python3 -m pip install requests
python3 -m pip install numpy
python3 -m pip install Pillow
python3 -m pip install gpiozero
python3 -m pip install RPi.GPIO

# Get the LED matrix library
git clone https://github.com/hzeller/rpi-rgb-led-matrix.git
cd rpi-rgb-led-matrix/bindings/python/

# Build and install it
make build-python PYTHON=$(which python3)
sudo make install-python PYTHON=$(which python3)

# Go back home
cd ~

# Clone this repository
git clone https://github.com/sebastian-raubach/rpi-led-weather.git

# Copy the smallest font from the led matrix library into this repo.
cp rpi-rgb-led-matrix/fonts/4x6.bdf rpi-led-weather/4x6.bdf

# Create a logs folder
mkdir logs

# Create a cron job (as root) that runs after reboot
sudo crontab -e

# Paste this into crontab
@reboot sleep 60 && /home/pi/env/bin/python3 /home/pi/rpi-led-weather/led-weather-matrix.py > /home/pi/logs/weather-`date +\%Y-\%m-\%d_\%H-\%M-\%S`.log 2>&1
To run this script, you will need the following:
- A free account with openweathermap.org
- An API key from openweathermap.org
- Coordinates of the bottom-left and top-right corner of your area of interest.
- A shapefile that contains the boundaries of your area of interest. This is used to determine which areas of the LED matrix remain black and which ones we need to get weather data for. This shape file should only contain one multi-polygon layer. Examples are available here: http://www.diva-gis.org/gdata
- When you change the shapefile you're using or adjust the bounding box parameters (see below), please delete the
grid-lookup.txtfile and restart the script.
- When you change the shapefile you're using or adjust the bounding box parameters (see below), please delete the
Rename config.template.txt to config.txt.
Configure it like this:
[weather-led-matrix]
api_key = <Your API key from openweathermap.org>
cols = <Number of columns on the LED panel; 64 in my case>
rows = <Number of rows on the LED panel; 32 in my case>
color_count = <Number of colors to generate in all colour gradients>

shape_file = <Shapefile for your area of interest>

turn_off_delay = <How many seconds to wait before switching off the display?>

lat_south = <Latitude of the bottom-left corner of the area of interest>
lat_north = <Latitude of the north-east corner of the area of interest>
lon_west = <Longitude of the bottom-left corner of the area of interest>
lon_east = <Longitude of the north-east corner of the area of interest>

min_temp = <Optional parameter used for scaling of the temperature display>
max_temp = <Optional parameter used for scaling of the temperature display>
If min_temp and max_temp are set, the script will use those to calculate the color for each grid cell, rather than the current min and max temperature.
This has the advantage that you can immediately tell if it's a hotter or colder day based on the overall colors, but you lose distinction between the colors as on most days only a smaller section of the overall colour range will be used.
Please note that the first run with take significantly longer to show the result, due to the necessity to generate the lookup grid. Following runs will be faster. This step is also quite CPU intensive, so you may see some flickering. Wait until the actual weather data shows up to judge whether flickering is an issue.
I have some intention to add very specific features to this based on my requirements. So things that are likely to be added in the future are:
- LED brightness adjustment based on time of day.
This script has entirely been cobbled together by a person with little experience in Python. I was learning Python basics as I went, so I'm pretty sure some people will facepalm hard when they see the code. But, hey, it's working. I'm sure there are plenty of things that can be improved and I'm happy to receive pull requests.
Please be aware that I am not planning to actively support this repository. I'll incorporate pull requests if they're aligned with what I have in mind for this tool, but I won't be adding new features based on issues as I simply do not have the time.
Here is a list of issues you may run into:
- The code is optimized for a 32x64 LED matrix. The main display will work fine on other sizes, but the loading screen and the min/max display in the top-left corner might look out of place on other sizes.
- The min/max display is currently displayed in the top-left corner. This works well for Scotland, but may be an issue for your region. I may make the location configurable in the future.
- I'm using the LED matrix in portrait mode. To do this (and make use of the font capabilities of the led matrix library), I had to rotate the matrix inside the python code using the led matrix library. If you need landscape format, play around with the rotation. You may also have to swap the row/column counts.
- If you're not using a button to switch between the weather parameters, you'll need to find another way of switching between them. Maybe an API endpoint or a timer that changes them?
- All values are shown in metric units. If you prefer imperial or whatever else, I'm afraid you'll have to adjust the script.
If you like this tool and would like to buy me a coffee, GitHub sponsors are set up for this repository.