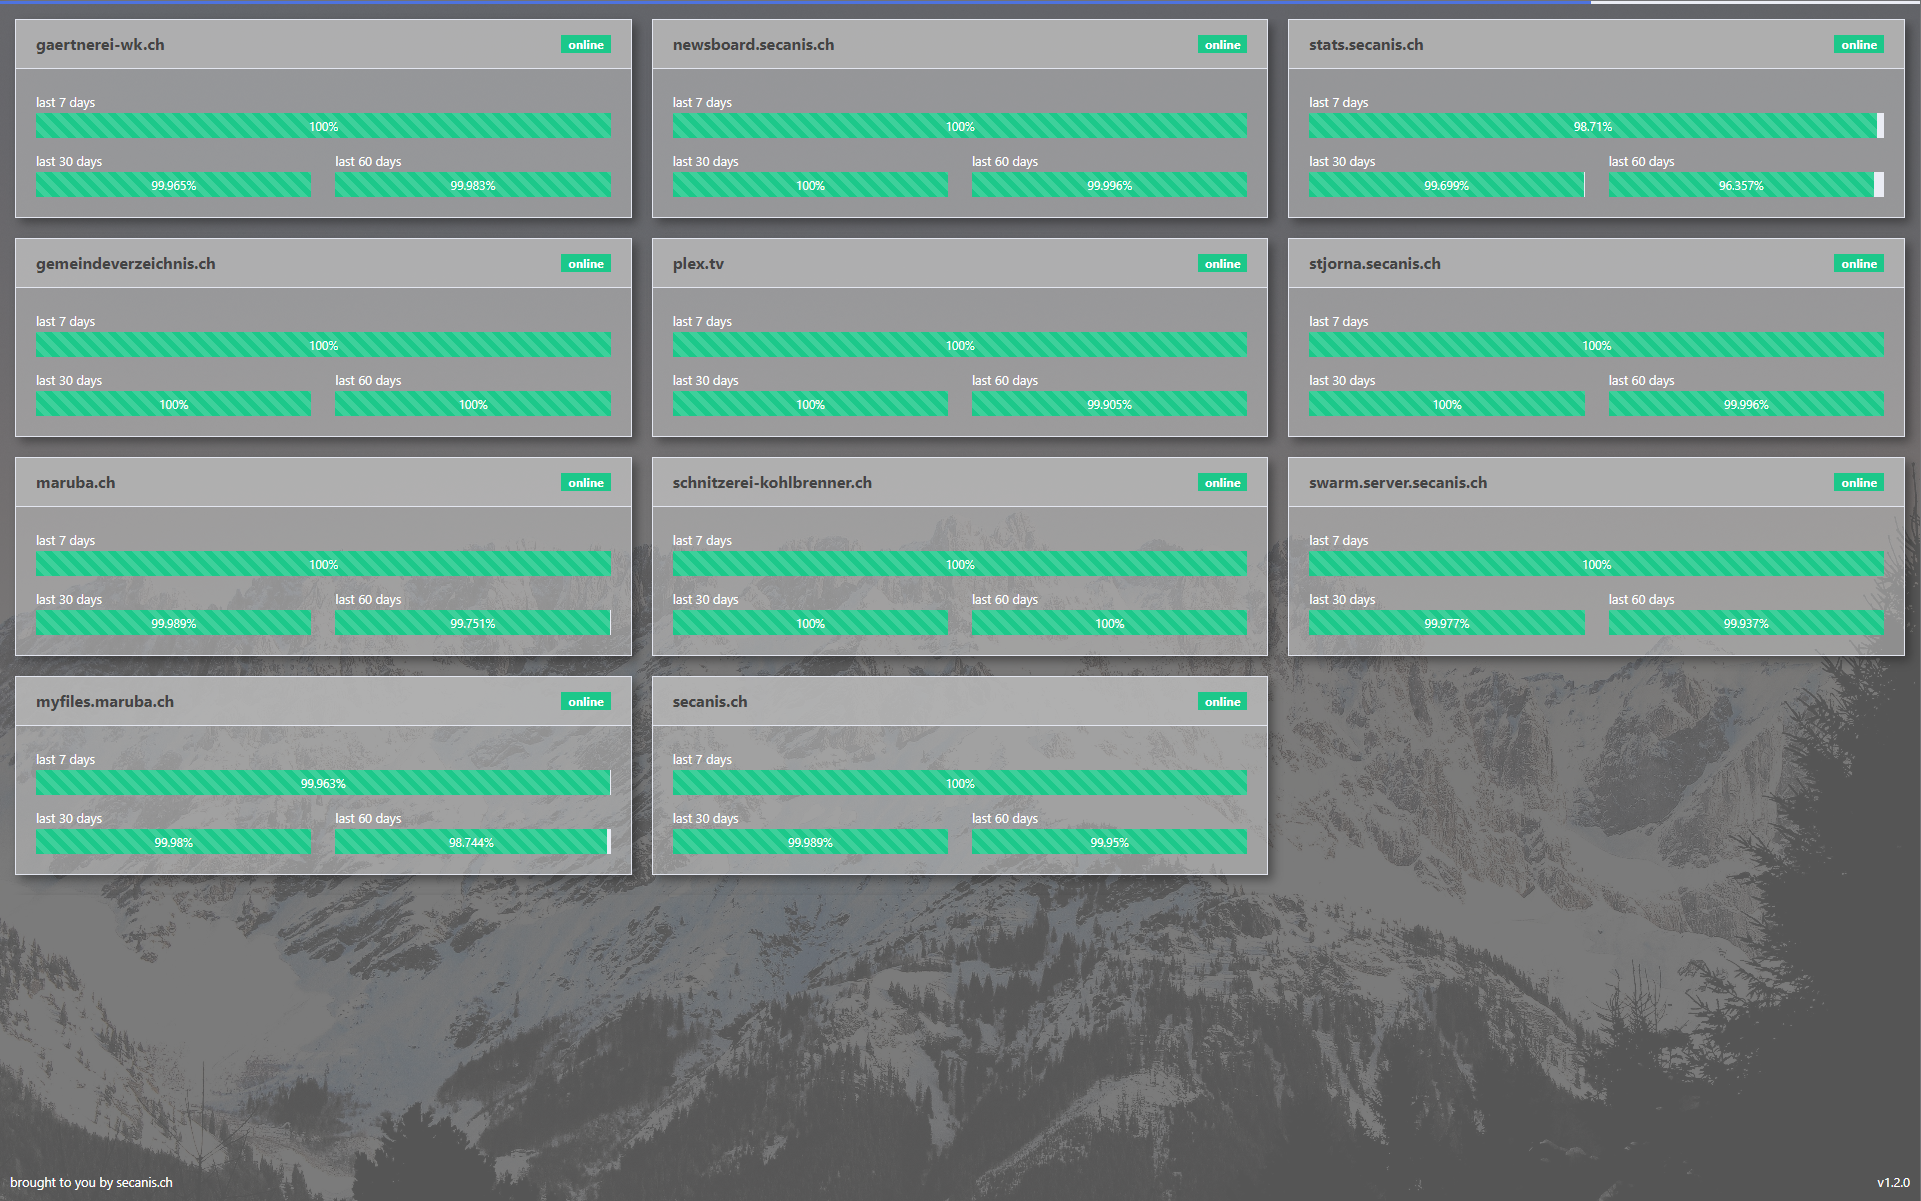
This dashboard was created based on the Uptime Robot Service. You can create there an account for free and access on the the data by the REST API.
This project uses the Balena Cloud to deploy this stuff on a raspberry. But you can also use the app-part standalone as a normal Node application.
- Uptime Robot Account
- Balena Account
- HDMI Display & Cables
- Supported RaspberryPi
cd app
npm install
npm start
// > app is served on http://localhost:3000
You can use for example a config file. The file should be named config.js and has to be in the root folder, near the server.js.
This config file is read at server startup.
module.exports = {
    initialize: () => {
        process.env.UPTIME_ROBOT_API_KEY = '{insert your uptime robot api key here...}';
    },
    isProduction: () => {
        return process.env.NODE_ENV === 'production';
    }
};
As soon you have deployed the application you will see the dashboard on the connected screen. The application will refresh (poll) the available Uptime Robots data regularly and will refresh the UI.
If you wanna use the hole Balena setup you can setup a development application for free on http://balena-cloud.com. After that you can setup your first Raspberry, following the guide on Balena. After that you can clone this repository and add the remote repository which is noted on the top right in the Balena Cloud Dashboard.
As soon you have added the Balena remote repo you can push this/your project to Balena:
git push balena master --force
The project and the Docker containeres will be built and automatically deployed your connected Raspberry.
For working properly you have to set the following two ENV variables on the Balena Cloud Dashboard:
| Variable | Example Value | Description |
|---|---|---|
| NODE_ENV | production | Sets the Node Environment to production, this is recommended |
| UPTIME_ROBOT_API_KEY | Get your Uptime Robot API key from their dashboard and enter it here, so that the dashboard can access your statistics |
I set the Define device GPU memory in megabytes config in the Balena Cloud UI to 128MB to increase GPU performance.
For the dashboard:

