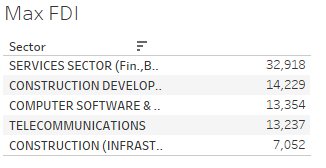
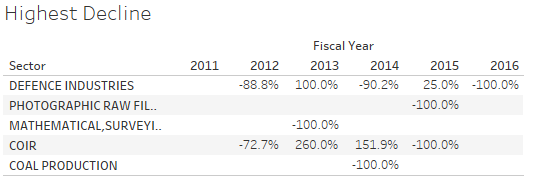
Using Tableau Public to identify viable investment options. See the visuals here.
Data range 2000-2016 on sectors and direct investment vaules.
You will be able to toggle through the industries here.
See the image Overall Trends.
See the image Variation.
You will be able to toggle through the industries here.
See the image Proportion of FDI.
See the image Clusters.
You will be able to toggle through the industries here.
See the image Forcasting.
Businesses who are looking to expand thier reach for products or that are wanting to diversify their assets look to make strong investments. Understanding the value of your future investment is key to making an educated decison on which baskets to lay your eggs. Comparing past, static and future predictions is can help you to weigh the opportunity cost of each investment as well as speculate reasons for volume changes in sector investment.


