Live profiler is a system-wide performance monitoring system in use at Badoo that is built on top of XHProf or its forks (Uprofiler or Tideways). Live Profiler continually gathers function-level profiler data from production tier by running a sample of page requests under XHProf.
Live profiler UI aggregates the profile data corresponding to individual requests by various dimensions such a time, memory usage, and can help answer a variety of questions such as: What is the function-level profile for a specific page? How expensive is function "foo" across all pages, or on a specific page? What functions regressed most in the last day/week/month? What is the historical trend for execution time of a page/function? and so on.
- PHP version 7.0 or later to use web interface and run aggregation scripts.
- PHP version 5.4 or later / hhvm version 3.25.0 or later to collect profiles using Live Profiler
- Connection to database with profiling result. You can collect profiles using Live Profiler tool
- Database extension (mysqli, pgsql, sqlite support included)
- Perl for flame graph functionality
- Get stats of average value, minimum, maximum, 95 percentile of execution time, cpu time, memory usage and calls count. Parameter list and statistics functions are configurable.
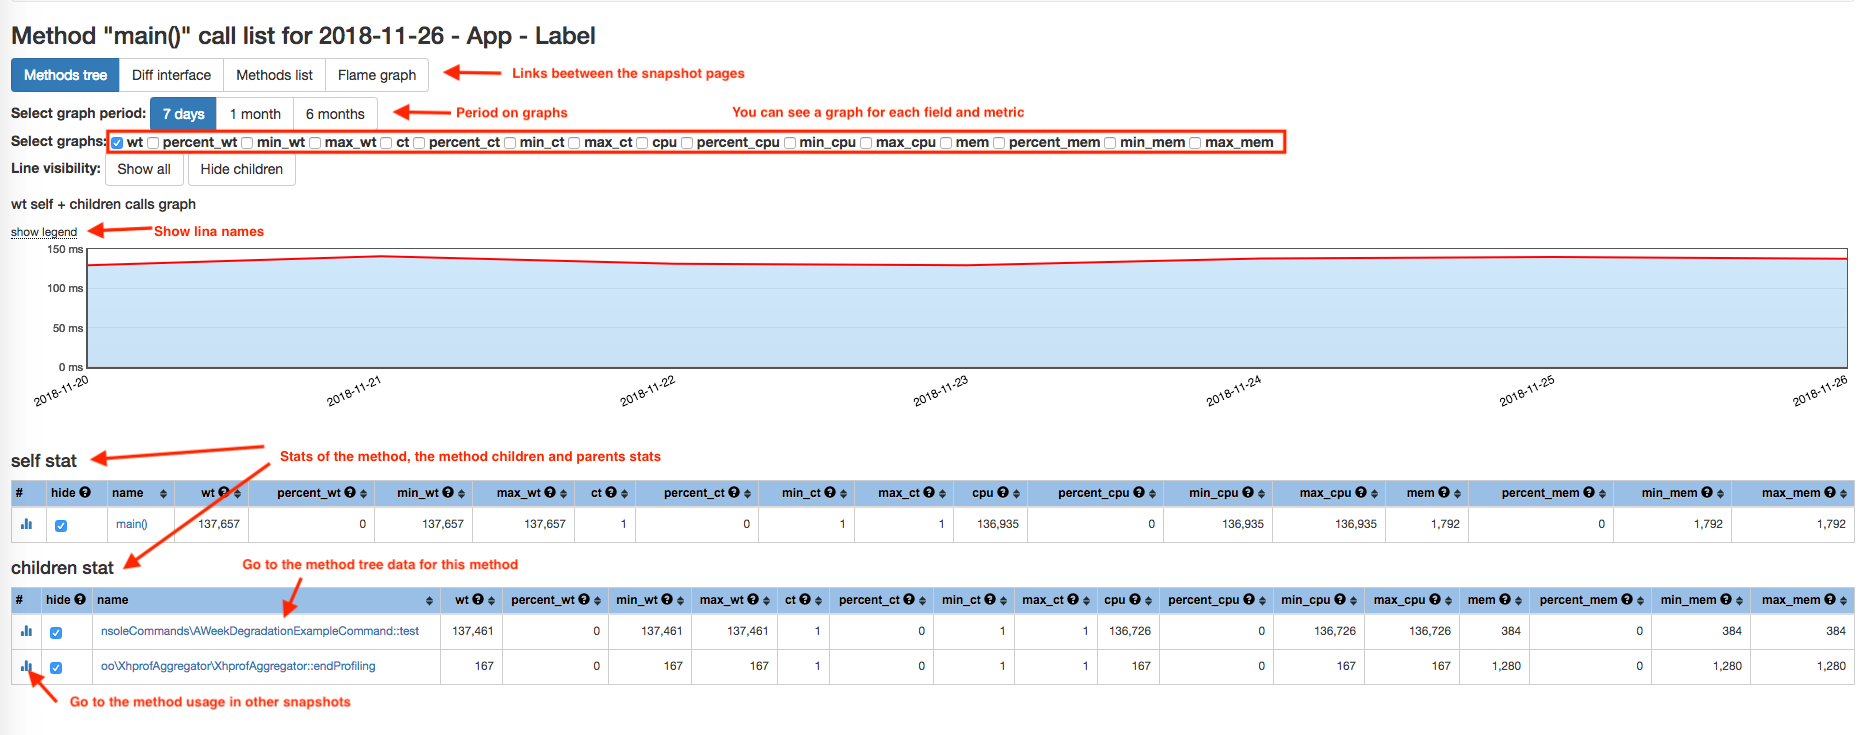
- Graphs for every collected parameter and every method up to 6 months. Each graph also includes children stats. It helps to see the history of changes.
- Differences interface to compare a particular request for two dates and see what became worse.
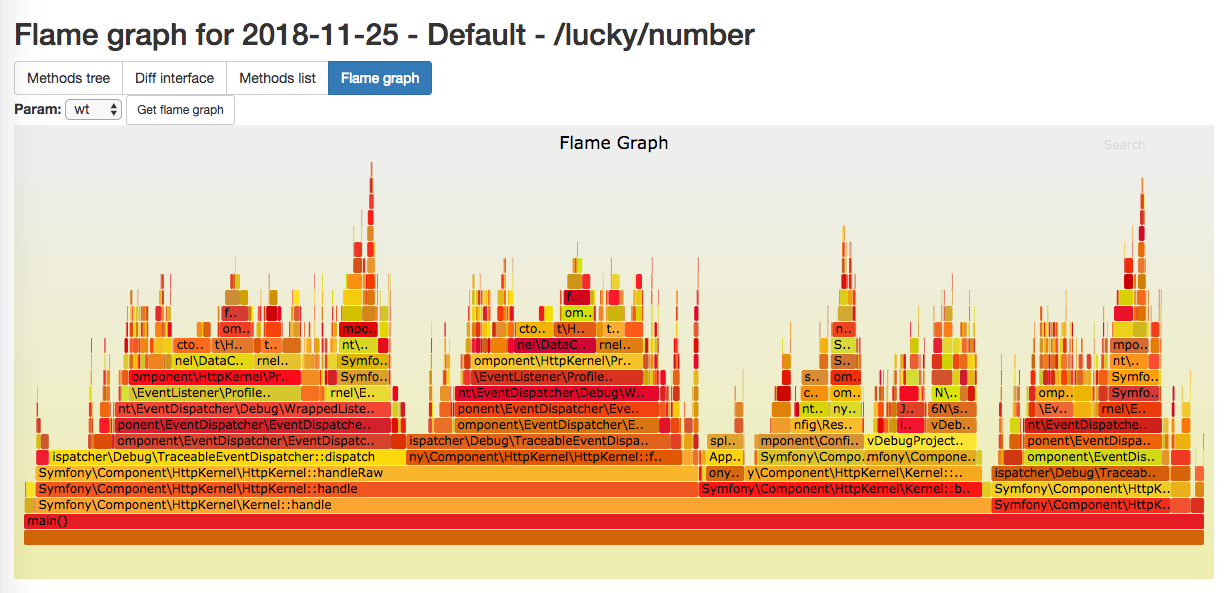
- See flame graph of the aggregated request.
- Get list of requests where a method was called last time. It may be helpful for refactoring purposes and find unused methods.
- Get the most changed methods in any requests for two dates, for example, today and a week ago. It can help to find a place of a potential performance problem.
- Clone git repository:
git clone https://github.com/badoo/liveprof-ui.git-
Change parameters in the file src/config/services.yaml, set database connection settings. By default profiles and aggregation data saves in the sqlite database. Notice: source_storage.url should be the same as the connection url in Live Profiler tool
-
Run docker containers:
docker-compose up webYou can also add db_mysql or db_pgsql containers if you want to use included mysql or postgresql container as a storage.
- Run a script to install composer dependencies and prepare database:
docker-compose exec web bash install.sh- Add cron jobs:
# script processes aggregation jobs, add it if you use a queue for aggregation jobs (parameter aggregator.use_jobs_in_aggregation=true)
* * * * * docker-compose -f %PATH_TO_PROJECT%/docker-compose.yml run --rm  --entrypoint '/usr/local/bin/php /app/bin/cli.php cron:process-aggregating-jobs' web
# script creates jobs to aggregate all profiles for previous day, add it if you use a queue for aggregation jobs (parameter aggregator.use_jobs_in_aggregation=true)
0 2 * * * docker-compose -f %PATH_TO_PROJECT%/docker-compose.yml run --rm  --entrypoint '/usr/local/bin/php /app/bin/cli.php cron:create-aggregating-jobs' web
# script aggregates all profiles for previous day, add it if you don't use a queue for aggregation jobs (parameter aggregator.use_jobs_in_aggregation=false)
0 2 * * * docker-compose -f %PATH_TO_PROJECT%/docker-compose.yml run --rm  --entrypoint '/usr/local/bin/php /app/bin/cli.php cron:aggregate-all-profiles' web
# script removes old aggregated data, by default > 200 days
0 1 * * * docker-compose -f %PATH_TO_PROJECT%/docker-compose.yml run --rm --entrypoint '/usr/local/bin/php /app/bin/cli.php cron:remove-old-profiles' web- Run a testing script to get aggregated data for demo:
docker-compose exec web php /app/bin/cli.php example:a-week-degradation - Web interface is available here http://127.0.0.1:8000/
- Clone git repository:
git clone https://github.com/badoo/liveprof-ui.git- Copy config to avoid problems on future update:
cp src/config/services.yaml src/config/aggregator_services.yaml- Change parameters in the config file (see "Configuration"), set database connection settings.
- Run a script to install composer dependencies and prepare database:
AGGREGATOR_CONFIG_PATH=src/config/aggregator_services.yaml bash install.sh - Run php built-in server to see the profiling result:
AGGREGATOR_CONFIG_PATH=src/config/aggregator_services.yaml php -S 0.0.0.0:8000 -t src/www/ src/www/router.php - Add scripts in the cron:
# script processes aggregation jobs, add it if you use a queue for aggregation jobs (parameter aggregator.use_jobs_in_aggregation=true)
* * * * * AGGREGATOR_CONFIG_PATH=%PATH_TO_CONFIG% /usr/local/bin/php %PATH_TO_PROJECT%/bin/cli.php cron:process-aggregating-jobs >> /var/log/cron.log 2>&1
# script creates jobs to aggregate all profiles for previous day, add it if you use a queue for aggregation jobs (parameter aggregator.use_jobs_in_aggregation=true)
0 2 * * * AGGREGATOR_CONFIG_PATH=%PATH_TO_CONFIG% /usr/local/bin/php %PATH_TO_PROJECT%/bin/cli.php cron:create-aggregating-jobs >> /var/log/cron.log 2>&1
# script aggregates all profiles for previous day, add it if you don't use a queue for aggregation jobs (parameter aggregator.use_jobs_in_aggregation=false)
0 2 * * * AGGREGATOR_CONFIG_PATH=%PATH_TO_CONFIG% /usr/local/bin/php %PATH_TO_PROJECT%/bin/cli.php cron:aggregate-all-profiles >> /var/log/cron.log 2>&1
# script removes old aggregated data, by default > 200 days
0 1 * * * AGGREGATOR_CONFIG_PATH=%PATH_TO_CONFIG% /usr/local/bin/php %PATH_TO_PROJECT%/bin/cli.php cron:remove-old-profiles >> /var/log/cron.log 2>&1All configuration options place in the src/config/services.yaml file. You can redefine the file to set an environment variable AGGREGATOR_CONFIG_PATH. The file contains main parameters and services.
Parameters:
- aggregator.default_app - the default app name using in aggregator by default, by default - Default
- aggregator.use_jobs_in_aggregation - use db queue for aggregation, by default - false
- aggregator.fields - a field map to aggregate from profiler, KEY - the name in profiler, VALUE - the name in aggregator, by default - [wt,ct,cpu,mu: mem]
- aggregator.calls_count_field - the field responses for calls count in this context, uses for some stats, by default - ct
- aggregator.field_variations - a list of functions to calculate stats, by default - [percent,min,max]
- aggregator.use_layout - use can switch off html layout to use custom one, by default - true
- aggregator.fields_descriptions - field descriptions using in the web interface
- aggregator.log_file - use a custom log file, by default live.profiler.ui.log in working directory
- source_storage.url - a connecting string for for profiler data storage, in the example config, you can see connecting strings for sqlite, mysqli, pdo_mysql, pdo_pgsql drivers
- aggregator_storage.url - a connecting string for for aggregator data storage, in the example config, you can see connecting strings for sqlite, mysqli, pdo_mysql, pdo_pgsql drivers
Services: You can use your own class for each service, just inherit the class or implement needed interface.
- logger - a service for logging implemented psr-3
- packer - a service to pack/unpack array into string implemented \Badoo\LiveProfilerUI\Interfaces\DataPackerInterface
- view - a service to fetch a template class implemented \Badoo\LiveProfilerUI\Interfaces\ViewInterface
- fields - a service to provide access to fields and a stats function list
- field_handler - a service to handle an aggregating function like sum, min, max implemented \Badoo\LiveProfilerUI\Interfaces\FieldHandlerInterface
- profiler - a wrapper for profiler to start and end profiling
- aggregator - a service to aggregate profile records
Pages services:
- %PAGE_NAME%_page - classes to render pages, can be called themselves or inside other framework
Data provider services:
- snapshot - a service to access snapshots data implemented \Badoo\LiveProfilerUI\DataProviders\Interfaces\SnapshotInterface
- method - a service to access methods data implemented \Badoo\LiveProfilerUI\DataProviders\Interfaces\MethodInterface
- method_data - a service to access method data implemented \Badoo\LiveProfilerUI\DataProviders\Interfaces\MethodDataInterface
- method_tree - a service to access method tree implemented \Badoo\LiveProfilerUI\DataProviders\Interfaces\MethodTreeInterface
- source - a service to access profiles data implemented \Badoo\LiveProfilerUI\DataProviders\Interfaces\SourceInterface
- job - a service to access jobs data implemented \Badoo\LiveProfilerUI\DataProviders\Interfaces\JobInterface
Storage services:
- source_storage - a service for profiler data storage implemented \Badoo\LiveProfilerUI\Interfaces\StorageInterface
- aggregator_storage - a service for aggregator storage implemented \Badoo\LiveProfilerUI\Interfaces\StorageInterface
AGGREGATOR_CONFIG_PATH: to change the project's config path (default src/config/services.yaml)
Live Profiler has 3 main parts:
- Profiler
- Aggregator
- web interface
To collect profiles you should use Live Profiler tool.
It's a process of aggregating the profiler's data for one day grouped by app, label and date. The aggregating script applied each function of aggregator.field_variations parameter on each field from aggregator.fields.
There are 2 modes of aggregation:
- Auto aggregation once a day. A script runs once a day and aggregates all profiles for previous day. By default the script tries to aggregate profiles for last 3 days to process skipped profiles on previous days.
- Manual aggregation of custom snapshot from web interface or using a special script
Aggregation process conveniently to use with docker. You have to set properly database connections for the profiler's and aggregator's data. To run manual aggregation:
docker-compose run --rm --entrypoint '/usr/local/bin/php /app/bin/cli.php aggregator:aggregate-manual app label YYYY-MM-DD' webManual aggregation without docker:
AGGREGATOR_CONFIG_PATH=%PATH_TO_CONFIG% /usr/local/bin/php %PATH_TO_PROJECT%/bin/cli.php aggregator:aggregate-manual app label YYYY-MM-DDYou have 3 options to run web interface:
- Start web server with document root in src/www
- Run php built-in server directly
AGGREGATOR_CONFIG_PATH=config/aggregator_services.yaml php -S 0.0.0.0:8000 -t src/www/ src/www/router.php - Run php built-in server from the docker container
docker-compose up webWeb interface will be available on 127.0.0.1:8000
There are next pages:
By default you see the profile list page with last aggregated snapshots grouped by app and label. All column in the table are sortable. You can find a snapshot by part of the label. Each snapshot has links to pages:
- /profiler/tree-view.phtml - methods tree view with stats and graphs of each method
- /profiler/result-diff.phtml - snapshots diff interface, allows to compare two snapshots with different dates
- /profiler/list-view.phtml - methods list view with full list of called methods
- /profiler/result-flamegraph.phtml - flame graph of last snapshot data Also on this page you can rebuild a custom snapshot with today's fresh data
On this page you can see graphs for every collected parameters and every methods up to 6 months. Each graphs also included children stats. It helps to see the history of changes.
stats for this method, the method's parents amd the method's children.
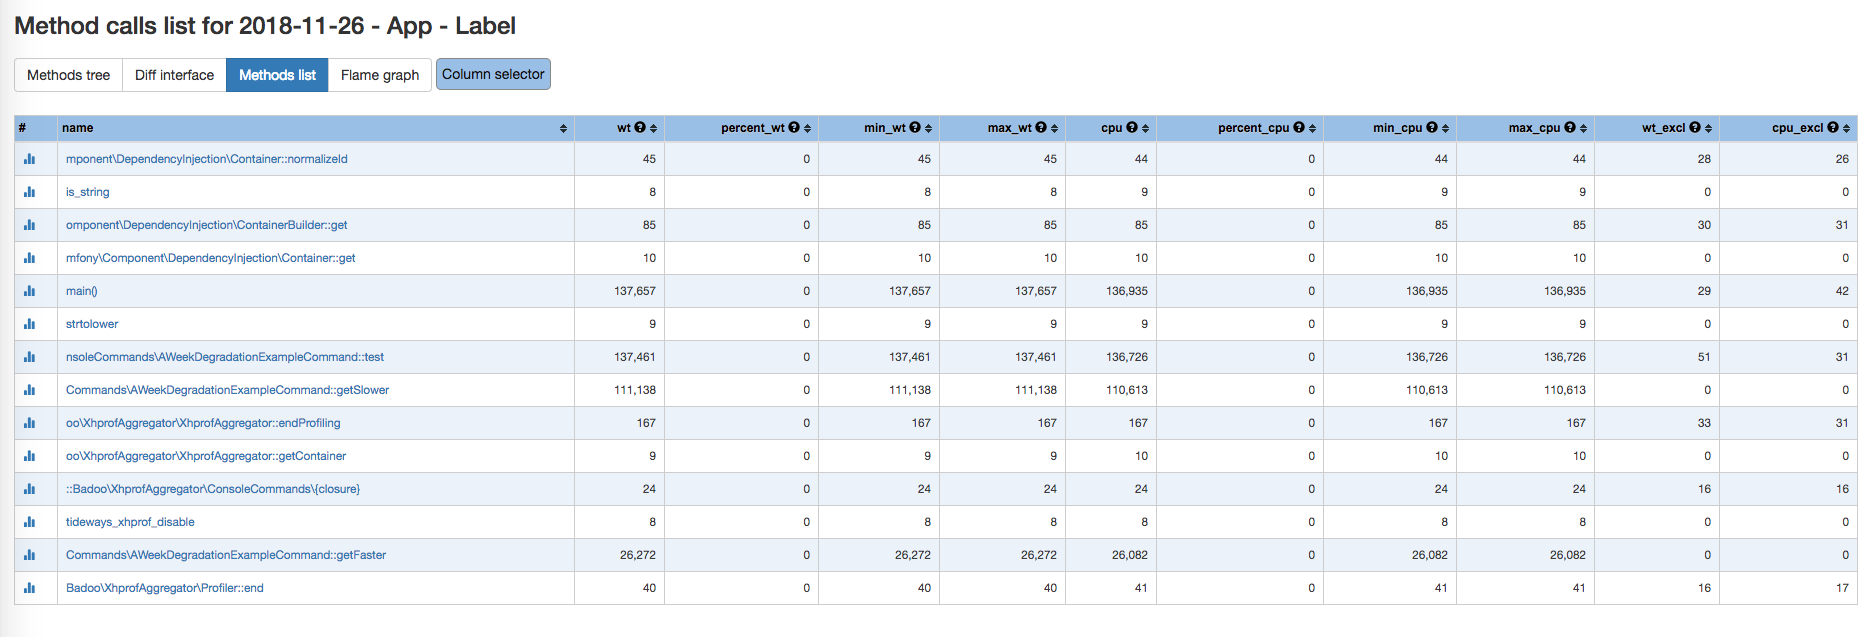
On this page you can see full method list for current request. It allows to sort them and find the most slow method.
It's a differences interface to compare particular request for two dates and see what became worse.
On this page you can see flame graph of the last aggregated request
On this page you can see when the method was called last time. It may be helpful for refactoring purposes and find unused methods.
On this page you can see the most changed methods in any requests for two dates, for example, today and a week ago. It can help to find a place of a potential performance problem.
There are a few ways for customisation:
- Implement \Badoo\LiveProfilerUI\Interfaces\FieldHandlerInterface with custom aggregating functions, for example the median value
- Implement \Badoo\LiveProfilerUI\Interfaces\DataPackerInterface to get more efficient packer. For example use gzcompress to store less fields
- Implement \Badoo\LiveProfilerUI\Interfaces\StorageInterface for custom storage or use own connection manager
- Implement interfaces \Badoo\LiveProfilerUI\DataProviders* to use nosql storage
- Integrate aggregator pages in your framework. Set aggregator.use_layout=false and \Badoo\LiveProfilerUI\Pages* class in any action method
The easiest way to run tests is to run them in the docker container:
docker-compose run --rm --entrypoint '/app/vendor/bin/phpunit' webAlso you can run tests locally. Install composer packages with dev requirements:
php composer.phar install --devIn project project directory, run:
vendor/bin/phpunitError "ERROR: Get https://registry-1.docker.io/v2/composer/composer/manifests/php7: unauthorized: incorrect username or password" during docker-compose up
Run docker logout before docker-compose up
Check location of sqlite db file. If it's correct run AGGREGATOR_CONFIG_PATH=src/config/services.yaml php bin/cli.php aggregator:install
or docker-compose exec web php /app/bin/cli.php aggregator:install for Docker
Error "An exception occurred in driver: SQLSTATE[08006] [7] could not translate host name "HOST" to address: nodename nor servname provided, or not known"
Check postgresql connection url
Error "An exception occurred in driver: SQLSTATE[HY000] [2002] php_network_getaddresses: getaddrinfo failed: nodename nor servname provided, or not known"
Check mysql connection url
Error "An exception occurred in driver: php_network_getaddresses: getaddrinfo failed: nodename nor servname provided, or not known"
Check mysqli connection url
This project is licensed under the MIT open source license.


