Preferred way:
./demo.shAfter everything starts, you can open http://localhost:3000 to see the Grafana dashboards. Credentials:
username: admin
password: admin
There are 8 preconfigured dashboards in the General folder.
Run docker-compose down to stop the demo.
In case of any trouble running the demo, please review the presentation
Or see this section on how to run the demo manually.
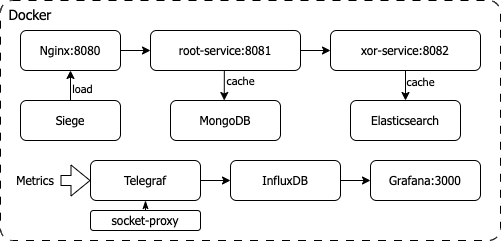
The idea of a project is to calculate a simple mathematical formula sqrt(xor(a, b)) in a most entertaining way: root-service
receives a and b via REST endpoint, forwards execution of xor() part to the xor-service using its REST API, and performs sqrt() on
the result.
To emulate complexity/latency, both services have a limitation on how many mathematical operations can be performed in a second. Also, both services utilize caching to speed up calculations. Eventually, caching gives a performance boost.
root-service uses MongoDB as a cache, xor-service uses Elasticsearch. xor-service also precalculates additional results in advance, so its cache improves performance much sooner.
I used such an extended setup to experiment with Zipkin tracing and a bunch of other ideas but didn't have time to implement them for now.
The project contains a total of 10 containers:
- Nginx - reverse proxy for root-service
- root-service - main service to receive traffic
- xor-service - secondary service for an additional network hop
- MongoDB - cache for root-service
- Elasticsearch - cache for xor-service
- Telegraf - metrics collector
- InfluxDB - metrics storage
- Grafana - metrics visualization
- socket-proxy - to expose Docker socket to Telegraf in a secure way
- siege - load generator
Services are written in Kotlin using Spring Boot 3. Their images are prebuilt and available on Docker Hub: root-service and xor-service.
To build them locally, run docker-compose build xor-service root-service in the root directory. No additional prerequisites are required.
is exposed under http://localhost:8082 and has a calculation endpoint:
/xor/{base}/{modifier} and a service endpoint: /data/drop to drop the cache.
is exposed under http://localhost:8081 and has a calculation endpoint:
/root/xor/{base}/{modifier} and a helper endpoint: /root/xor/random to calculate random base and modifier values.
base is randomly generated on each service restart, modifier is randomly generated on each request.
It also has a service endpoint: /data/drop to drop the cache.
The project intentionally contains .idea and .iml files to make it easier to open in IntelliJ IDEA.
- config - contains configuration files for docker containers.
- data - subdirectories are mounted as data volumes for containers.
- docs - contains images for this README.
- services - contains source code for Java services.
The demo is fully enclosed in the docker-compose.yaml. Instead of using ./demo.sh, You can also run both services
and monitoring by:
docker-compose up nginx grafana -dThe sample load won't start in this case. To run it, use:
docker-compose up siege -dor manually:
siege -c 10 -t 10m http://localhost:8081/root/xor/random