The goal of this project is to implement a Spring Boot application, called movies-api, and use Filebeat & ELK Stack (Elasticsearch, Logstash and Kibana) to collect and visualize application's logs and Prometheus & Grafana to monitor application's metrics.
-
Spring BootWeb Java application that exposes a REST API for managing movies. Its endpoints are displayed in the picture below.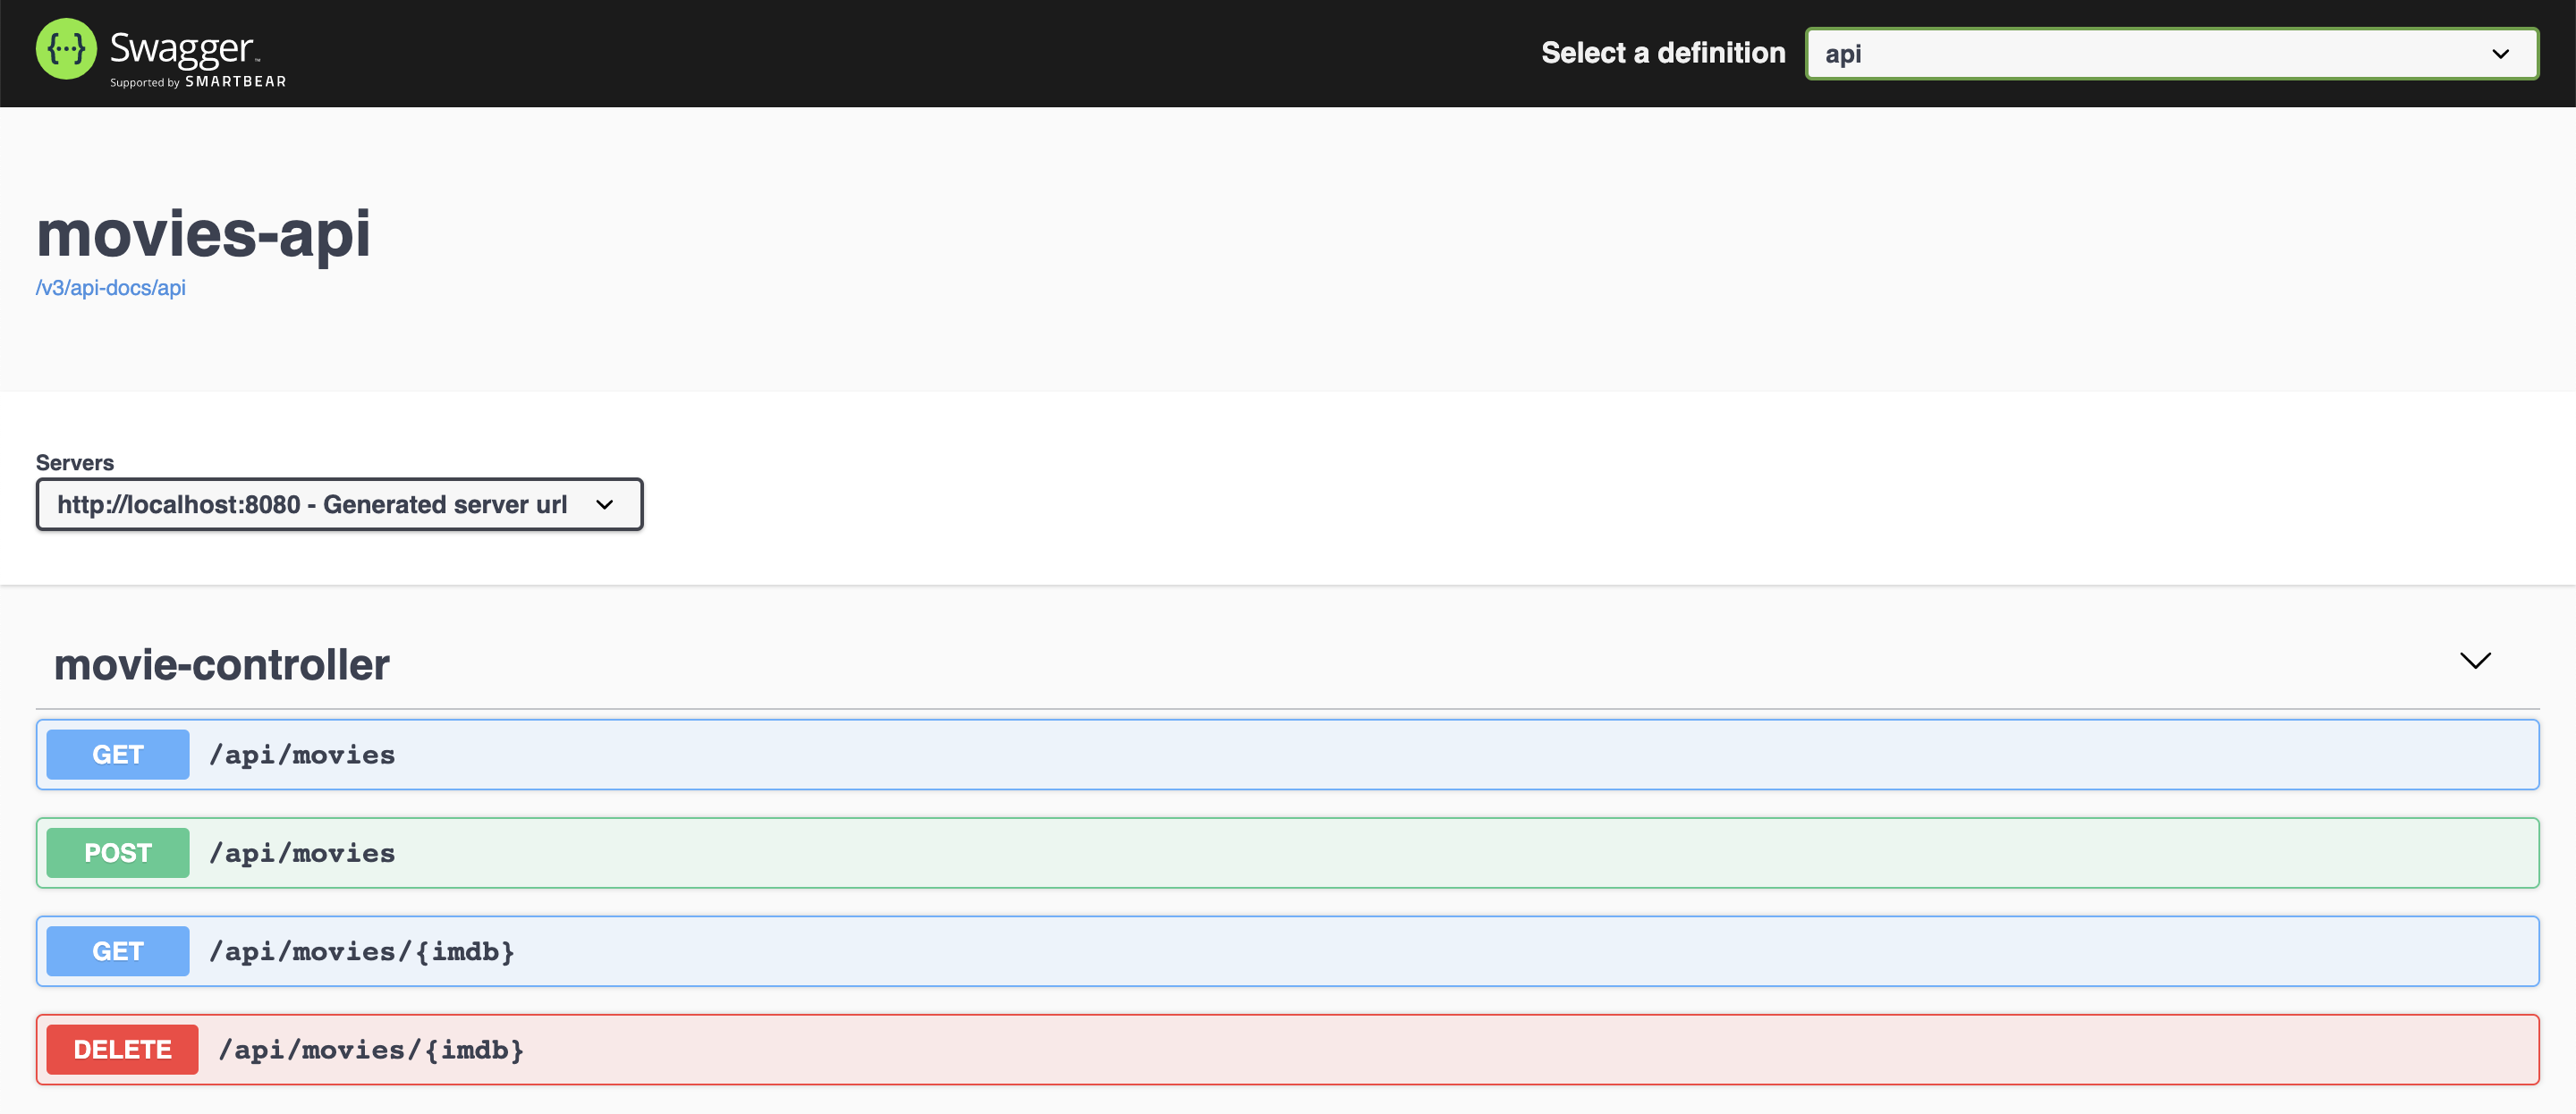

- In a terminal, make sure you are inside
springboot-elk-prometheus-grafanaroot folder- Run the following script to build the image
./docker-build.sh
-
Open a terminal and inside
springboot-elk-prometheus-grafanaroot folder rundocker-compose up -d -
Wait for Docker containers to be with status
running (healthy)(exceptfilebeat). To check it, rundocker-compose ps
-
movies-api
movies-apiSwagger is http://localhost:8080/swagger-ui.html -
Prometheus
Prometheuscan be accessed at http://localhost:9090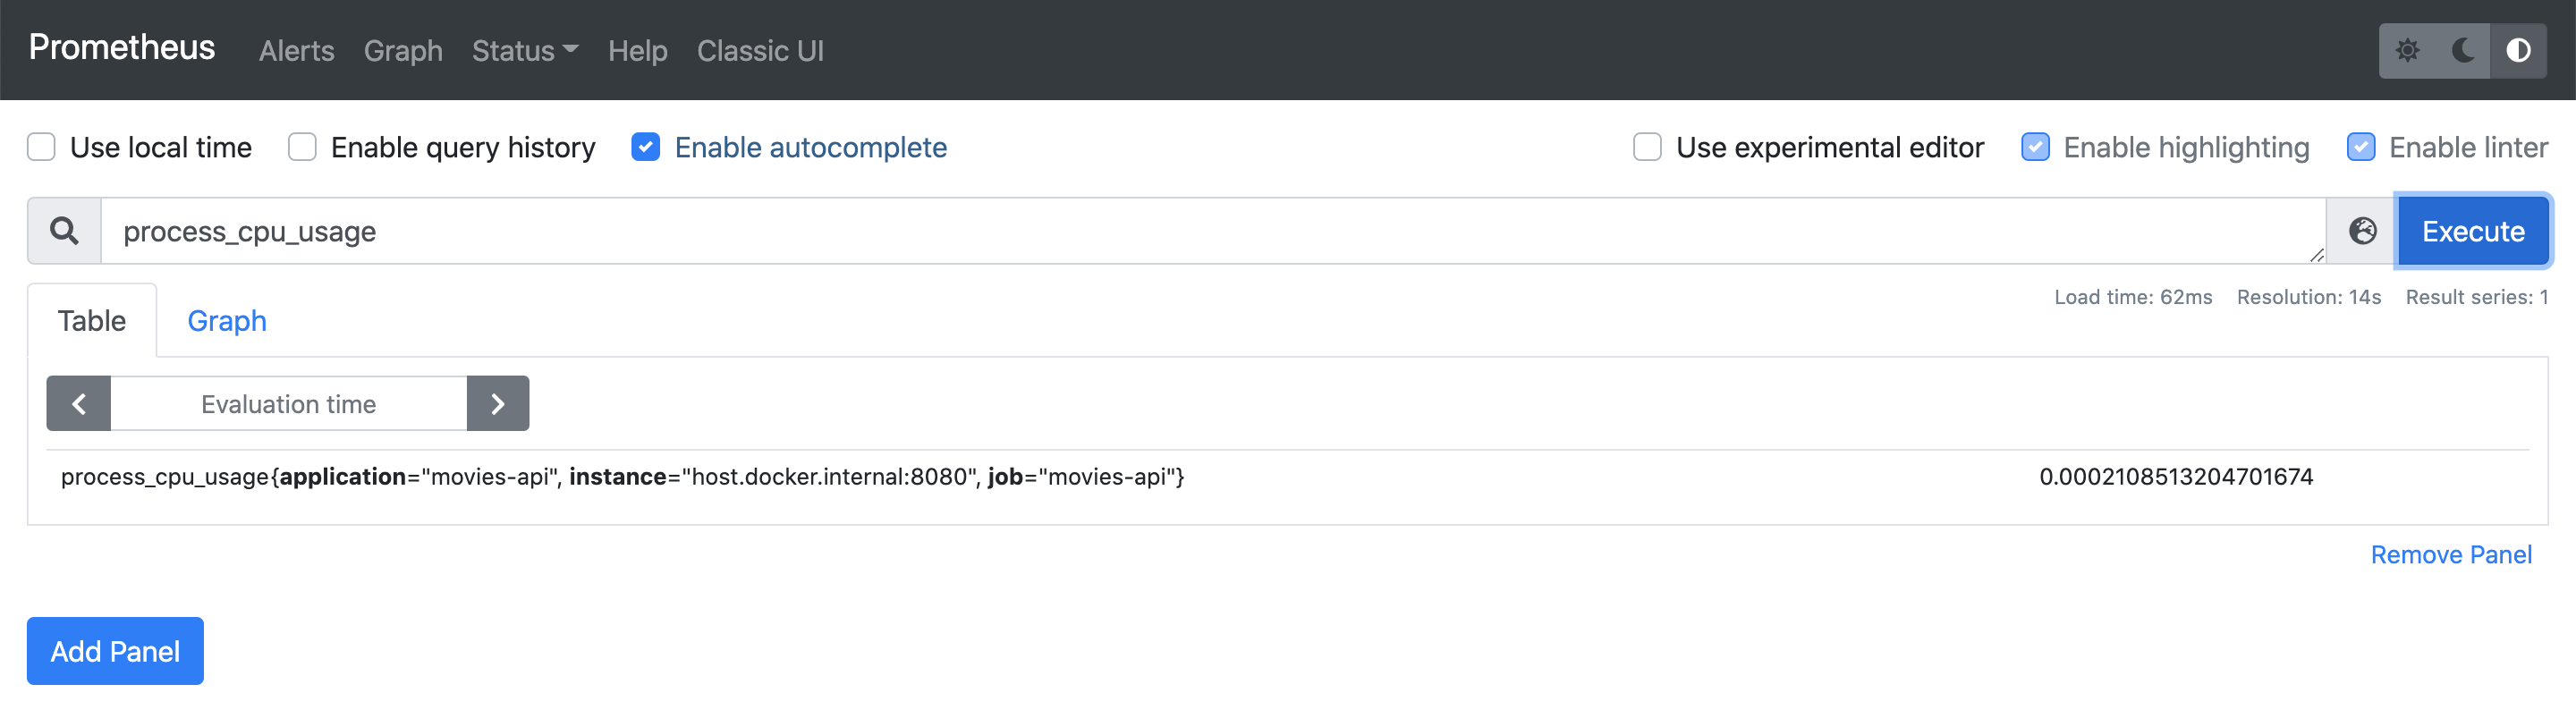
-
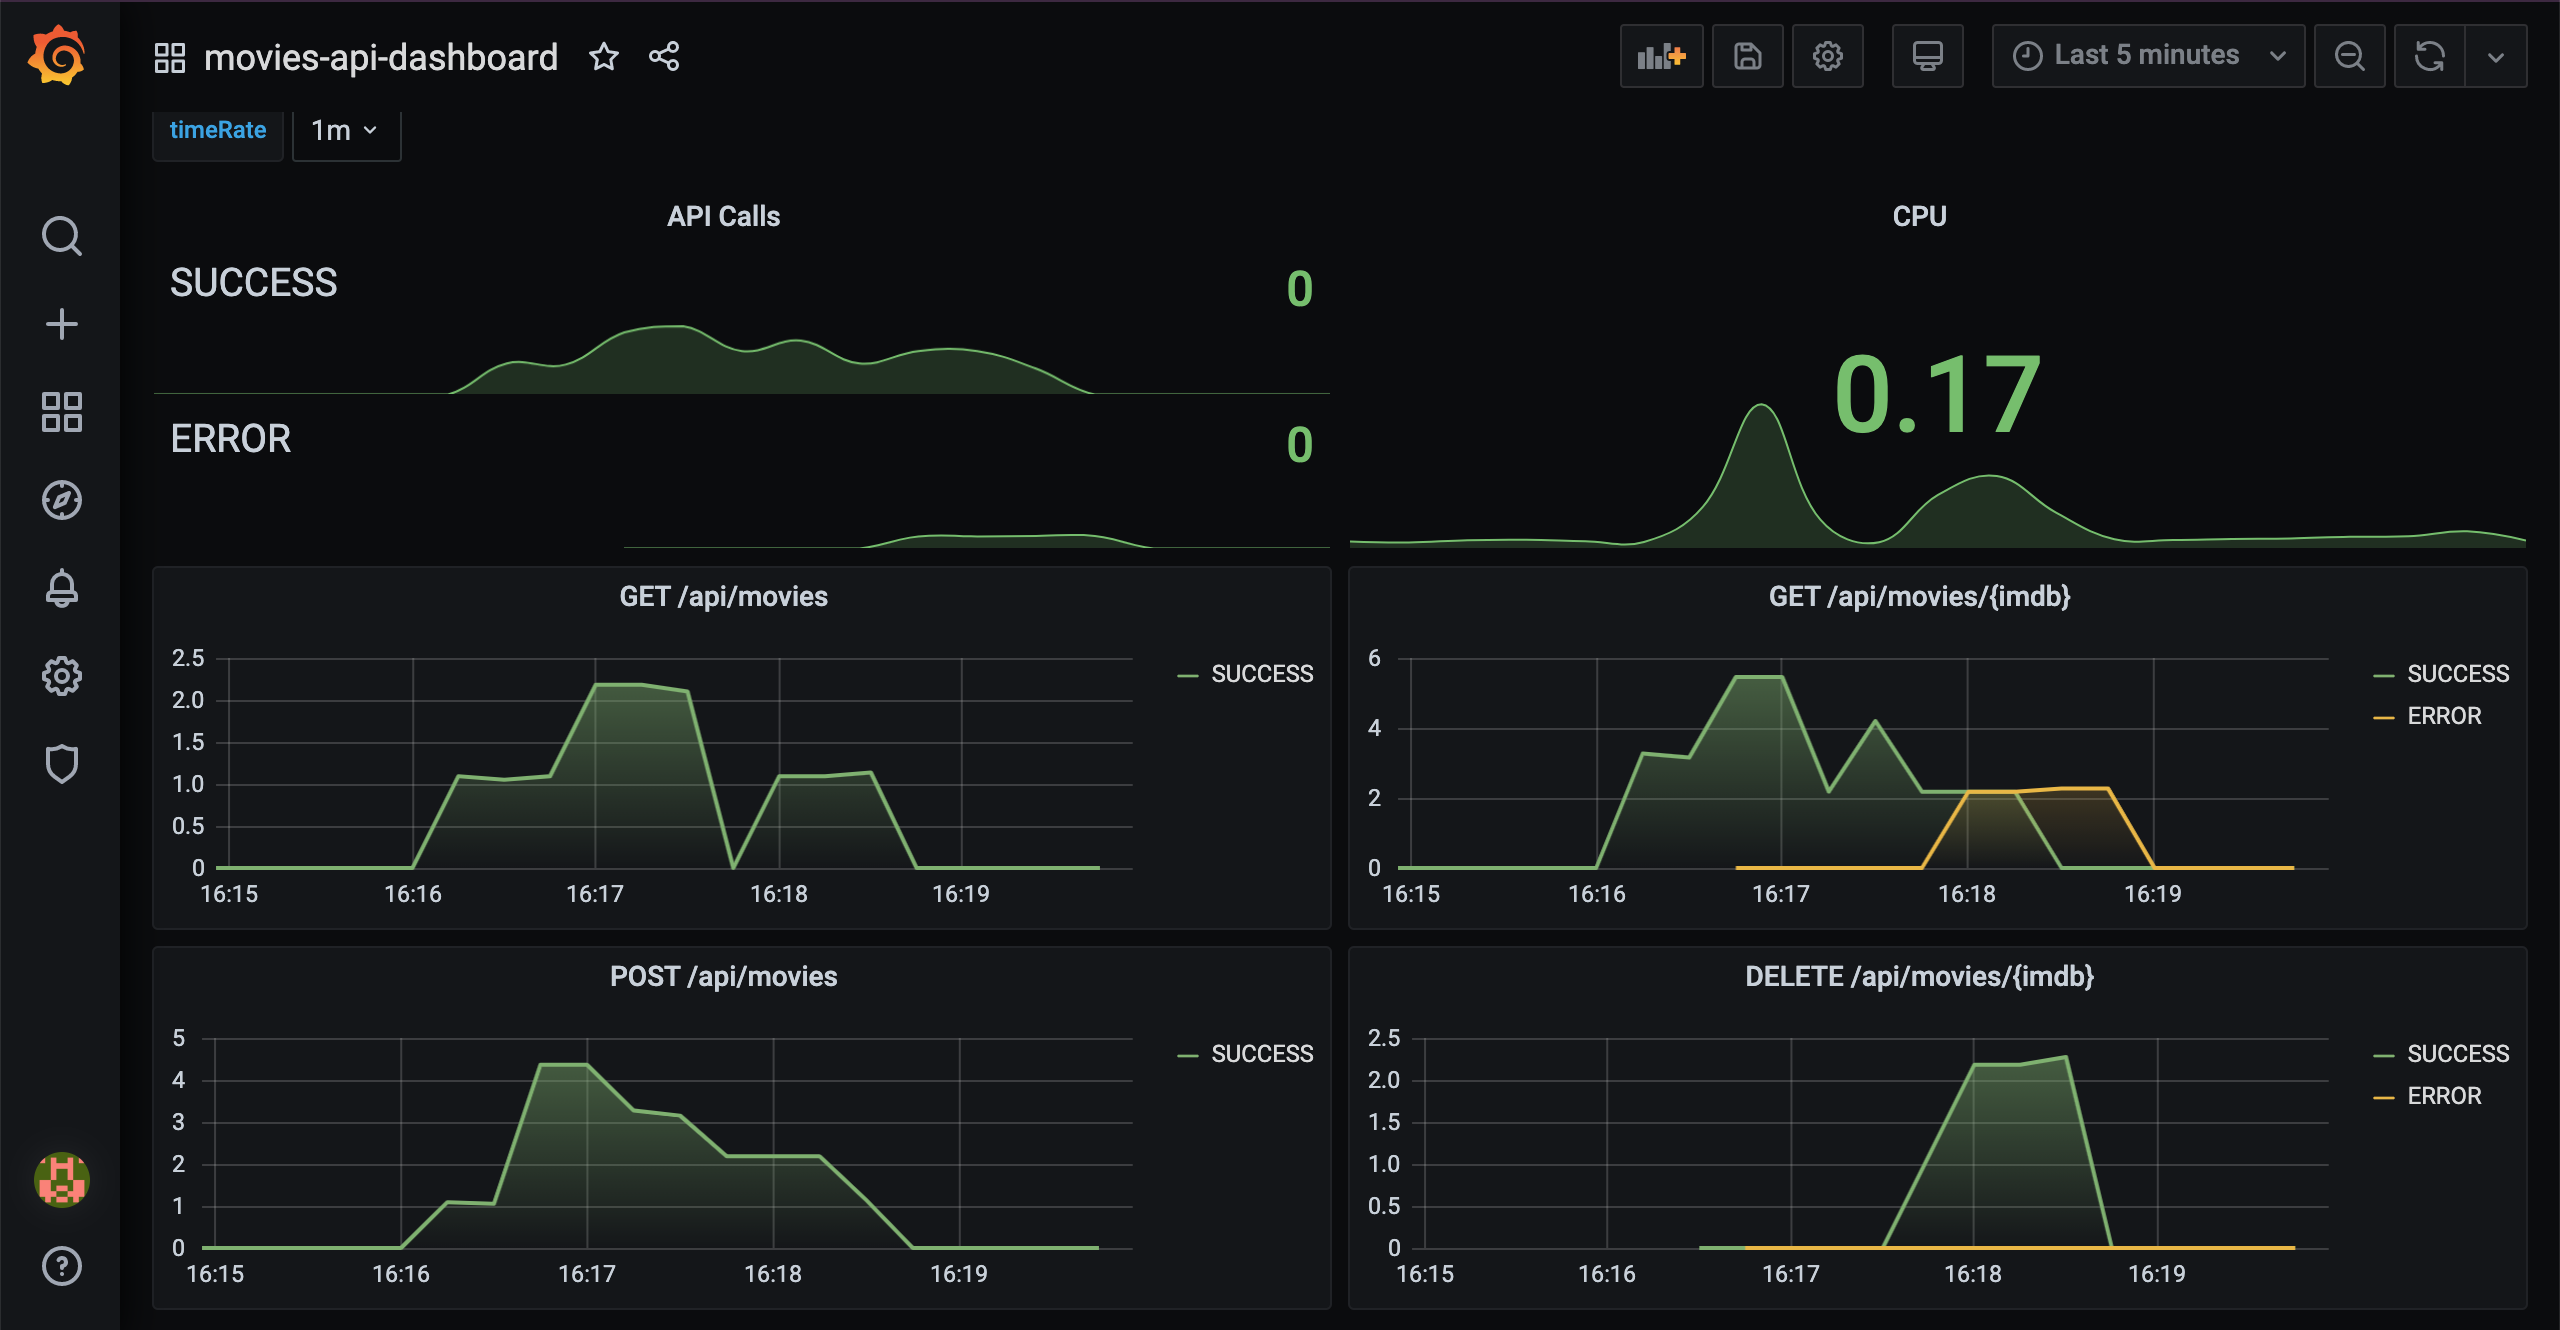
Grafana
Grafanacan be accessed at http://localhost:3000- In order to login, type
adminfor bothusernameandpassword - You can skip the next screen that ask you to provide a new password
- Click
General / Homeon the top - Click
movies-api-dashboard
- In order to login, type
-
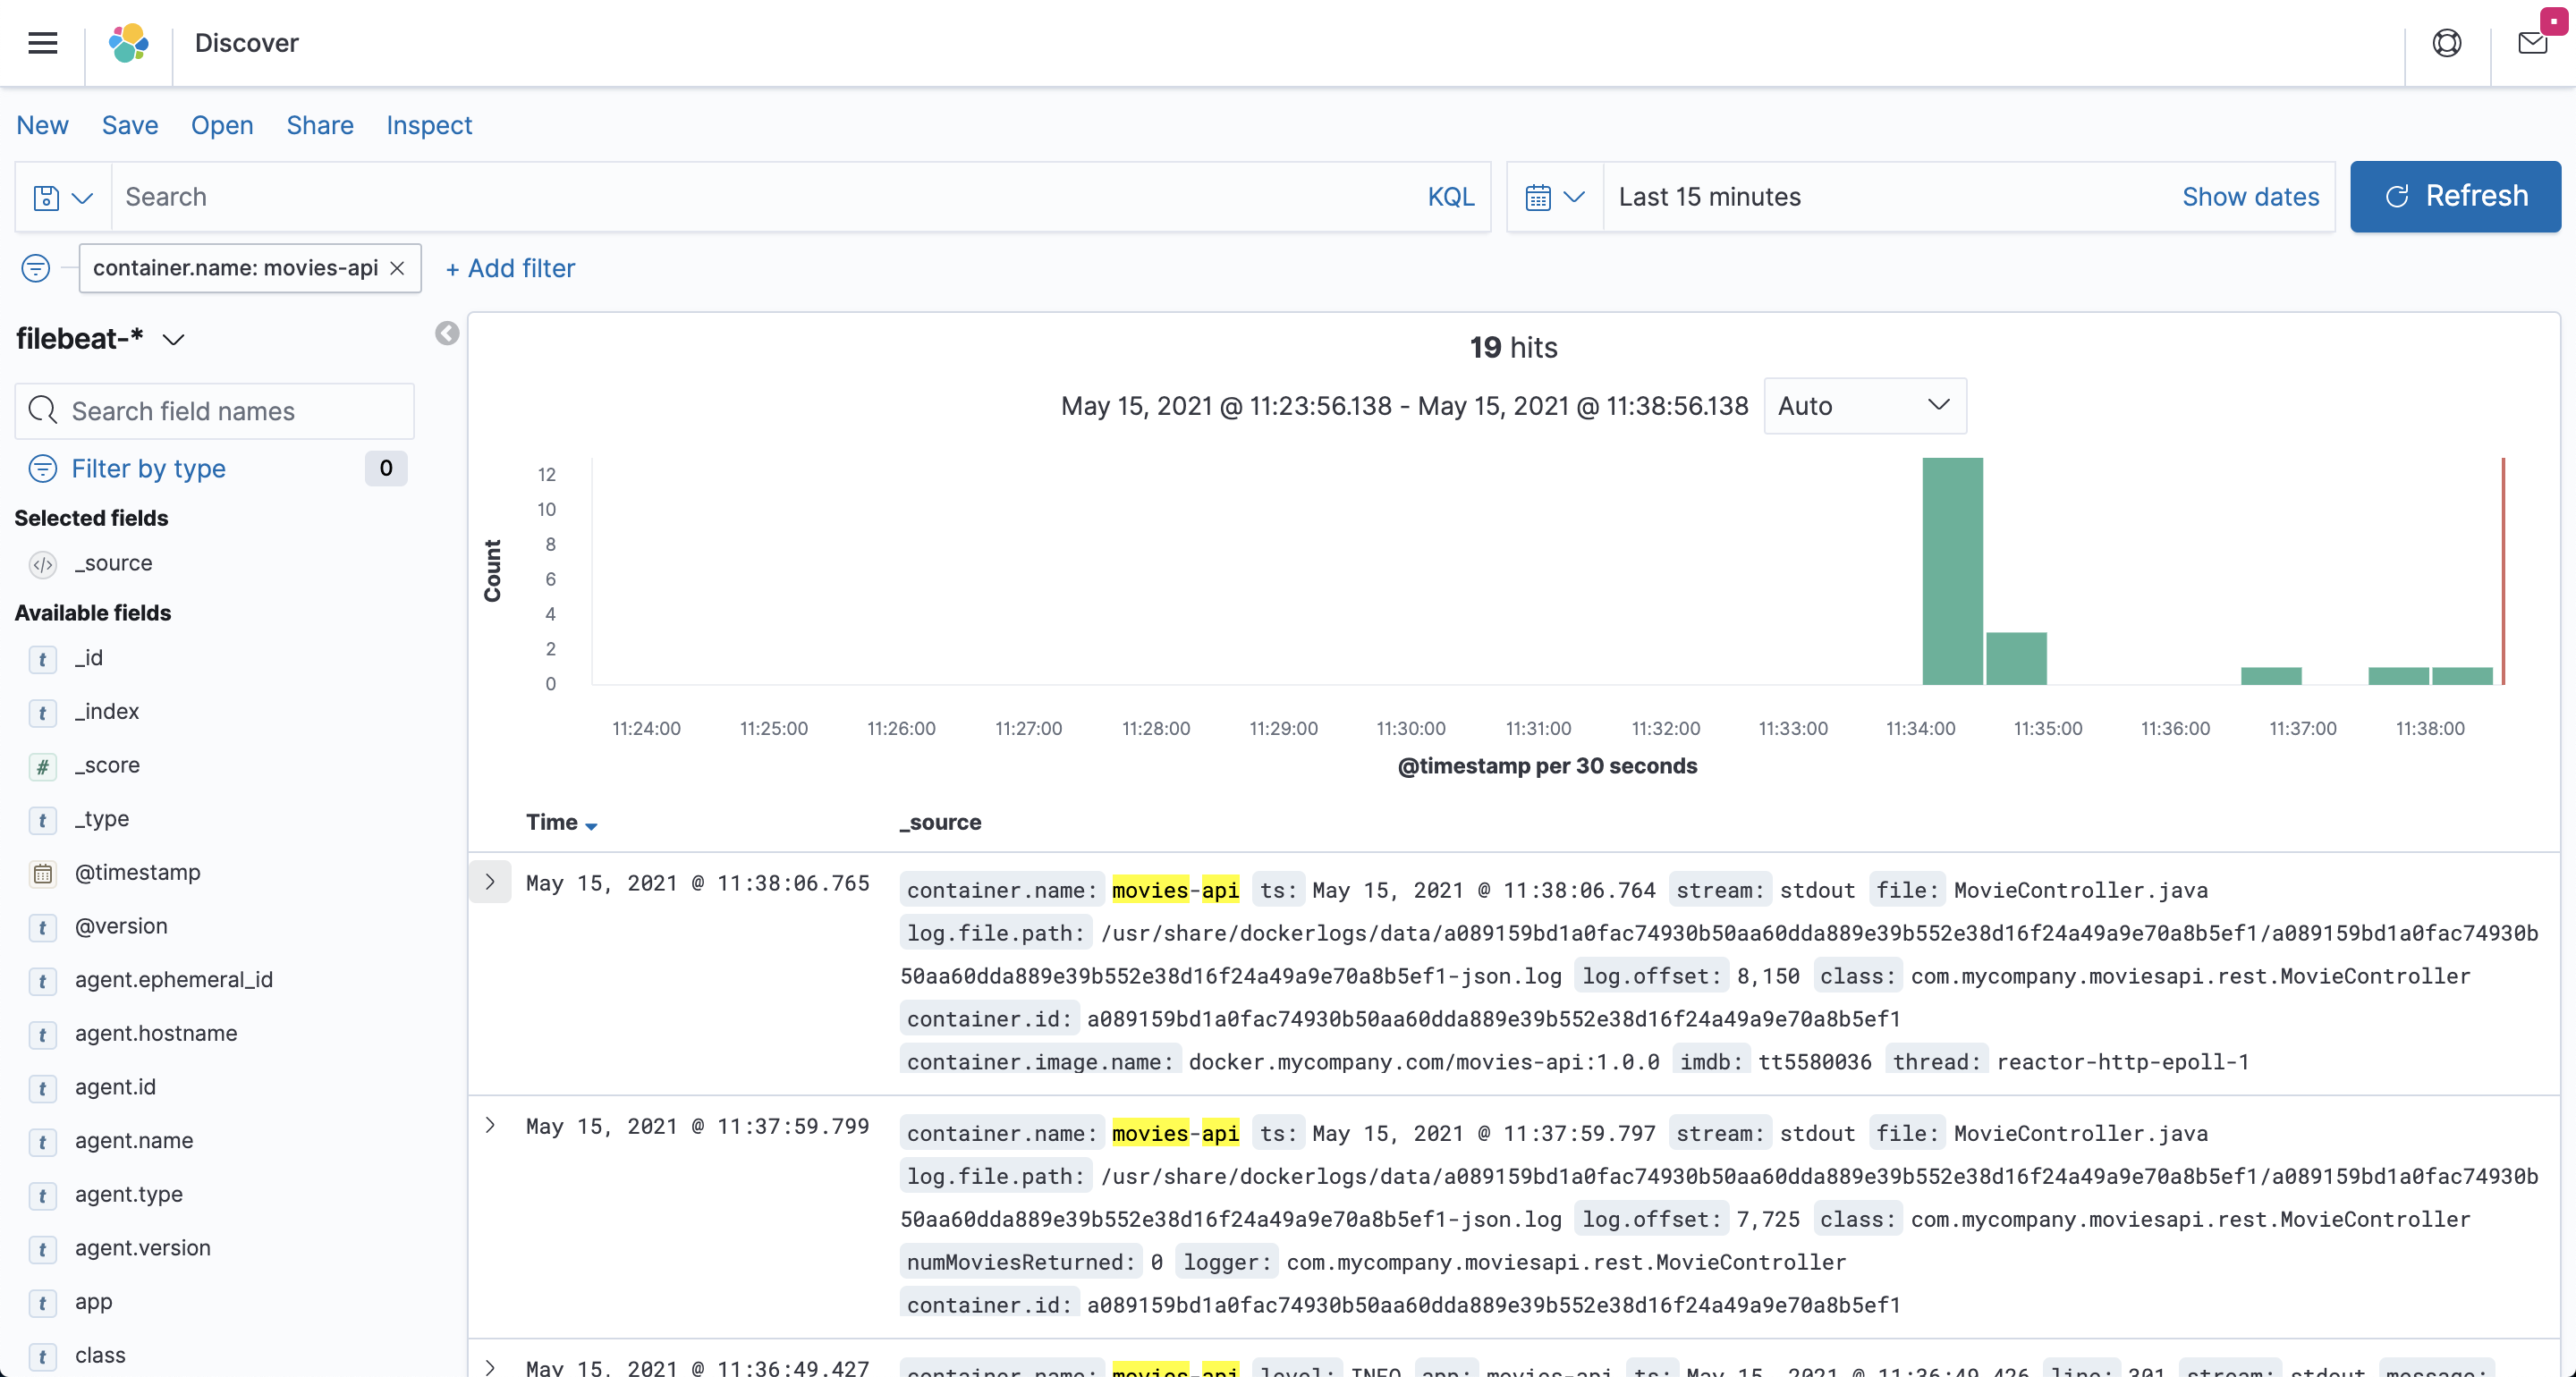
Kibana
Kibanacan be accessed at http://localhost:5601Configuration
- Access
Kibanawebsite - Click
Explore on my own - In the main page, click the "burger" menu icon and, then click
Discover - Click
Create index patternbutton - In the
Index pattern namefield, setfilebeat-*and click> Next Stepbutton - In the
Time fieldcombo-box, select@Timestampand clickCreate index pattern - Click the "burger" menu icon again and then click
Discoverto start performing searches
- Access
-
Elasticsearch
ElasticsearchURL is http://localhost:9200Useful queries
# Check ES is up and running
curl localhost:9200

# Check indexes in ES
curl "localhost:9200/_cat/indices?v"

# Check filebeat index mapping
curl "localhost:9200/filebeat-*/_mapping"

# Simple search
curl "localhost:9200/filebeat-*/_search?pretty"


- To stop and remove
docker-composecontainers, network and volumes, go to a terminal and, insidespringboot-elk-prometheus-grafanaroot folder, run the following commanddocker-compose down -v