Status Overview Panel
Status Overview Panel is an ideological continuation of the Status Panel plugin, written on the current framework supported by Grafana. The plugin's task is to display the worst status of any component based on various metrics or one of the metrics of that component. In this context, the component can be any server, application, IT system, or any other entity that you can think of, combining metrics into a single entity. The main feature of the plugin is the visual representation of the component's status changes. This is achieved through a large panel with the component's name, displaying all metrics or metrics that influence the status change, as well as a blinking effect when the status changes. Audio notifications are also planned for the future.
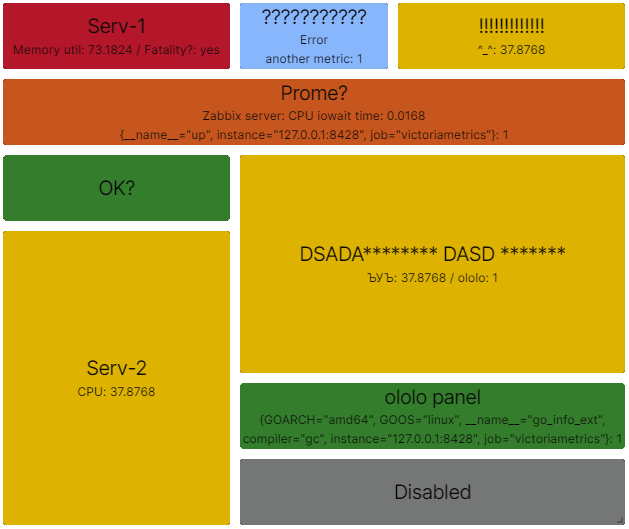
Preview
Main Functionality
- General
- Enable/disable or set the panel to an unknown status
- Choose the display type of metrics, either in rows or in a single line
- Enable/disable the blinking effect
- Add a link in the panel's name to navigate to another level or dashboard
- Select color schemes for possible statuses
- Rules
- Add, delete, clone, and move rules
- Rule name
- Select the metric or metrics by regular expression to which you want to apply the rules.
- Option to set an alias for displaying metrics, static or regular expression
- Option to provide additional metric description for display in a tooltip
- Display metric name
- Display metric value
- Choose the display type
- Numeric threshold
- Display only when the threshold is reached
- Reverse logic if you need to assign statuses from the highest metric value to the lowest
- 5 threshold levels; if a threshold is not necessary, it can be left empty
- String threshold
- Display only when the threshold is reached
- 5 threshold levels; if a threshold is not necessary, it can be left empty
- Display only or conditional display without affecting the panel's status
- Use conditions or not
- Choose the condition: equal, not equal, greater than, less than, and value. Works for both numeric and string values.
- Numeric threshold
Recommendations
It is strongly recommended to remove the panel name in the standard panel settings and use the panel name in the plugin settings.
Data Sources
The plugin is designed to work with any data sources and has been tested with:
- Zabbix
- Prometheus
- Postgres
If you encounter any issues with specific data sources, please leave an issue.
TODO
- Select and display value types for metrics
- Audio notifications
Select metrics based on regular expressionsadded in v0.0.4- Additional plugin for global settings that affect all panels
Use FR, any ideas for development are welcome.