A graphing library in SPWN.
Documentation: docs
- Clone this repository or download the repository zip
git clone https://github.com/sertdfyguhi/GRPH.git- Move the
librariesfolder into your SPWN file directory
import GRPH

let chart = @bar_chart::new(
  {
    "Stereo Madness": {
      value: 1,
      color: hex("#2451FF")
    },
    "Bloodlust": {
      value: 8,
      color: hex("#F0001F")
    }
  },
  title="The Difficulty of\nDifferent Geometry Dash Levels",
  y_axis_label="Difficulty"
)
chart.add("Back on Track", 2, color=hex("#FF8329"))
chart.show(start_pos=[10, 1])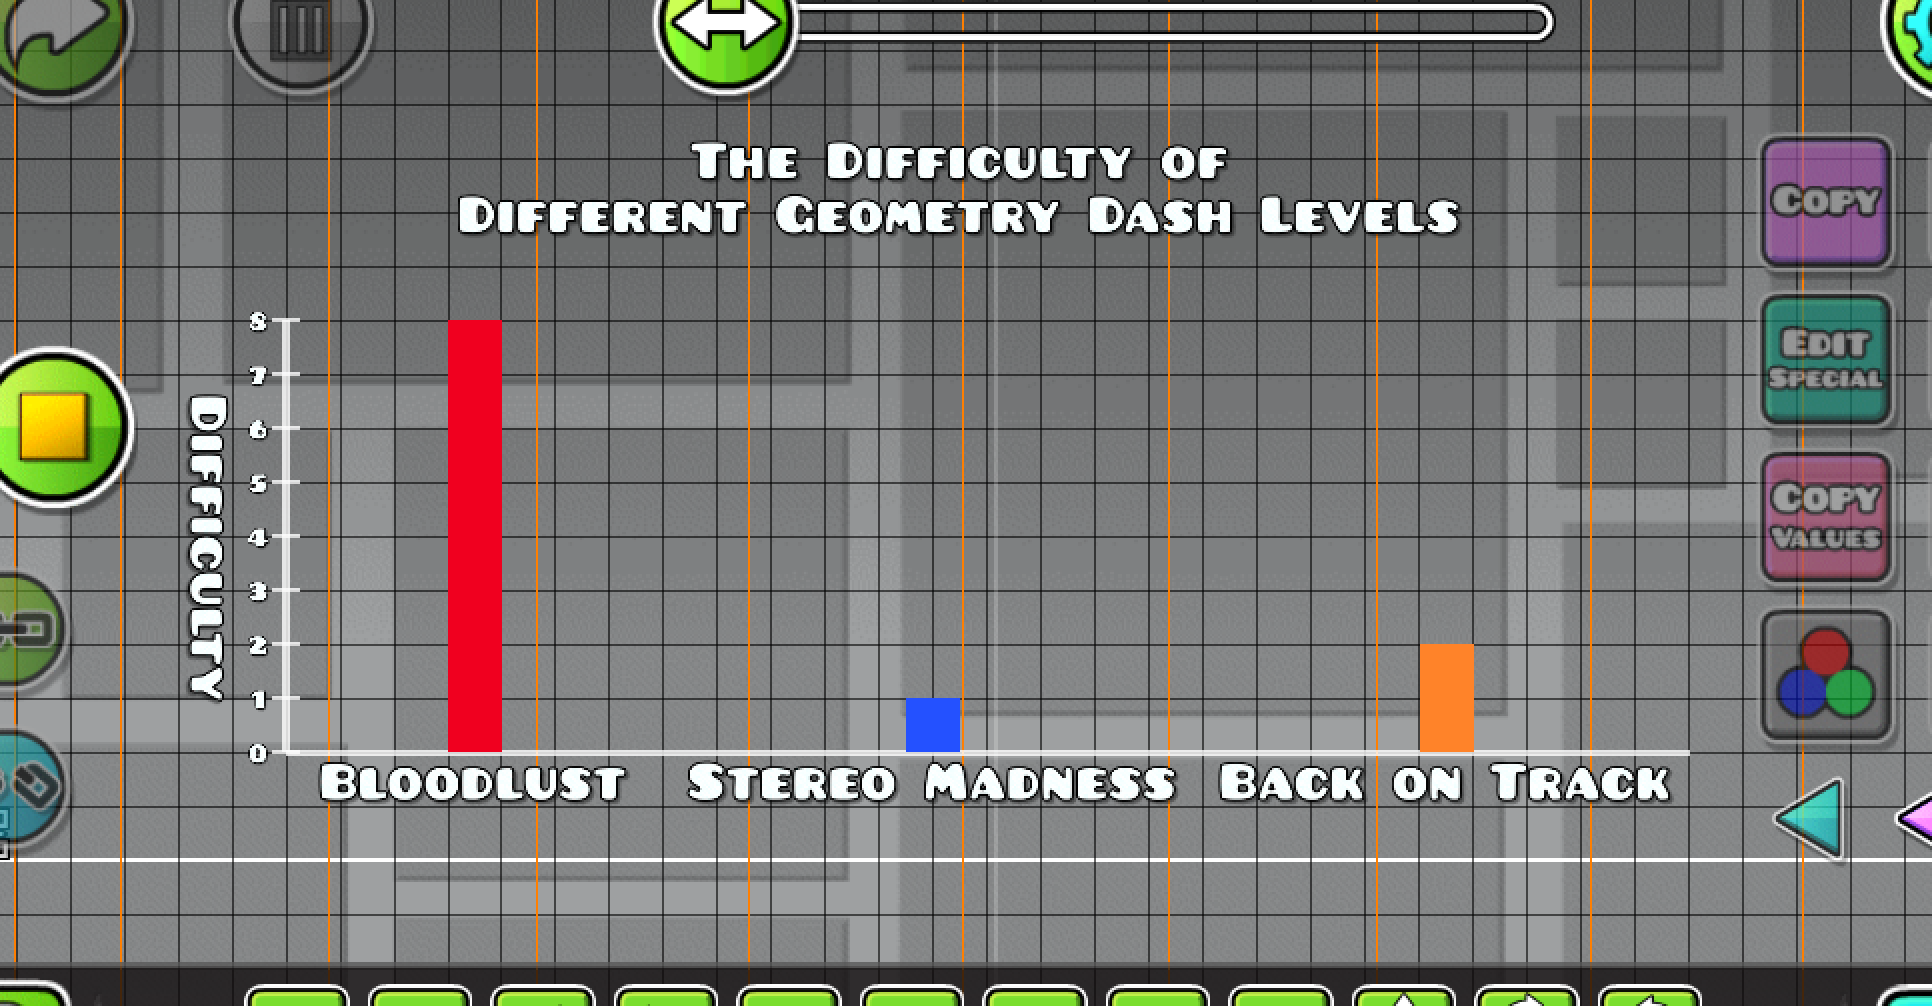
- Add documentation
- Add line graph
- Add scatter graph
- Add pie chart
- Fix bug where block is out of graph when value is lower than 1
- Add functionality to have the value shown on graph