S. Faith
NC State University
22 Aug 17
This app was designed using Rshiny (https://shiny.rstudio.com). The application when ran from R will launch a web browser GUI for viewing STR results from next generation sequencing (NGS) data.
Download the app3.R file from this Github repo. Ensure your computer has R and the app decencies (packages) installed.
The RShiny app is designed for use on a local machine that must have the following:
- R (https://www.r-project.org)
- R packages -- (shiny) -- (ggplot2) -- (dplyr) -- (tidyr) -- (DT)
Use the "run" feature of your local R environment to launch the app. If a web browser is not opened with the GUI, select "Open in Browser" from the window. Your computer's default browser will be used.
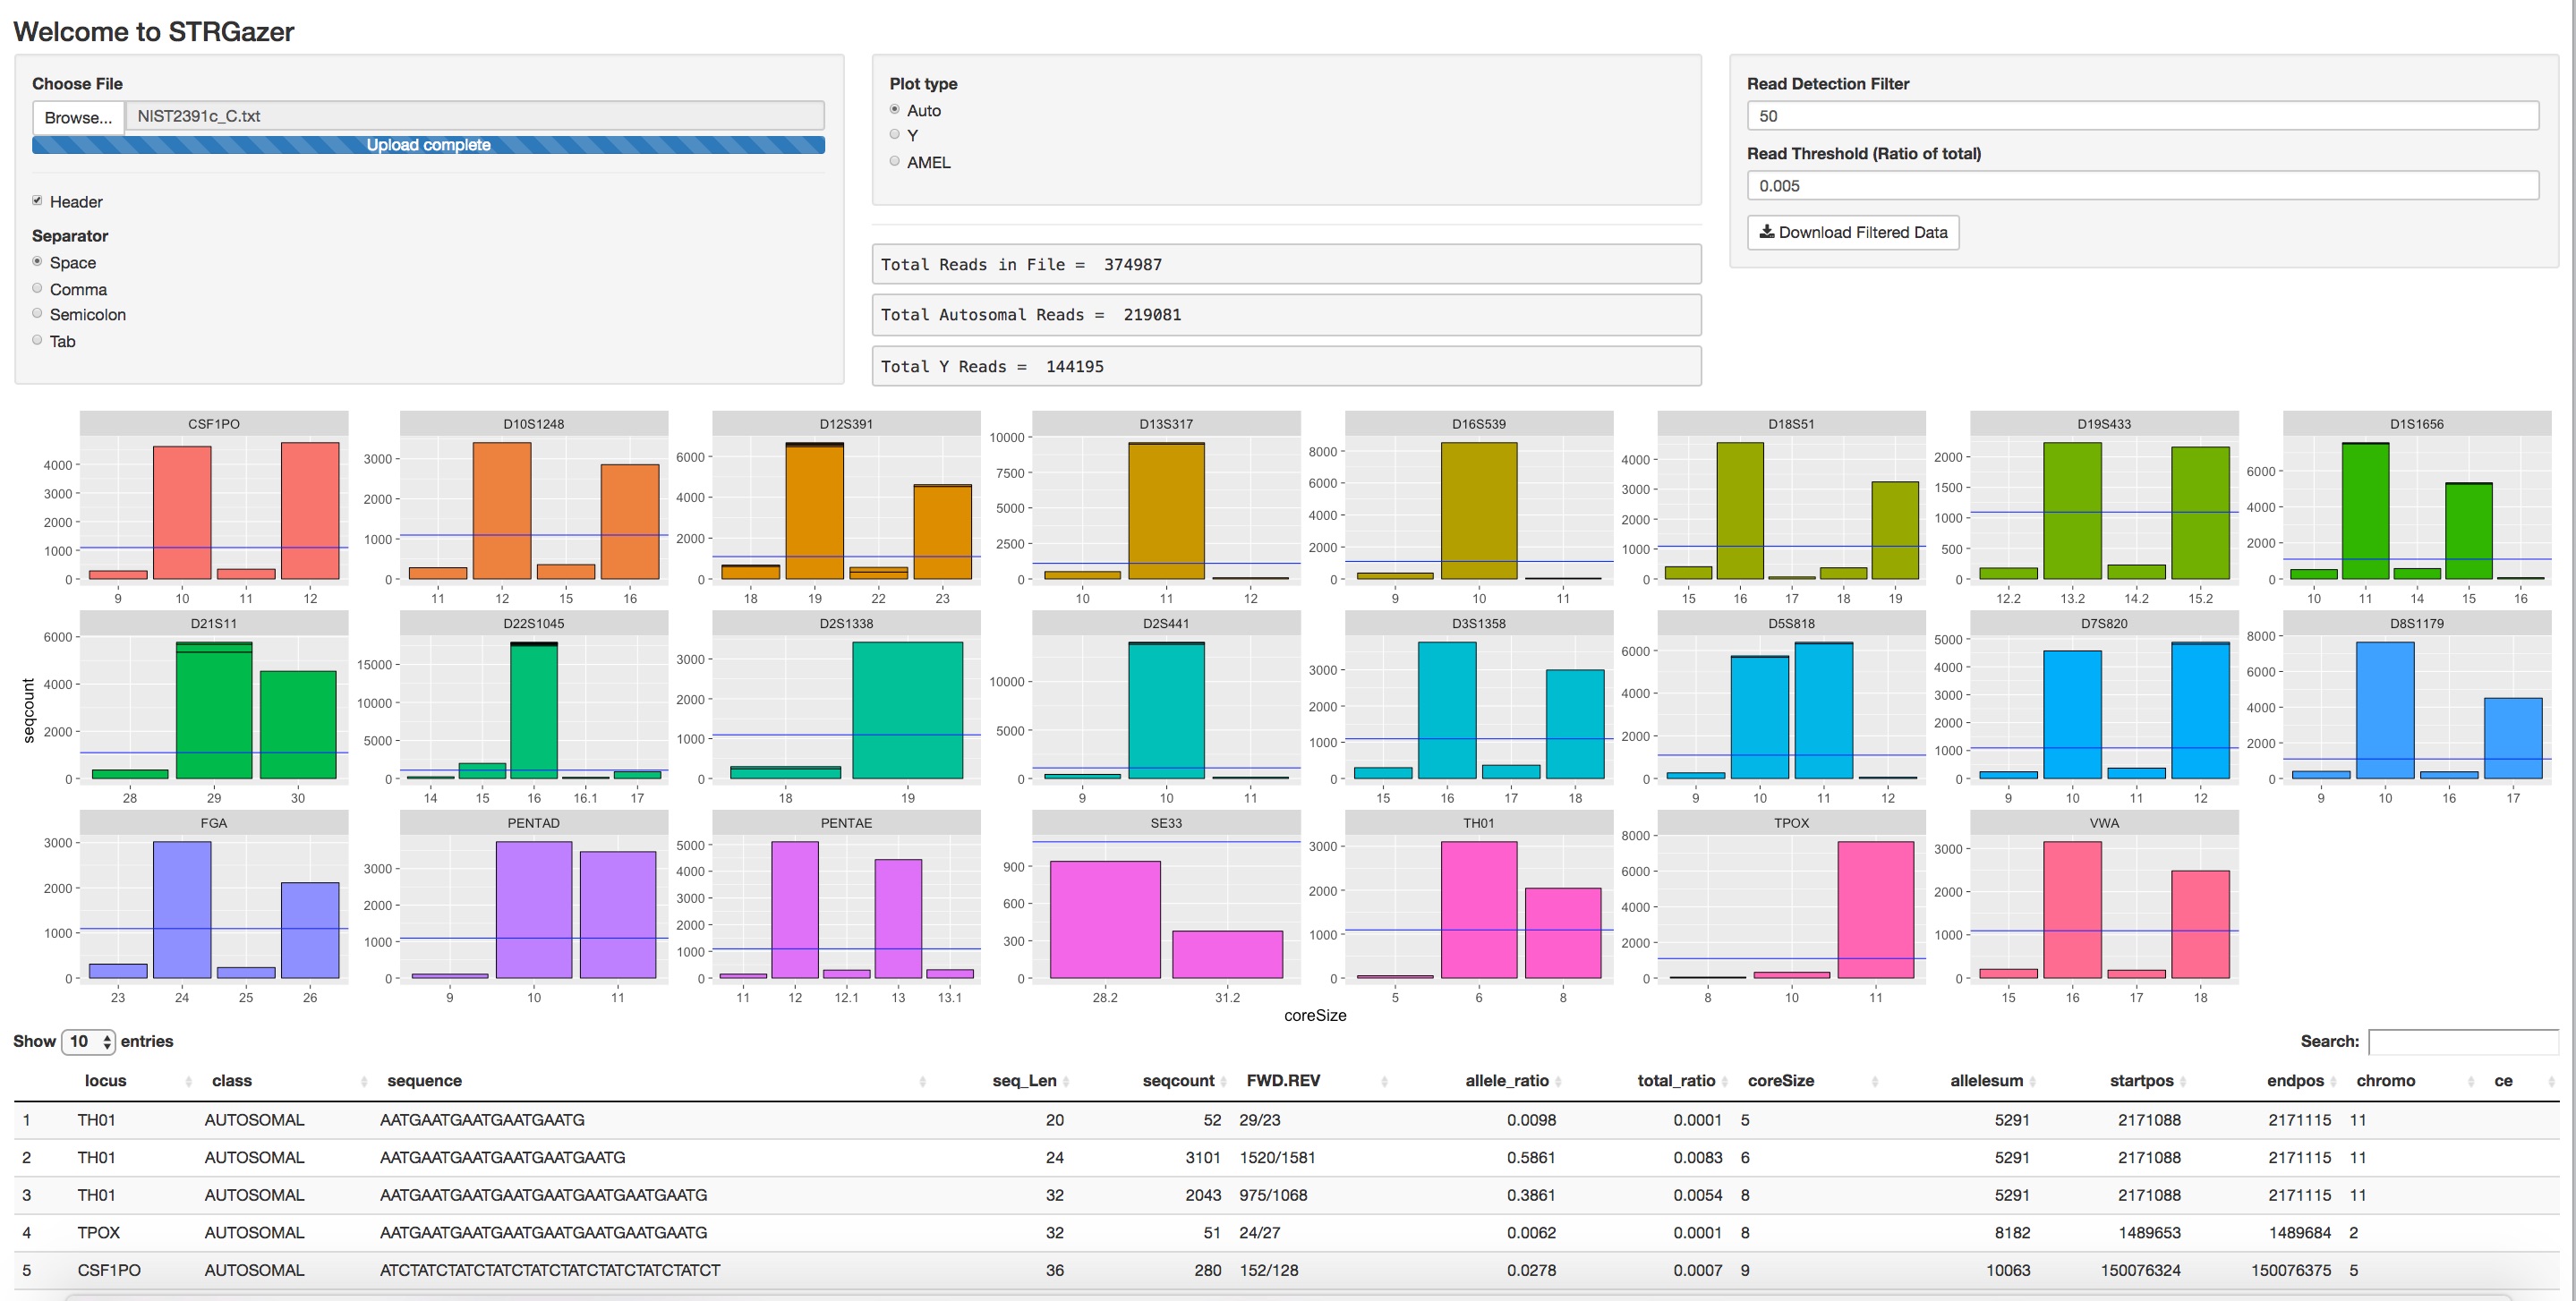
The web app allows users to upload data from .txt and .csv files when fields are separated by comma, space, and tab. Use the radio buttons to select the type of separators in your file. Select the file for upload from the dialogue box that opens after selecting "Browse" under "Choose File."
The upload file format must contain the following fields with descriptive headers:
- "locus" - containing any autosomal or Y or locus name(s)
- "class" - containing the fields "AUTOSOMAL", "Y", or "AMEL"
- "coreSize" - the fragment size of the repeat, equivalent to CE typing
- "seqcount" - the number of reads per allele Advanced R users may change these objects in the code to match a specified format, e.g., replace "coreSize" with "reads".
All other columns and headers will be displayed in the table, but only the four above are used for plotting data. Note, advanced R users may change the ggplot code, facet_wrap(scales = "free_x") to normalize the Y-axis across all loci to show interlocus balance.
Example .txt files are included in this repository for NIST SRM2391c-components A and C. Data were generated with Promega PowerSeq 46 GY and contains 23 autosomal and 23 Y STR loci.
The radio buttons in the center console allow the user to toggle between autosomal and Y markers present in the file.
The two filters may be adjusted at anytime to filter the data. The Read Detection filter will omit data below the specified level. 50 reads is the default from internal testing. The Read Theshold (% of reads) is displayed as a purple horizontal bar in the histogram plots and may also be adjusted. The default is 0.005 or 0.5% of total from internal testing. Note: data are split into autosomal and Y STR sets from the "class" variable and the % filter is applied to the total reads within each class as displayed in the Total Reads field (center of the console).
Filtered data may be downloaded as a {original name of file}.csv, which uses both the Read Detection filter and Read Threshold % filters set by the user.
The table at the bottom is interactive and allows for searching of fields in the search box. This feature is useful to analyze specific loci or sequences.
The app will continue to run from the R console until "stop" or ESC commands have been sent to R. The GUI can be used to continuously upload files without restarting the app. Simply select "Browse" from the "Choose File" to upload another file for analysis.
