- 01: Data cleaning
- 02a: ML exploration for Cvalue predictors
- 02b: ML exploration for No_bugs predictors
- 04: build a new phylogeny
- 03a: PGLS phylogenetic controlled comparison for CVal
- 03b: PGLS phylogenetic controlled comparison for No_bugs
These data were taken from the EcoFlora database circa 2011.
The original tree however had very few members that overlapped with our data from EcoFlora. I found a more recent phylogeny (https://github.com/megatrees/plant_20221117) and pruned that using the R package U.PhyloMaker in the file newTree.rmd.
Features in the database were often strings, which I have converted to ordinal values for analysis: e.g.
X['dicliny_val'] = X['dicliny_val'].replace({'dioecious':1,\
    'subandroecious':2, \
    'subdioecious':2, \
    'androdioecious':2, \
    'gynodioecious':2, \
    'gynomonoecious':3, \
    'andromonoecious':3, \
    'monoecious':3, \
    'gynoandromonoecious':3, \
    'hermaphrodite':4, \
    'polygamous':4, \
    'trioecious':4})
print(X['dicliny_val'].value_counts())
Resulting in:
hermaphrodite          1228
monoecious              150
gynodioecious           128
gynomonoecious          119
dioecious                70
andromonoecious          45
androdioecious           13
polygamous                7
gynoandromonoecious       4
trioecious                3
subdioecious              1
subandroecious            1
Name: dicliny_val, dtype: int64
4.0    1238
3.0     318
2.0     143
1.0      70
Name: dicliny_val, dtype: int64
print(X['long_val'].value_counts())
# convert <1 to 0.5, 1-2 to 1, 2-10 to 2, 10-100 to 10, 100-500 to 100, >500 to 500
X['long_val'] = X['long_val'].replace({'<1':0.5, '1-2':1, '2-10':2, '10-100':10, '100-500':100, '>500':500})
print(X['long_val'].value_counts())
<1 457
100-500 16
10-100 12
2-10 9
1-2 2
>500 2
Name: long_val, dtype: int64
0.5 457
100.0 16
10.0 12
2.0 9
500.0 2
1.0 2
Name: long_val, dtype: int64
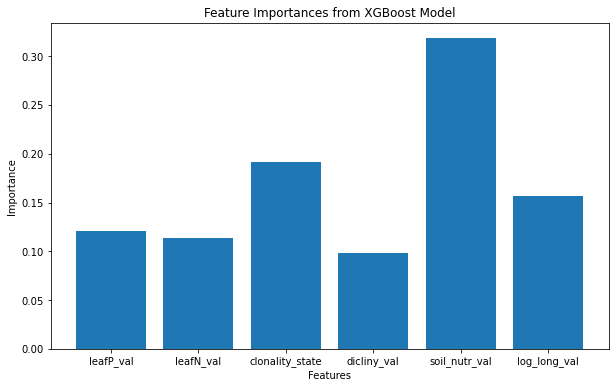
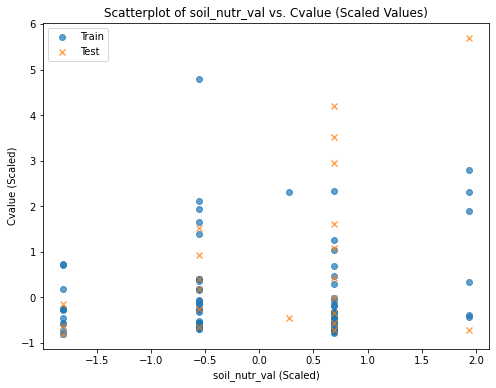
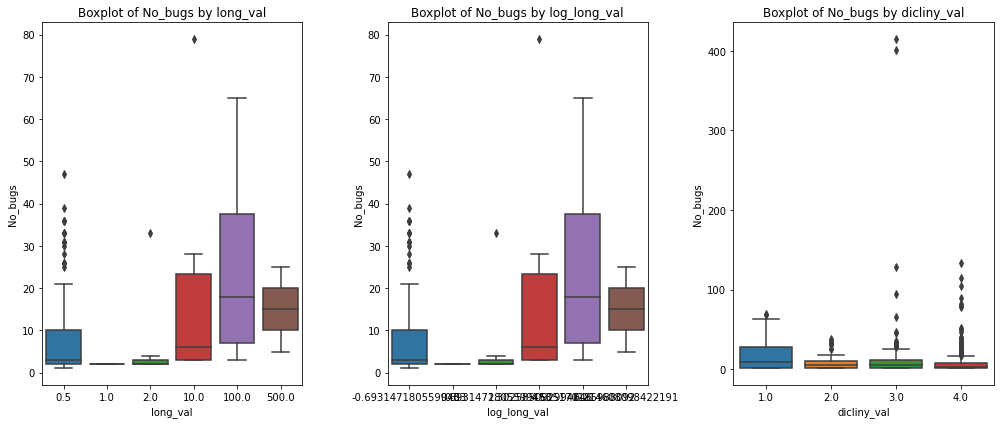
I explored a few approaches to analyse these data including XGboost on the genome size Cval and the number of insect species No_bugs that attack the plant. In doing so, I standardized the values to help the model, and imputed values using KNN. This yeilded some patterns of contribution to the model fit that highlight the importance of soil nutrition in predicting genome size and longevity and dicliny in predicting the number of insect species that attack a plant. However this approach does not account for the non-independence of the data due to shared ancestry.
 Feature importance for genome size
 Feature importance for number of insects
I then used a phylogenetic generalized least squares approach to account for the shared ancestry of the data. This approach is a linear model that includes a covariance matrix that accounts for the shared ancestry of the data.
Key takeaways: Cvalue is only correlated with soil nutrition.
           Mixed Linear Model Regression Results
===========================================================
Model:              MixedLM  Dependent Variable:  Cval
No. Observations:   95       Method:              REML
No. Groups:         95       Scale:               45.9730
Min. group size:    1        Log-Likelihood:      -338.6647
Max. group size:    1        Converged:           Yes
Mean group size:    1.0
-----------------------------------------------------------
                Coef.  Std.Err.   z    P>|z|  [0.025 0.975]
-----------------------------------------------------------
const           -3.616    6.428 -0.563 0.574 -16.214  8.983
leafP_val        1.655    1.874  0.883 0.377  -2.018  5.328
leafN_val       -0.070    0.210 -0.332 0.740  -0.481  0.342
clonality_state -0.274    3.704 -0.074 0.941  -7.533  6.986
dicliny_val      2.106    1.299  1.621 0.105  -0.440  4.653
soil_nutr_val    2.506    1.178  2.127 0.033   0.197  4.814
log_long_val    -0.946    0.935 -1.012 0.312  -2.778  0.886
Group Var       45.973
===========================================================
 The number of insect species described as affecting a species is correlated with longevity. And negatively related to dicliny (not sure how to interpret that, the greater the dicliny value, the more hermaphroditic it is. See above for coding of age and dicliny levels.)
          Mixed Linear Model Regression Results
==========================================================
Model:              MixedLM Dependent Variable: No_bugs
No. Observations:   741     Method:             REML
No. Groups:         741     Scale:              98.1787
Min. group size:    1       Log-Likelihood:     -3000.6010
Max. group size:    1       Converged:          Yes
Mean group size:    1.0
----------------------------------------------------------
                Coef.  Std.Err.   z    P>|z| [0.025 0.975]
----------------------------------------------------------
const            8.714    0.516 16.874 0.000  7.702  9.726
log_long_val     4.118    0.888  4.639 0.000  2.378  5.858
NP_ratio        -0.718    1.881 -0.382 0.703 -4.405  2.968
clonality_state  0.317    0.461  0.688 0.492 -0.586  1.220
dicliny_val     -2.164    0.288 -7.507 0.000 -2.728 -1.599
soil_nutr_val    1.015    0.885  1.147 0.251 -0.719  2.749
Group Var       98.179
==========================================================
