influxdb ruby gem
The configuration options are pretty straight forward.
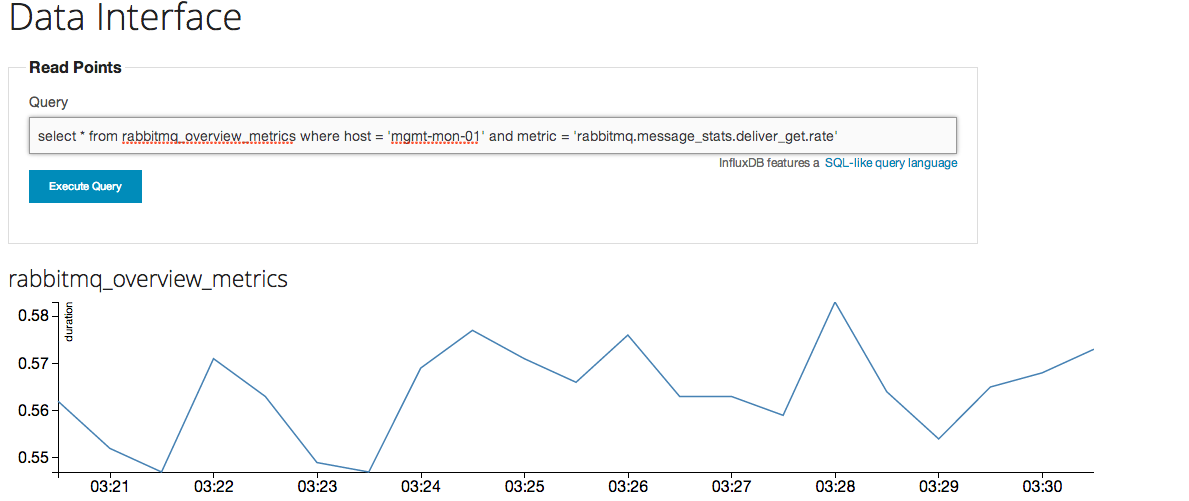
Metrics are inserted into the database with a table per check name. So if you're using the rabbitmq_overview_metrics plugin, you'd have a table in the defined database called rabbitmq_overview_metrics with the following columns:
- host
- metric.name1
- metric.name2
Eg with the load-metrics.rb the following series would be generated:
┌────────────┬─────────────────┬────────────────────────────────────────┬──────────────┬───────────────┬──────────────────┐
│ time       │ sequence_number │ host                                   │ load_avg.one │ load_avg.five │ load_avg.fifteen │
├────────────┼─────────────────┼────────────────────────────────────────┼──────────────┼───────────────┼──────────────────┤
│ 1414548271 │ 209090001       │ default-ubuntu-1404-i386.vagrantup.com │ 1.00         │ 0.89          │ 0.53             │
│ 1414548261 │ 209080001       │ default-ubuntu-1404-i386.vagrantup.com │ 1.00         │ 0.89          │ 0.52             │
│ 1414548251 │ 209070001       │ default-ubuntu-1404-i386.vagrantup.com │ 1.00         │ 0.88          │ 0.52             │
│ 1414548241 │ 209060001       │ default-ubuntu-1404-i386.vagrantup.com │ 1.00         │ 0.88          │ 0.51             │
│ 1414548231 │ 209050001       │ default-ubuntu-1404-i386.vagrantup.com │ 1.00         │ 0.87          │ 0.51             │
│ 1414548221 │ 209040001       │ default-ubuntu-1404-i386.vagrantup.com │ 1.00         │ 0.87          │ 0.50             │
│ 1414548211 │ 209030001       │ default-ubuntu-1404-i386.vagrantup.com │ 1.00         │ 0.87          │ 0.50             │
│ 1414548201 │ 209020001       │ default-ubuntu-1404-i386.vagrantup.com │ 1.00         │ 0.86          │ 0.49             │
│ 1414548191 │ 209010001       │ default-ubuntu-1404-i386.vagrantup.com │ 1.00         │ 0.86          │ 0.49             │
│ 1414548181 │ 209000001       │ default-ubuntu-1404-i386.vagrantup.com │ 1.00         │ 0.85          │ 0.48             │
└────────────┴─────────────────┴────────────────────────────────────────┴──────────────┴───────────────┴──────────────────┘
Additionally a duration column would be present based on the time it took the check to run (this is gleaned from the sensu event data).
The value for metric is determined based on the value of strip_metric described below. You can query it like so:
Note that the first push of this was a handler that could be called via pipe. This is now an actual extension that's more performant since it's actually in the sensu-server runtime. Additionally it's now using batch submission to InfluxDB by writing all the points for a given series at once.
Just drop the file in /etc/sensu/extensions and add it to your metrics configuration (/etc/sensu/conf.d/handlers/metrics.json:
{
  "handlers": {
    "metrics": {
      "type": "set",
      "handlers": [ "debug", "influxdb"]
    }
  }
}{
"influxdb": {
"host": "localhost",
"port": "8086",
"user": "stats",
"password": "stats",
"database": "stats",
"strip_metric": "somevalue"
}
}Host, port, user, password and database are pretty straight forward. strip_metric however might not be. This is used to "clean up" the data sent to influxdb. Normally everything sent to handlers is akin to the graphite/stats style:
something.host.metrictype.foo.bar
or
host.stats.something.foo.bar
Really the pattern is irrelevant. People have different tastes. Adding much of that data to the column name in InfluxDB is rather silly so strip_metric provides you with a chance to add a value that strips off everything up to (and including that value). This allows you to continue sending to graphite or statsd or whatever and still use this handler.
Using the examples above, if you set the strip_metric to host, then the column in InfluxDB would be called metrictype.foo.bar or stats.something.foo.bar. If you set the value to foo then the column would simply be called foo
Note that strip_metric isn't required.
