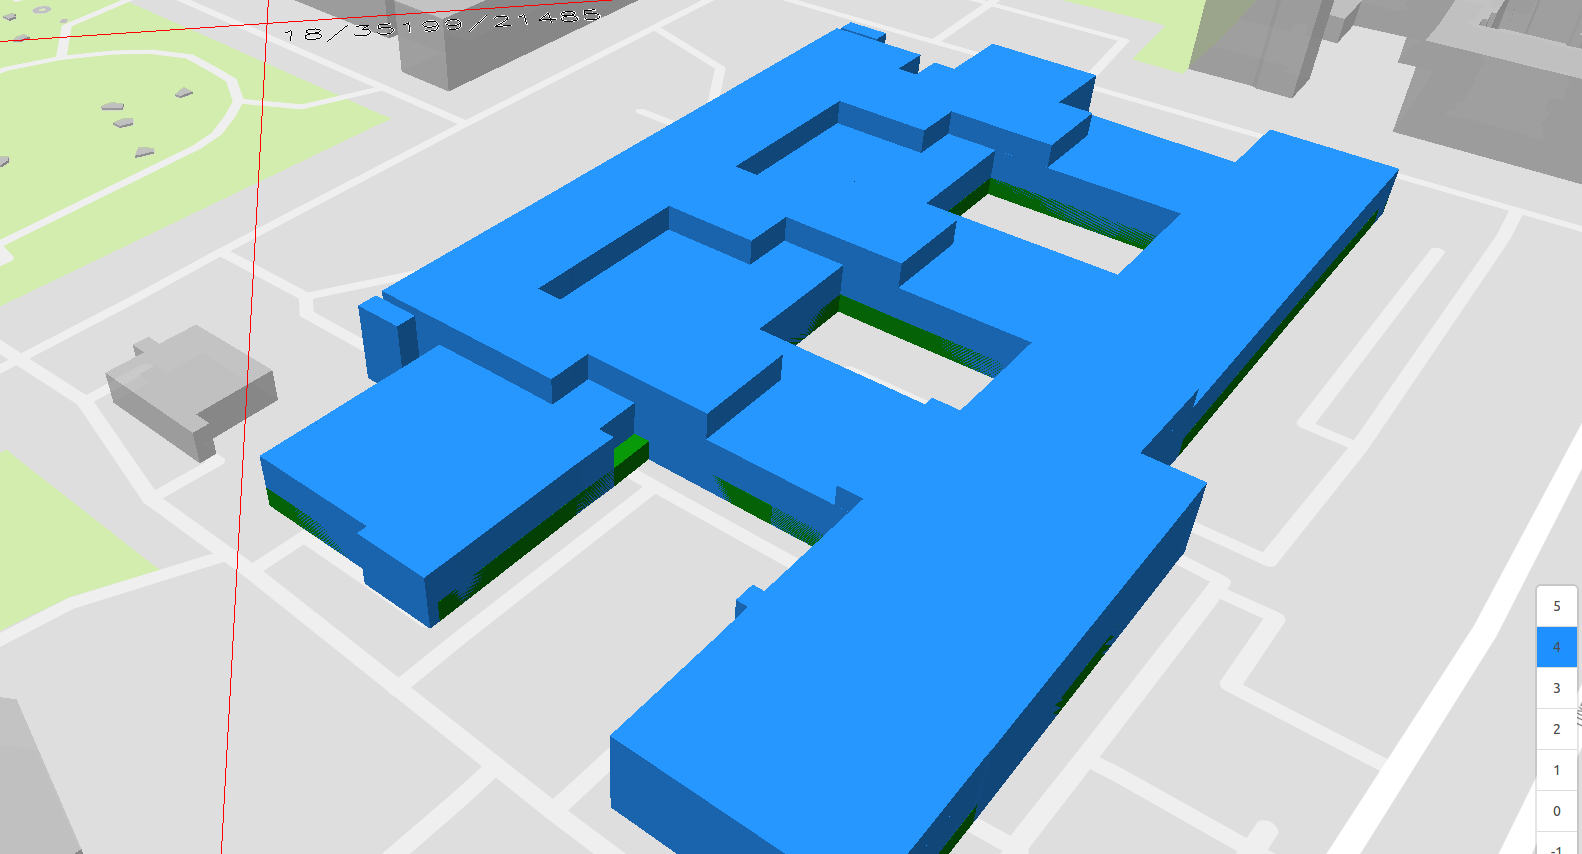
Web client for the visualization of OpenStreetMap Indoor data. Work in progress For this visualization two vector sources are used. Mapbox vector tiles and another source with indoor data. The Web view library is Mapbox GL. These components allow a performant visualization of this data.
Working example here.
For the development and growing process of OSM Indoor Data it needs a consumer which is able to interpret the existing data and give an example what can be done with it. It is not new that people map a lot more objects if they can see the result of a map afterwards. Therefore this web client is an illustration of how to render and visualize OSM Indoor Data. It is a side project with no further goal than showing interested people what can be done with OSM indoor data. Another very good visualization of Indoor Data in OSM is OpenLevelUp!
For general map features like streets, rivers and parks common Mapbox vector tiles are used. However, for building data Mapzen vector tile data is used. They are easier to handle for geographical calculation because of some important information(properties) which Mapbox tiles don't deliver.
For indoor features a special vector source is used. This source delivers data with indoor features like rooms, corridors and many more objects. This data is from OSM but its not delivered either through Mapbox or Mapzen. The source consists of a PostgreSQL database which is updated once an hour(OSM2PostgreSQL) with new OSM data. Data is delivered through a Geoserver WFS-Service. The reliability of OSM tagging schema can be confusing sometimes. Especially because of this the tags are postprocessed before they go into the database. Although most of it only concerns the level tag.
In OSM is no link between buildings and indoor data. The only way of knowing to which building indoor data belongs to is the geographical position. For the visualization of indoor features to a certain building on this map, a logic is implemented:
- Query all building-polygons in the screen.
- In case of tile-border: put together these polygons.
- Evaluate size of all buildings.
- calculate the distance from the center of the screen to all buildings.
- Decide which building is selected by the user in dependency to size and distance.
- Use the selected building to query indoor features from WFS Geoserver. A simple intersect query is used.
- The selected building is not visualized as an 3D object - selection between building with indoor data and all other buildings.
some more stuff to add...
