Jeremy Jordan
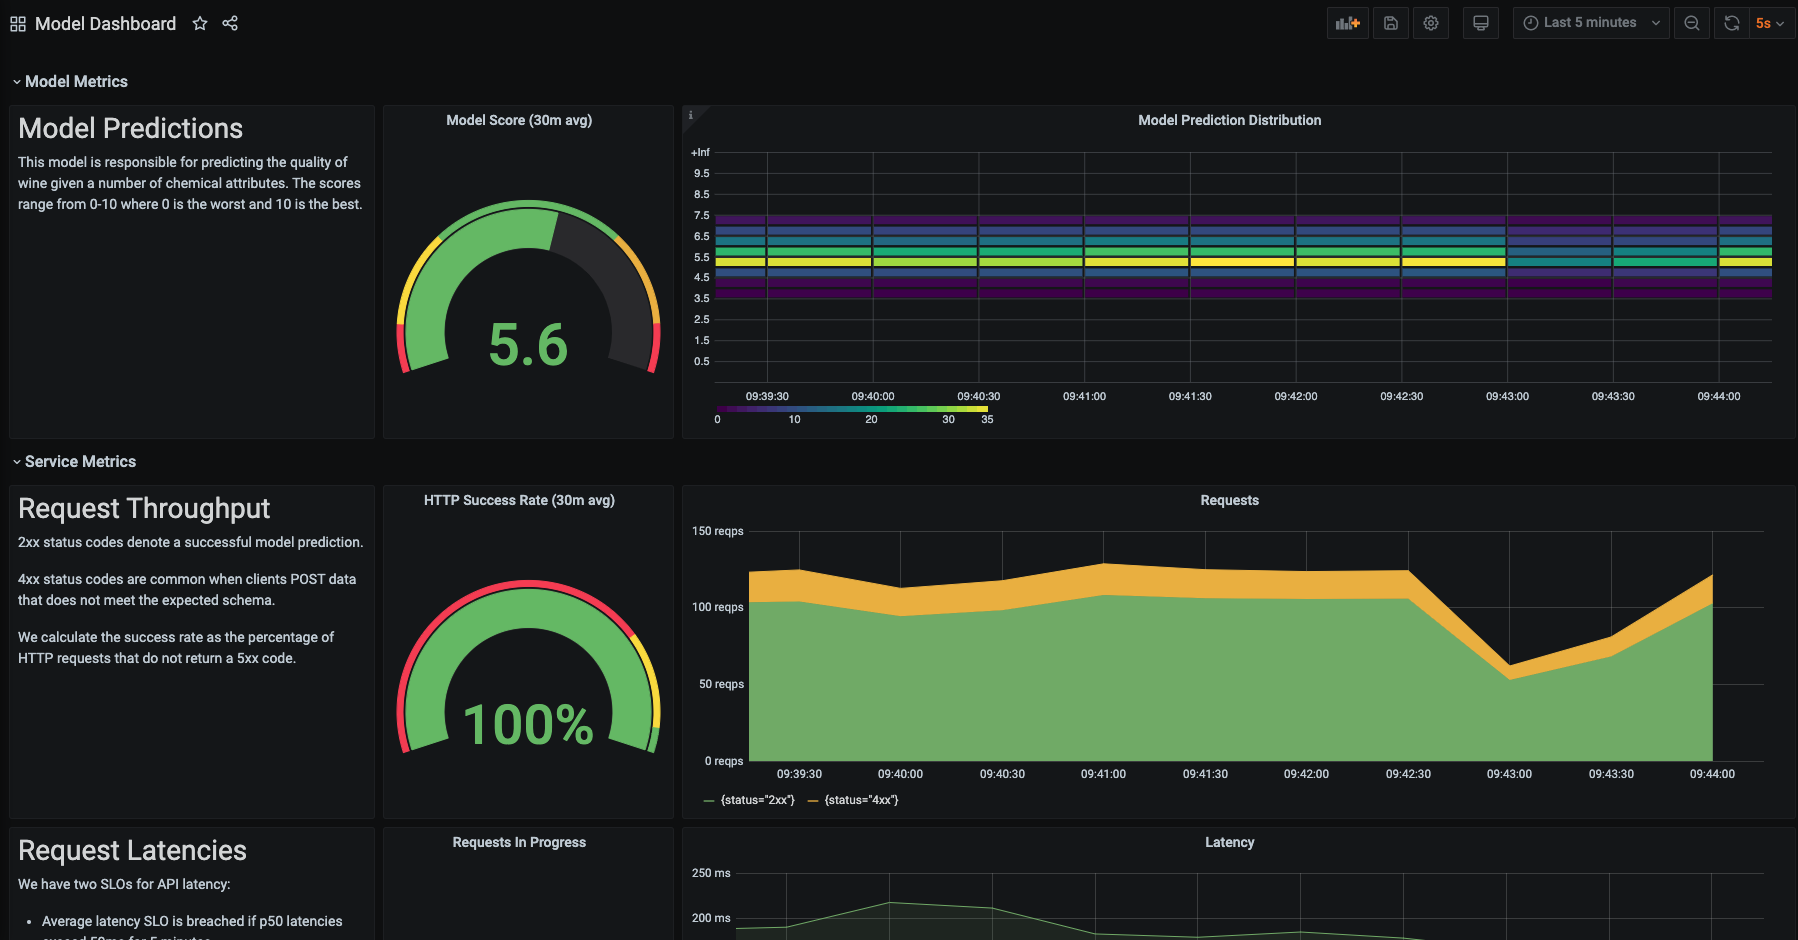
This repository provides an example setup for monitoring an ML system deployed on Kubernetes.
Blog post: https://www.jeremyjordan.me/ml-monitoring/
Components:
- ML model served via
FastAPI - Export server metrics via
prometheus-fastapi-instrumentator - Simulate production traffic via
locust - Monitor and store metrics via
Prometheus - Visualize metrics via
Grafana
- Ensure you can connect to a Kubernetes cluster and have
kubectlandhelminstalled.- You can easily spin up a Kubernetes cluster on your local machine using minikube.
minikube start --driver=docker --memory 4g --nodes 2
- Deploy Prometheus and Grafana onto the cluster using the community Helm chart.
kubectl create namespace monitoring
helm repo add prometheus-community https://prometheus-community.github.io/helm-charts
helm install prometheus-stack prometheus-community/kube-prometheus-stack -n monitoring
- Verify the resources were deployed successfully.
kubectl get all -n monitoring
- Connect to the Grafana dashboard.
kubectl port-forward svc/prometheus-stack-grafana 8000:80 -n monitoring
- Go to http://127.0.0.1:8000/
- Log in with the credentials:
- Username: admin
- Password: prom-operator
- (This password can be configured in the Helm chart
values.yamlfile)
- Import the model dashboard.
- On the left sidebar, click the "+" and select "Import".
- Copy and paste the JSON defined in
dashboards/model.jsonin the text area.
This repository includes an example REST service which exposes an ML model trained on the UCI Wine Quality dataset.
You can launch the service on Kubernetes by running:
kubectl apply -f kubernetes/models/
You can also build and run the Docker container locally.
docker build -t wine-quality-model -f model/Dockerfile model/
docker run -d -p 3000:80 -e ENABLE_METRICS=true wine-quality-model
Note: In order for Prometheus to scrape metrics from this service, we need to define a
ServiceMonitorresource. This resource must have the labelrelease: prometheus-stackin order to be discovered. This is configured in thePrometheusresource spec via theserviceMonitorSelectorattribute.
You can verify the label required by running:
kubectl get prometheuses.monitoring.coreos.com prometheus-stack-kube-prom-prometheus -n monitoring -o yaml
We can simulate production traffic using a Python load testing tool called locust. This will make HTTP requests to our model server and provide us with data to view in the monitoring dashboard.
You can begin the load test by running:
kubectl apply -f kubernetes/load_tests/
By default, production traffic will be simulated for a duration of 5 minutes. This can be changed by updating the image arguments in the kubernetes/load_tests/locust_master.yaml manifest.
You can also modify the community Helm chart instead of using the manifests defined in this repo.
This process can eventually be automated with a Github action, but remains manual for now.
- Obtain a personal access token to connect with the Github container registry.
echo "INSERT_TOKEN_HERE" >> ~/.github/cr_token
- Authenticate with the Github container registry.
cat ~/.github/cr_token | docker login ghcr.io -u jeremyjordan --password-stdin
- Build and tag new Docker images.
MODEL_TAG=0.3
docker build -t wine-quality-model:$MODEL_TAG -f model/Dockerfile model/
docker tag wine-quality-model:$MODEL_TAG ghcr.io/jeremyjordan/wine-quality-model:$MODEL_TAG
LOAD_TAG=0.2
docker build -t locust-load-test:$LOAD_TAG -f load_test/Dockerfile load_test/
docker tag locust-load-test:$LOAD_TAG ghcr.io/jeremyjordan/locust-load-test:$LOAD_TAG
- Push Docker images to container registery.
docker push ghcr.io/jeremyjordan/wine-quality-model:$MODEL_TAG
docker push ghcr.io/jeremyjordan/locust-load-test:$LOAD_TAG
- Update Kubernetes manifests to use the new image tag.
To stop the model REST server, run:
kubectl delete -f kubernetes/models/
To stop the load tests, run:
kubectl delete -f kubernetes/load_tests/
To remove the Prometheus stack, run:
helm uninstall prometheus-stack -n monitoring
