America has a electoral participation problem. Our turnout of ~55% of voting age adults for the 2016 presidential election put us below the vast majority of developed democracies around the world. Another notable fact about the 2016 US presidential election was the outcome -- here was a political outsider who played by none of the established rules of politics and came out victorious. Regardless of position on the political spectrum, many have seen his election as a paradigm shift in the American political system. And presumably, there are many voters who in response have sat up to take notice and engaged more in politics in whatever form. So for my classification project I set out to identify these individuals so that organizations could conduct effective outreach to those who are interested.
In order to build a model to approach this question, I looked at this Summer 2017 Pew Research Political Typology survey. One of the 164 questions they asked their ~5,000 respondents was "since Donald Trump’s election, would you say you are paying, more, less, or the same amount of attention to politics as you used to?" I chose this question to represent my predictive target, simplifying the response as a binary classification of either more engaged or not, since we're really only trying to reach out to those who are engaging with renewed interest. In addition I selected 20 other primarily demographic features for ease of gathering when deploying the model to identify more people going forward.
I tried using range of classification models to get some predictive power out of the data. Here are the average results across training cross-validation folds for each just using scikitlearn out of the box implementations:
| Model | Accuracy | Precision | Recall |
|---|---|---|---|
| SVM | 59% | 60% | 71% |
| Logistic Regression | 59% | 61% | 68% |
| Decision Tree | 59% | 54% | 57% |
| K Nearest Neighbors | 58% | 59% | 68% |
| Random Forest | 55% | 58% | 55% |
| Naive Bayes | 54% | 58% | 45% |
I decided to do some further tuning on the support vector machine and the logistic regression. I chose to optimize for recall since the cost for an organization reaching out to an individual predicted to more engaged who actualy wasn't would be minimal, but the opportunity cost of missing out on an individual predicted as not engaged who in fact is what I wanted to minimize going into the project in the first place.
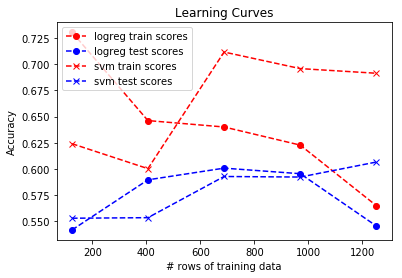
After running a grid search to identify optimal parameters, I generated a learning curve to compare them:
Clearly the logistic regression was too constricted to handle the complexity of the data, but the support vector machine shows a promising trend with the training scores evening out and the test scores continuing to get better.
So after some continued tuning on the svm, I ended up with the following final results.
| Data | Accuracy | Precision | Recall |
|---|---|---|---|
| Training (cross-fold avg) | 61% | 61% | 80% |
| Test | 56% | 54% | 72% |
Not too bad! In order to get a better sense of what was going on with the model, I built a simple web app to allow input of a few features to generate a prediction. I chose these features using the random forest's feature importance, and playing with them did seem to allow for a range of prediction and confidence. Here's a screenshot to get a sense of the app.
This project is a promising first step toward the stated goal of providing a simple tool to identify those who are paying more attention in response to the 2016 election in order to reach out and engage them. In order to improve it, I would like to go back and do a more methodical process of feature selection on the initial 164 questions to see if I could come up with a better list of questions. Additionally, it would be ideal to gather more data beyond this single Pew research survey. As mentioned before, the learning curve above suggests that adding more data would continue to improve the model. As such, I would like to build the capacity into the web app to confirm or refute it's prediction for those filling it out, so it could incorporate that data for further improvements.

