Palo Alto Networks PAN-OS v9.x Elastic Stack v6.x Configuration
The goal of this project was to create a configuration which parses and stores ALL syslog fields within PAN-OS v9.x. Most other configurations I came across required editing which fields PAN-OS sent, which inherently meant loss of data fidelity.
Currently this configuration correctly parses all fields from the following log types:
- Traffic
- Threat (including URL Filtering Logs)
- User-ID (Coming Soon)
For a complete description of all of the syslog fields for PAN-OS v9.x please see the documentation below: https://docs.paloaltonetworks.com/pan-os/9-0/pan-os-admin/monitoring/use-syslog-for-monitoring/syslog-field-descriptions.html
Installation Instructions:
First follow the excellent instructions available online for setting up the following components:
- Logstash, Elasticsearch & Kibana v6.x
After the setup perform the following:
Firewall(s)/Panorama:
- Configure both the traffic and the threat logs to be sent to the Logstash server on port 5514 (both TCP and UDP are supported).
- Reference PAN-OS v9.x Documentation: https://docs.paloaltonetworks.com/pan-os/9-0/pan-os-admin/monitoring/use-syslog-for-monitoring/syslog-field-descriptions.html
Logstash:
- Copy PAN-OS.conf to the Logstash configuration location and restart the service.
Elasticsearch:
- Put the Elasticsearch templates provided in this repository with the following commands:
curl -XPUT http://<your-elasticsearch-server>:9200/_template/traffic?pretty -H 'Content-Type: application/json' -d @traffic_template_mapping-v1.1.json
curl -XPUT http://<your-elasticsearch-server>:9200/_template/threat?pretty -H 'Content-Type: application/json' -d @threat_template_mapping-v1.1.json
Kibana:
- Create the index patterns for both traffic and threat with the time filter of @timestamp.
- Optionally upload the Visualizations provided in the Visualizations sub-directory.
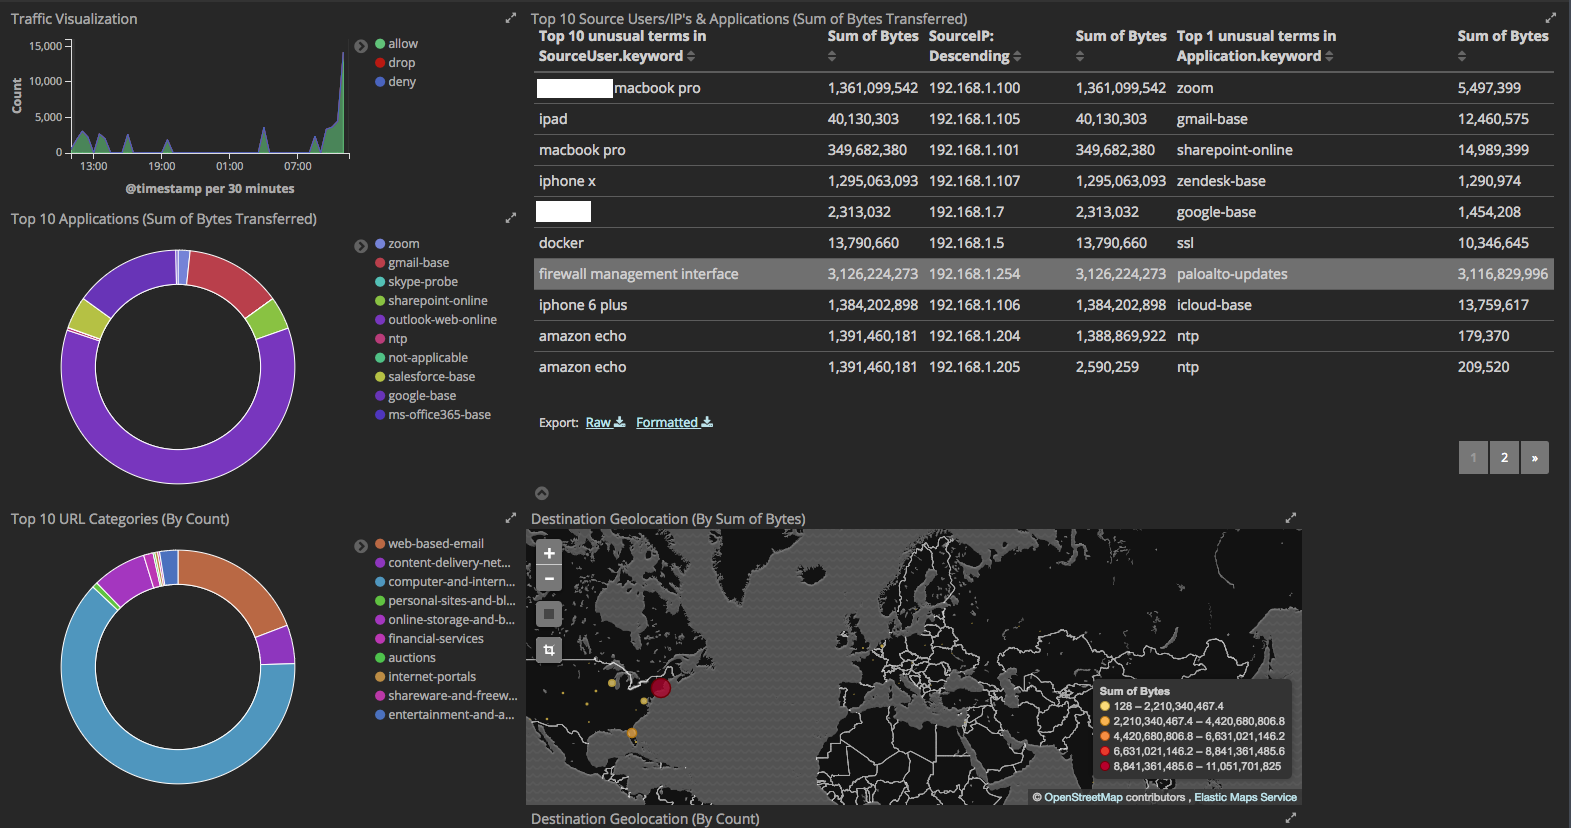
Example Visualization Provided: