- Is a NodeJS based tool
- For measuring browser performance metrics (like frame rates, expensive layouts, paints, styles, etc.)
- For Web pages, Cordova/Phonegap and other Hybrid applications.
- Metrics are measured while mimicking real user interactions - clicking buttons, typing content, etc.
- Tool collects the metrics from sources like
about:tracing, Chrome Devtools timeline, IE UI Responsiveness tab, Xperf, etc. - Monitor this information regularly by integrating the tool with continuous integration systems.
Read more on why browser-perf here.
Please see the wiki pages for more information. You can find information about supported browsers, getting started, command line usage, reference for the Node API etc.
Install the tool using npm install -g browser-perf and then run
$ browser-perf http://yourwebsite.com --browsers=chrome,firefox --selenium=ondemand.saucelabs.com --username=username --accesskey=accesskey
- Replace username and access key with the saucelabs.com username and accesskey
- If you have Selenium set up, you could substitute
ondemand.saucelabs.comwithlocalhost:4444/wd/hub - You can also use BrowserStack credentials and substitute
ondemand.saucelabs.comwithhub.browserstack.com
See the wiki page for an extensive list of command line options and more usage scenarios.
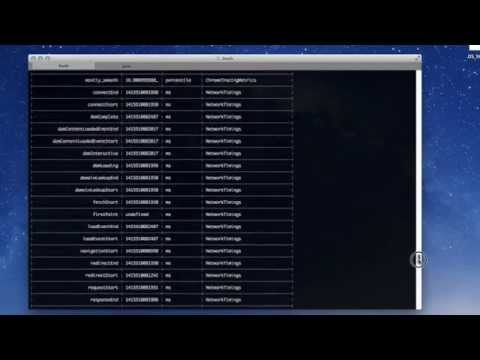
Here is a video of the command line usage
browser-perf is also a node module and has the following API
var browserPerf = require('browser-perf');
browserPerf('/*URL of the page to be tested*/', function(err, res) {
	// res - array of objects. Metrics for this URL
	if (err) {
		console.log('ERROR: ' + err);
	} else {
		console.log(res);
	}
}, {
	selenium: 'http://localhost:4444/wd/hub',
	browsers: ['chrome', 'firefox']
	username: SAUCE_USERNAME // if running tests on the cloud
});
See the API wiki page for more details on configuring. Instructions on using it for Cordova apps is also on the wiki
- Websites can become slow
- over time as more CSS and Javascript is added
- due to a single commit that adds expensive CSS (like gradients)
- We use tools in Chrome or Internet Explorer only when the site is too slow.
- Tools like YSlow and Page Speed are great, but will it not be better if the are a part of continuous integration?
- Tools like this(http://npmjs.org/package/browser-perf) and Phantomas can fill the gap to monitor site performance every time a checkin is performed.
Licensed under BSD-2 Clause. See License.txt for more details
Please ping me if you would need help setting this up.
