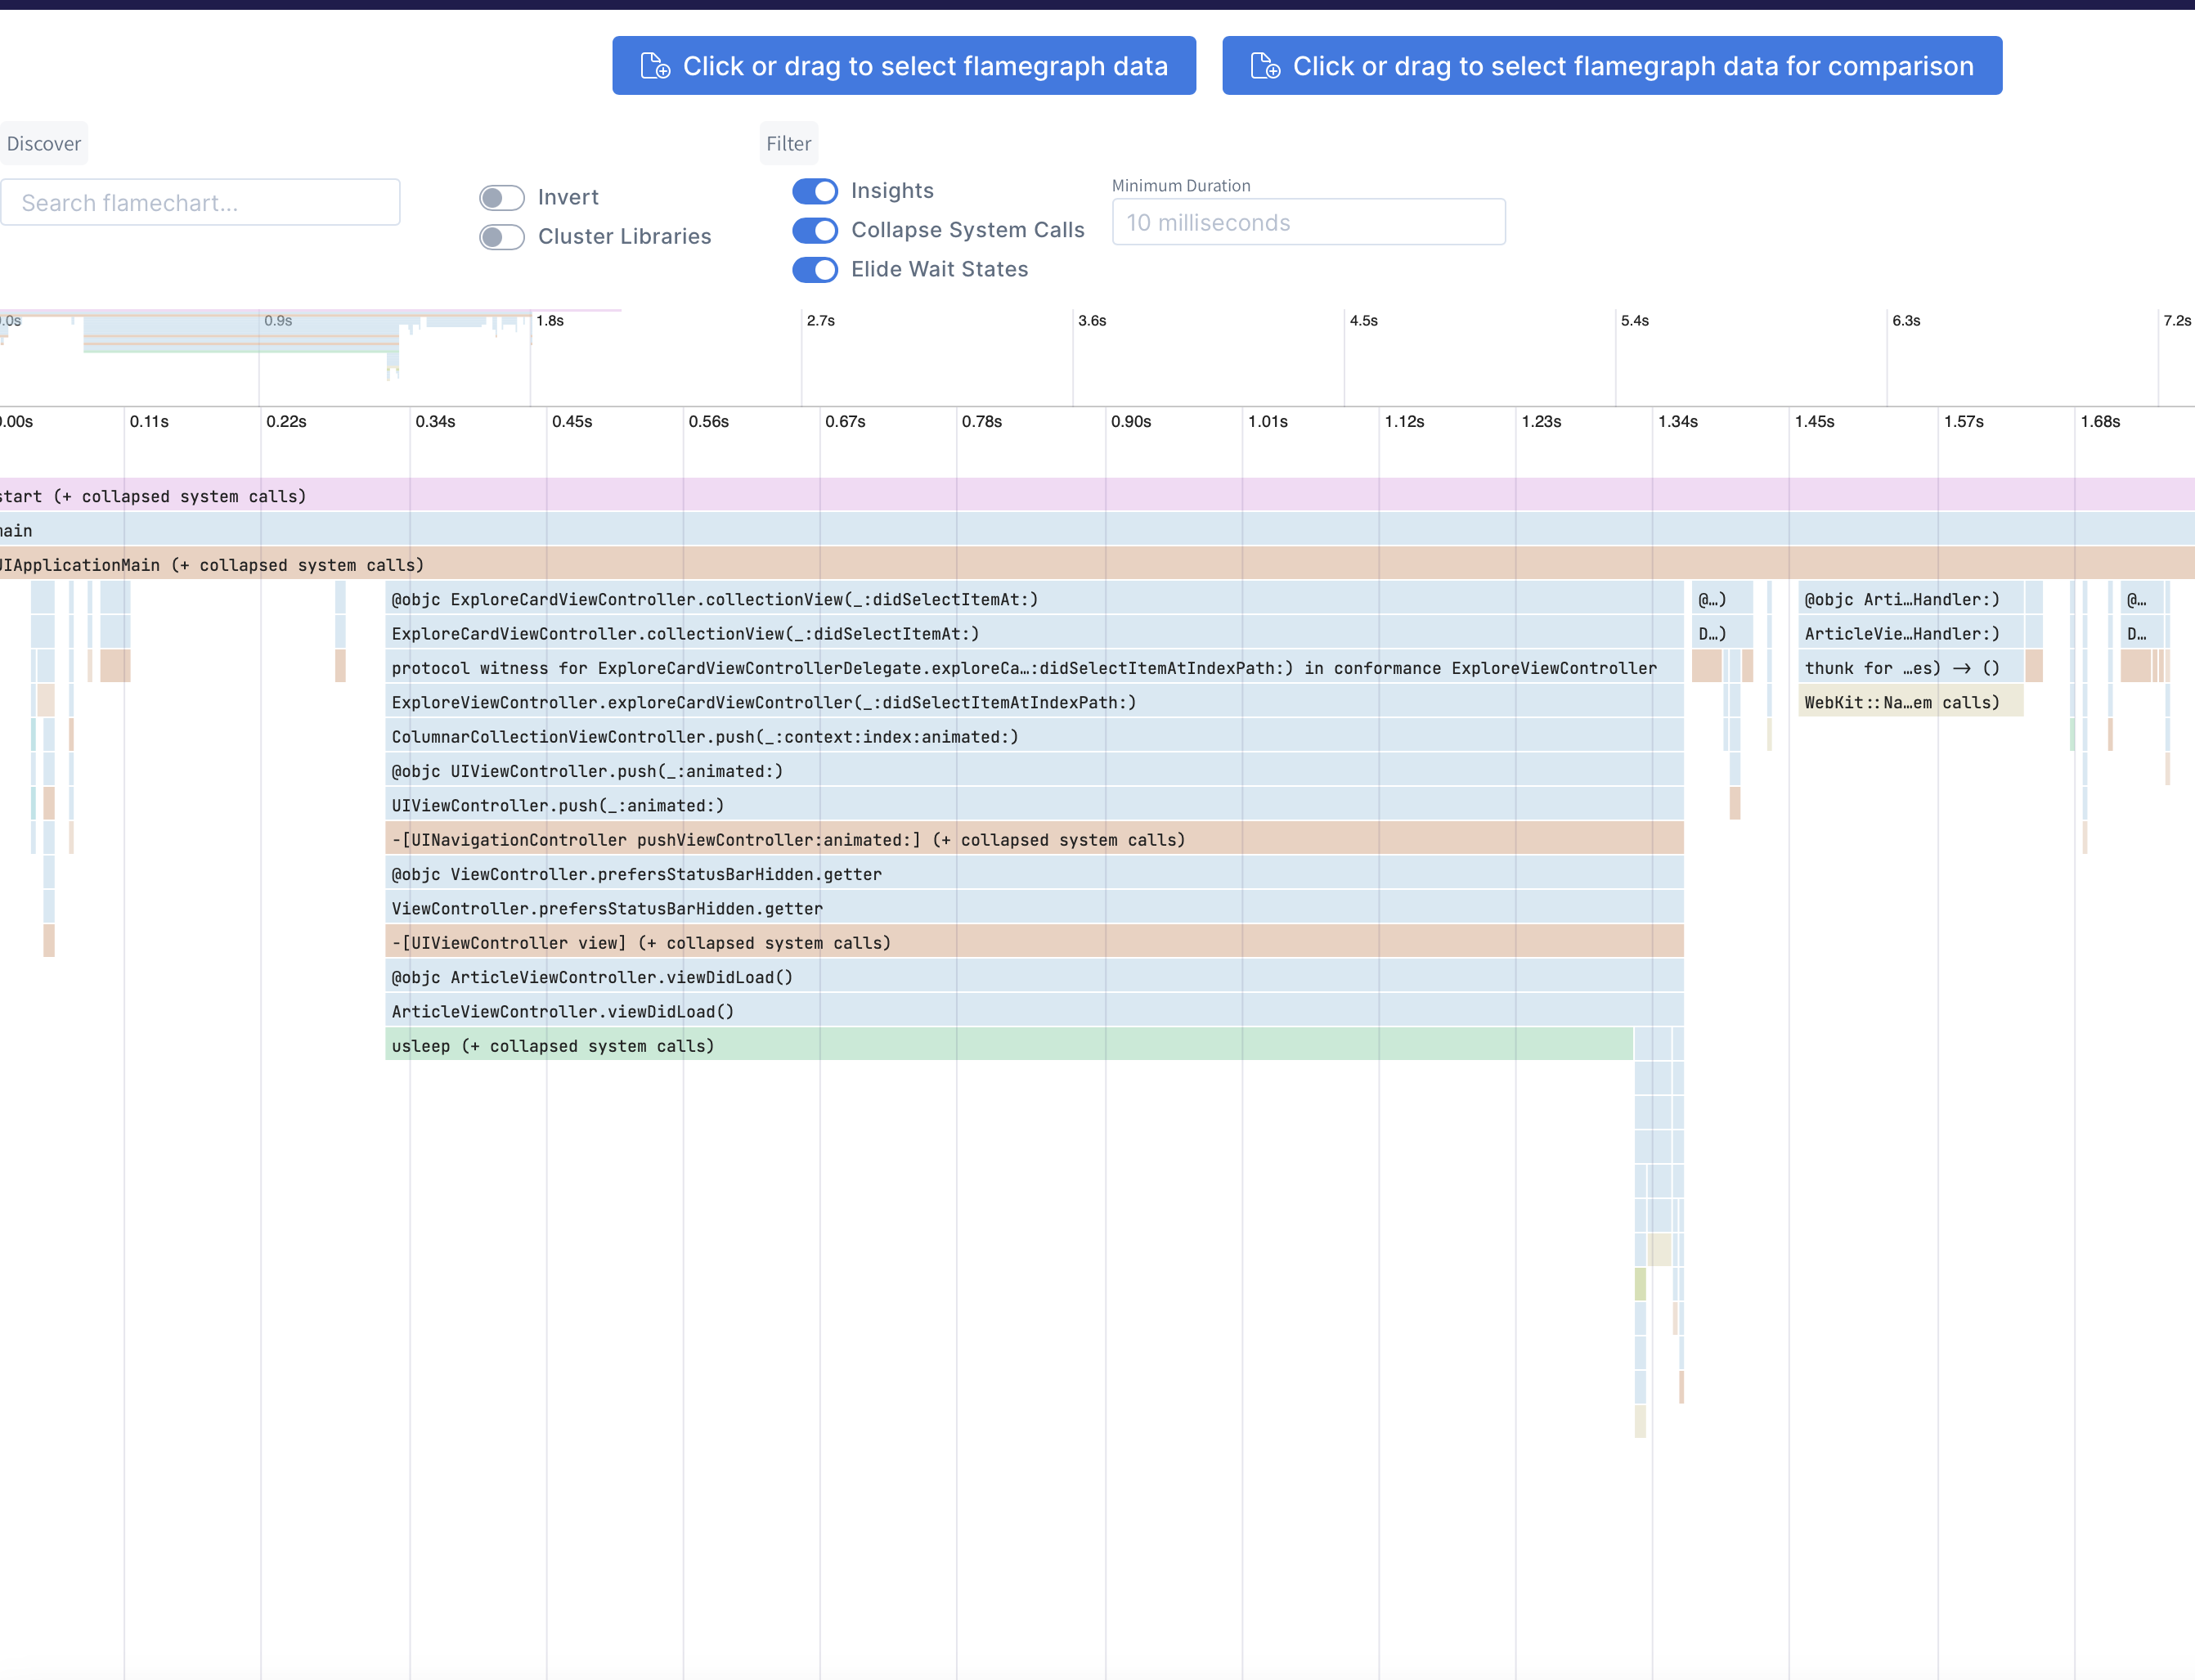
Locally measure performance of your app, without Xcode or Instruments. Read all about it in the launch blog post
Run pod install in the ETTrace folder. Modify the code signing team in ETTrace/ETTrace.xcworkspace to your own team. Run ./build.sh to build the xcframework ETTrace.xcframework. Link the xcframework to your app.
Install the runner with brew install emergetools/homebrew-tap/ettrace
Launch your app and run ettrace or ettrace --simulator. After profiling, the result will be displayed on https://emergetools.com/flamegraph
Note: Always launch the app by manually tapping the icon on the iOS homescreen, running the app through Xcode can result in inaccurate results.
You can point ettrace to a folder containing your dsyms with the --dsyms flag. If the dsyms are indexed by spotlight they will be automatically found and used.
Use the flag --launch to start recording on app launch. When you first connect to the app using this flag, the app will force quit. On the next launch it will start profiling automatically and capture all of your main function. In some cases you need to record the first launch after an install. You can't use the --launch flag for this because that requires re-launching the app. Instead, add a boolean set to YES in your Info.plist with the key ETTraceRunAtStartup. You can then run ettrace regularly, without the --launch flag, and still start profiling at the start of app launch.
Since iOS 16, dyld4 will pre-compute many protocol conformances leading to faster apps. Xcode Instruments uses DYLD_INSERT_LIBRARIES which disables this optimization. ETTrace does not disable it, so you can see the actual performance users will observe.
ETTrace spawns a new thread which captures a stacktrace of the main thread periodically. This is sampling based profiling. The sampling thread starts either when ettrace.framework is loaded (+load method), or when the CLI sends a message to the application. These control messages and the sampled data are communicated using PeerTalk.
