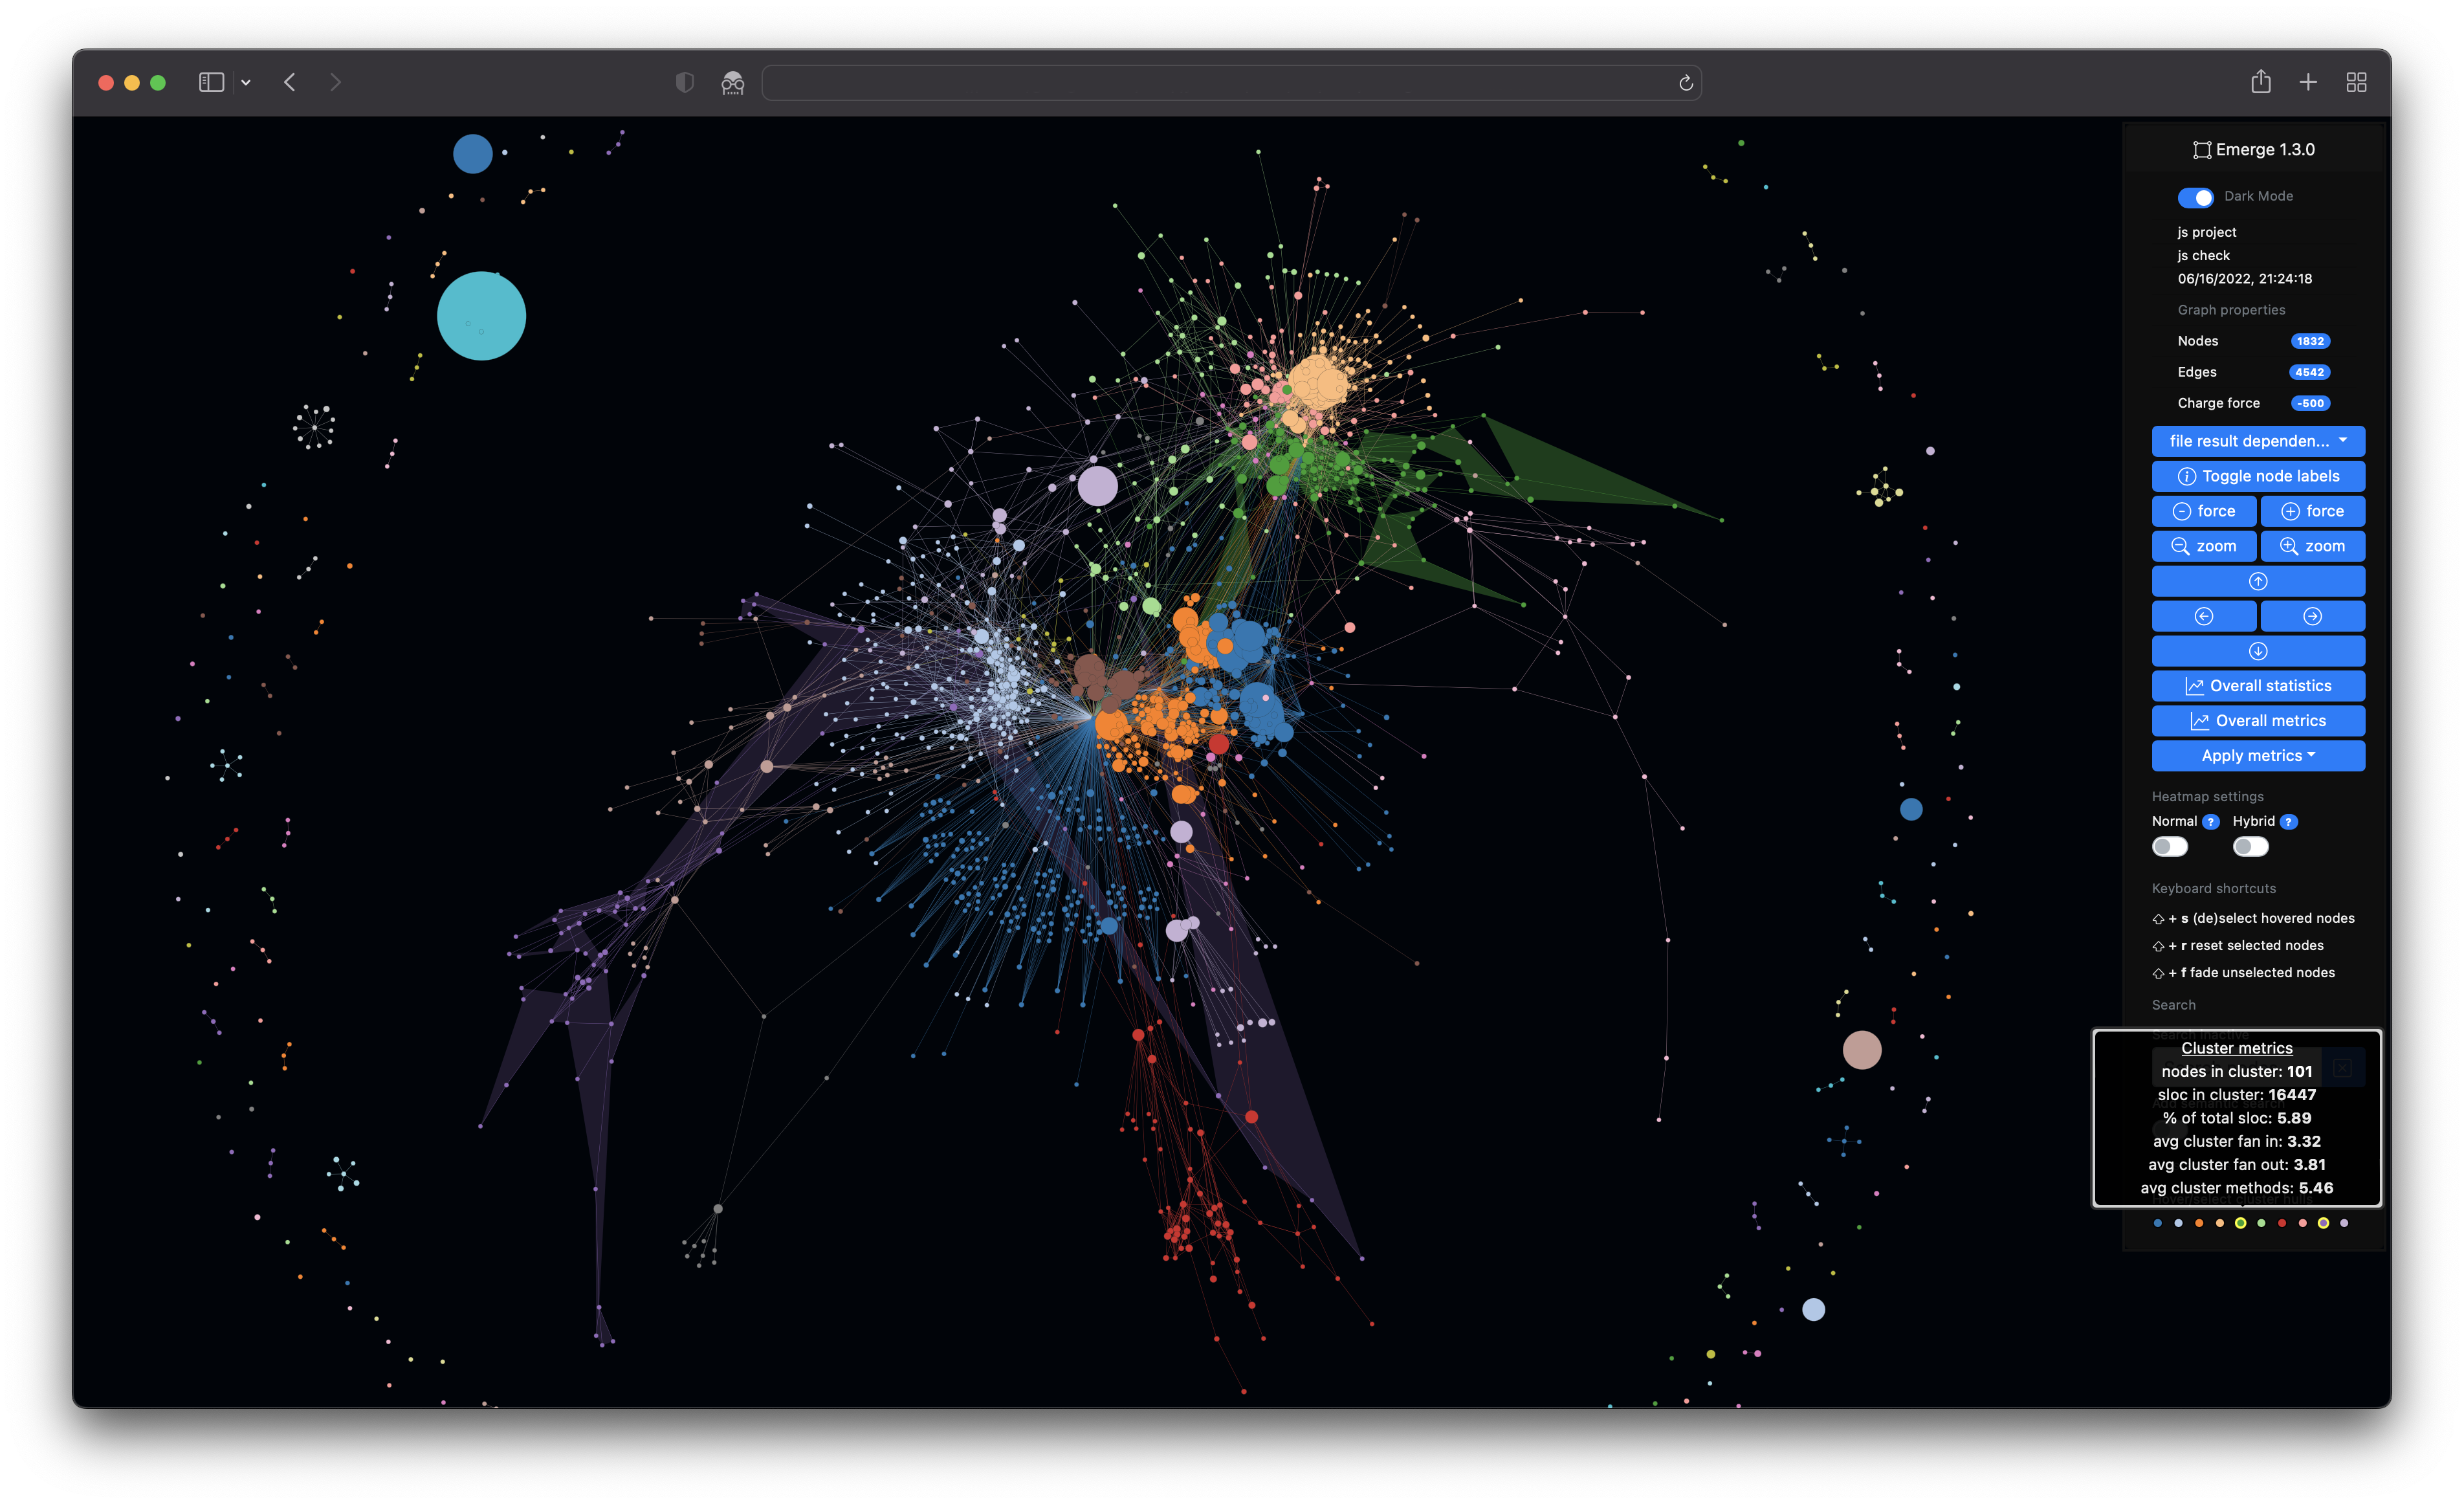
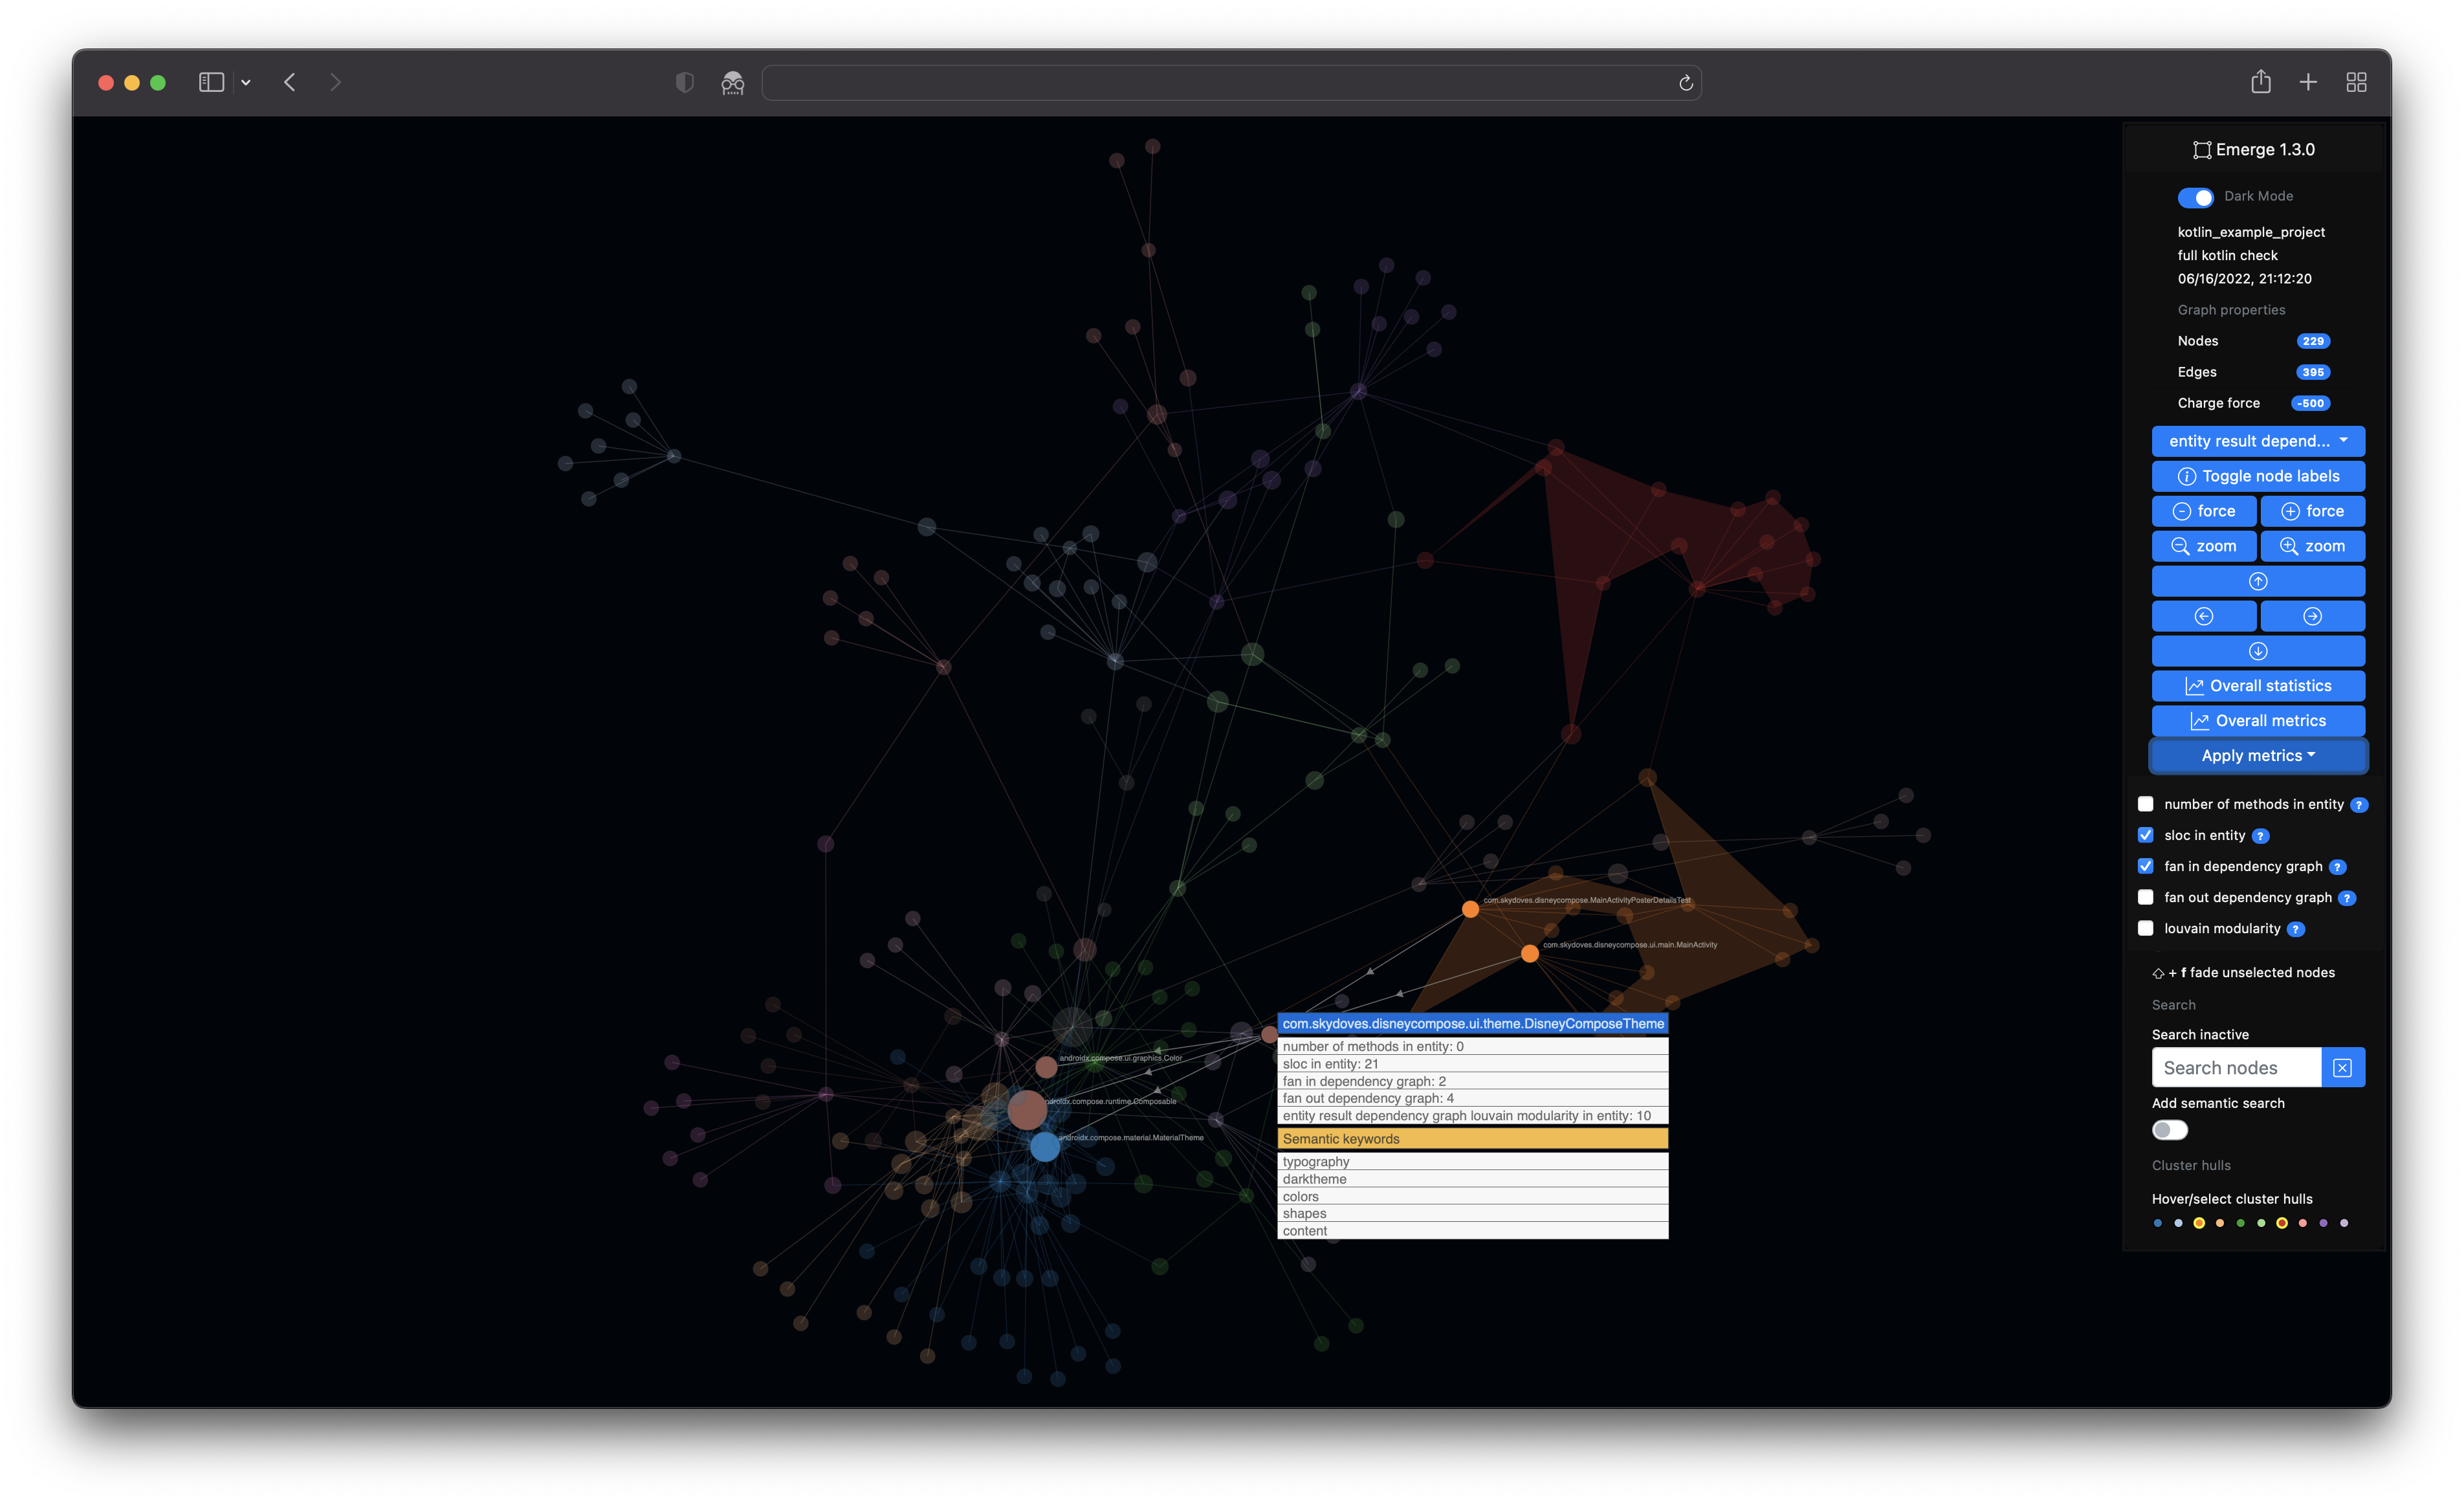
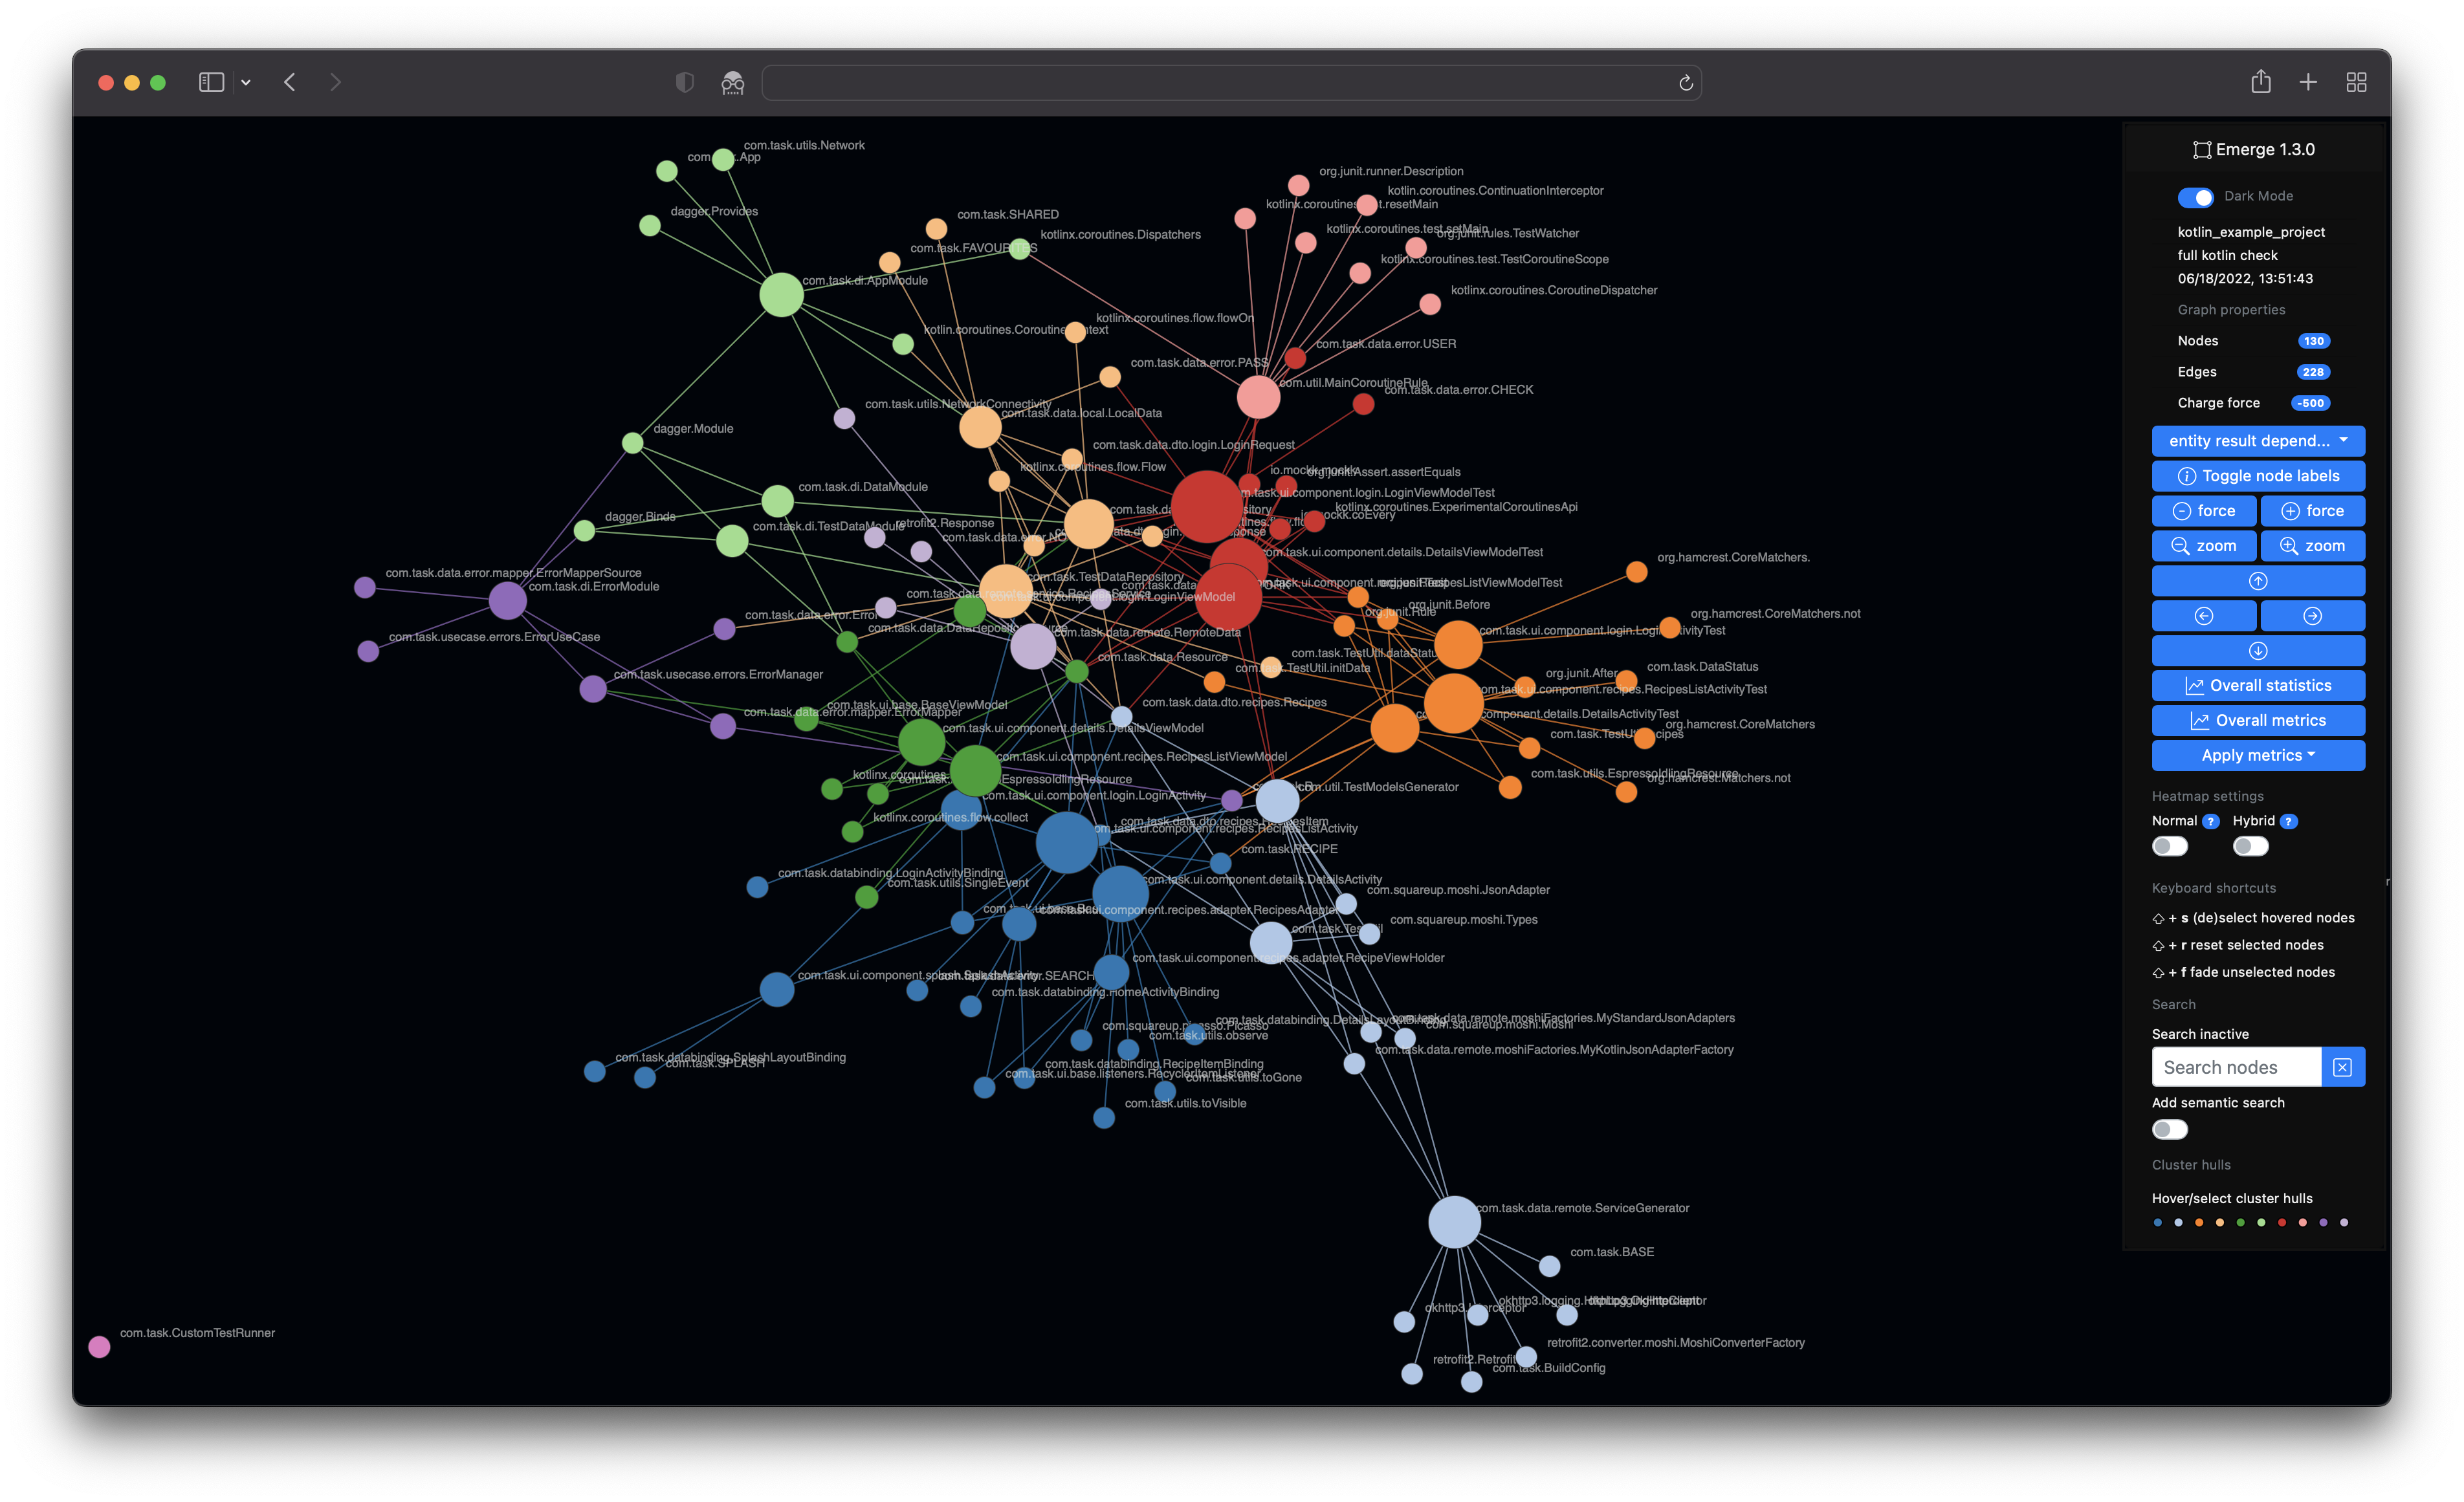
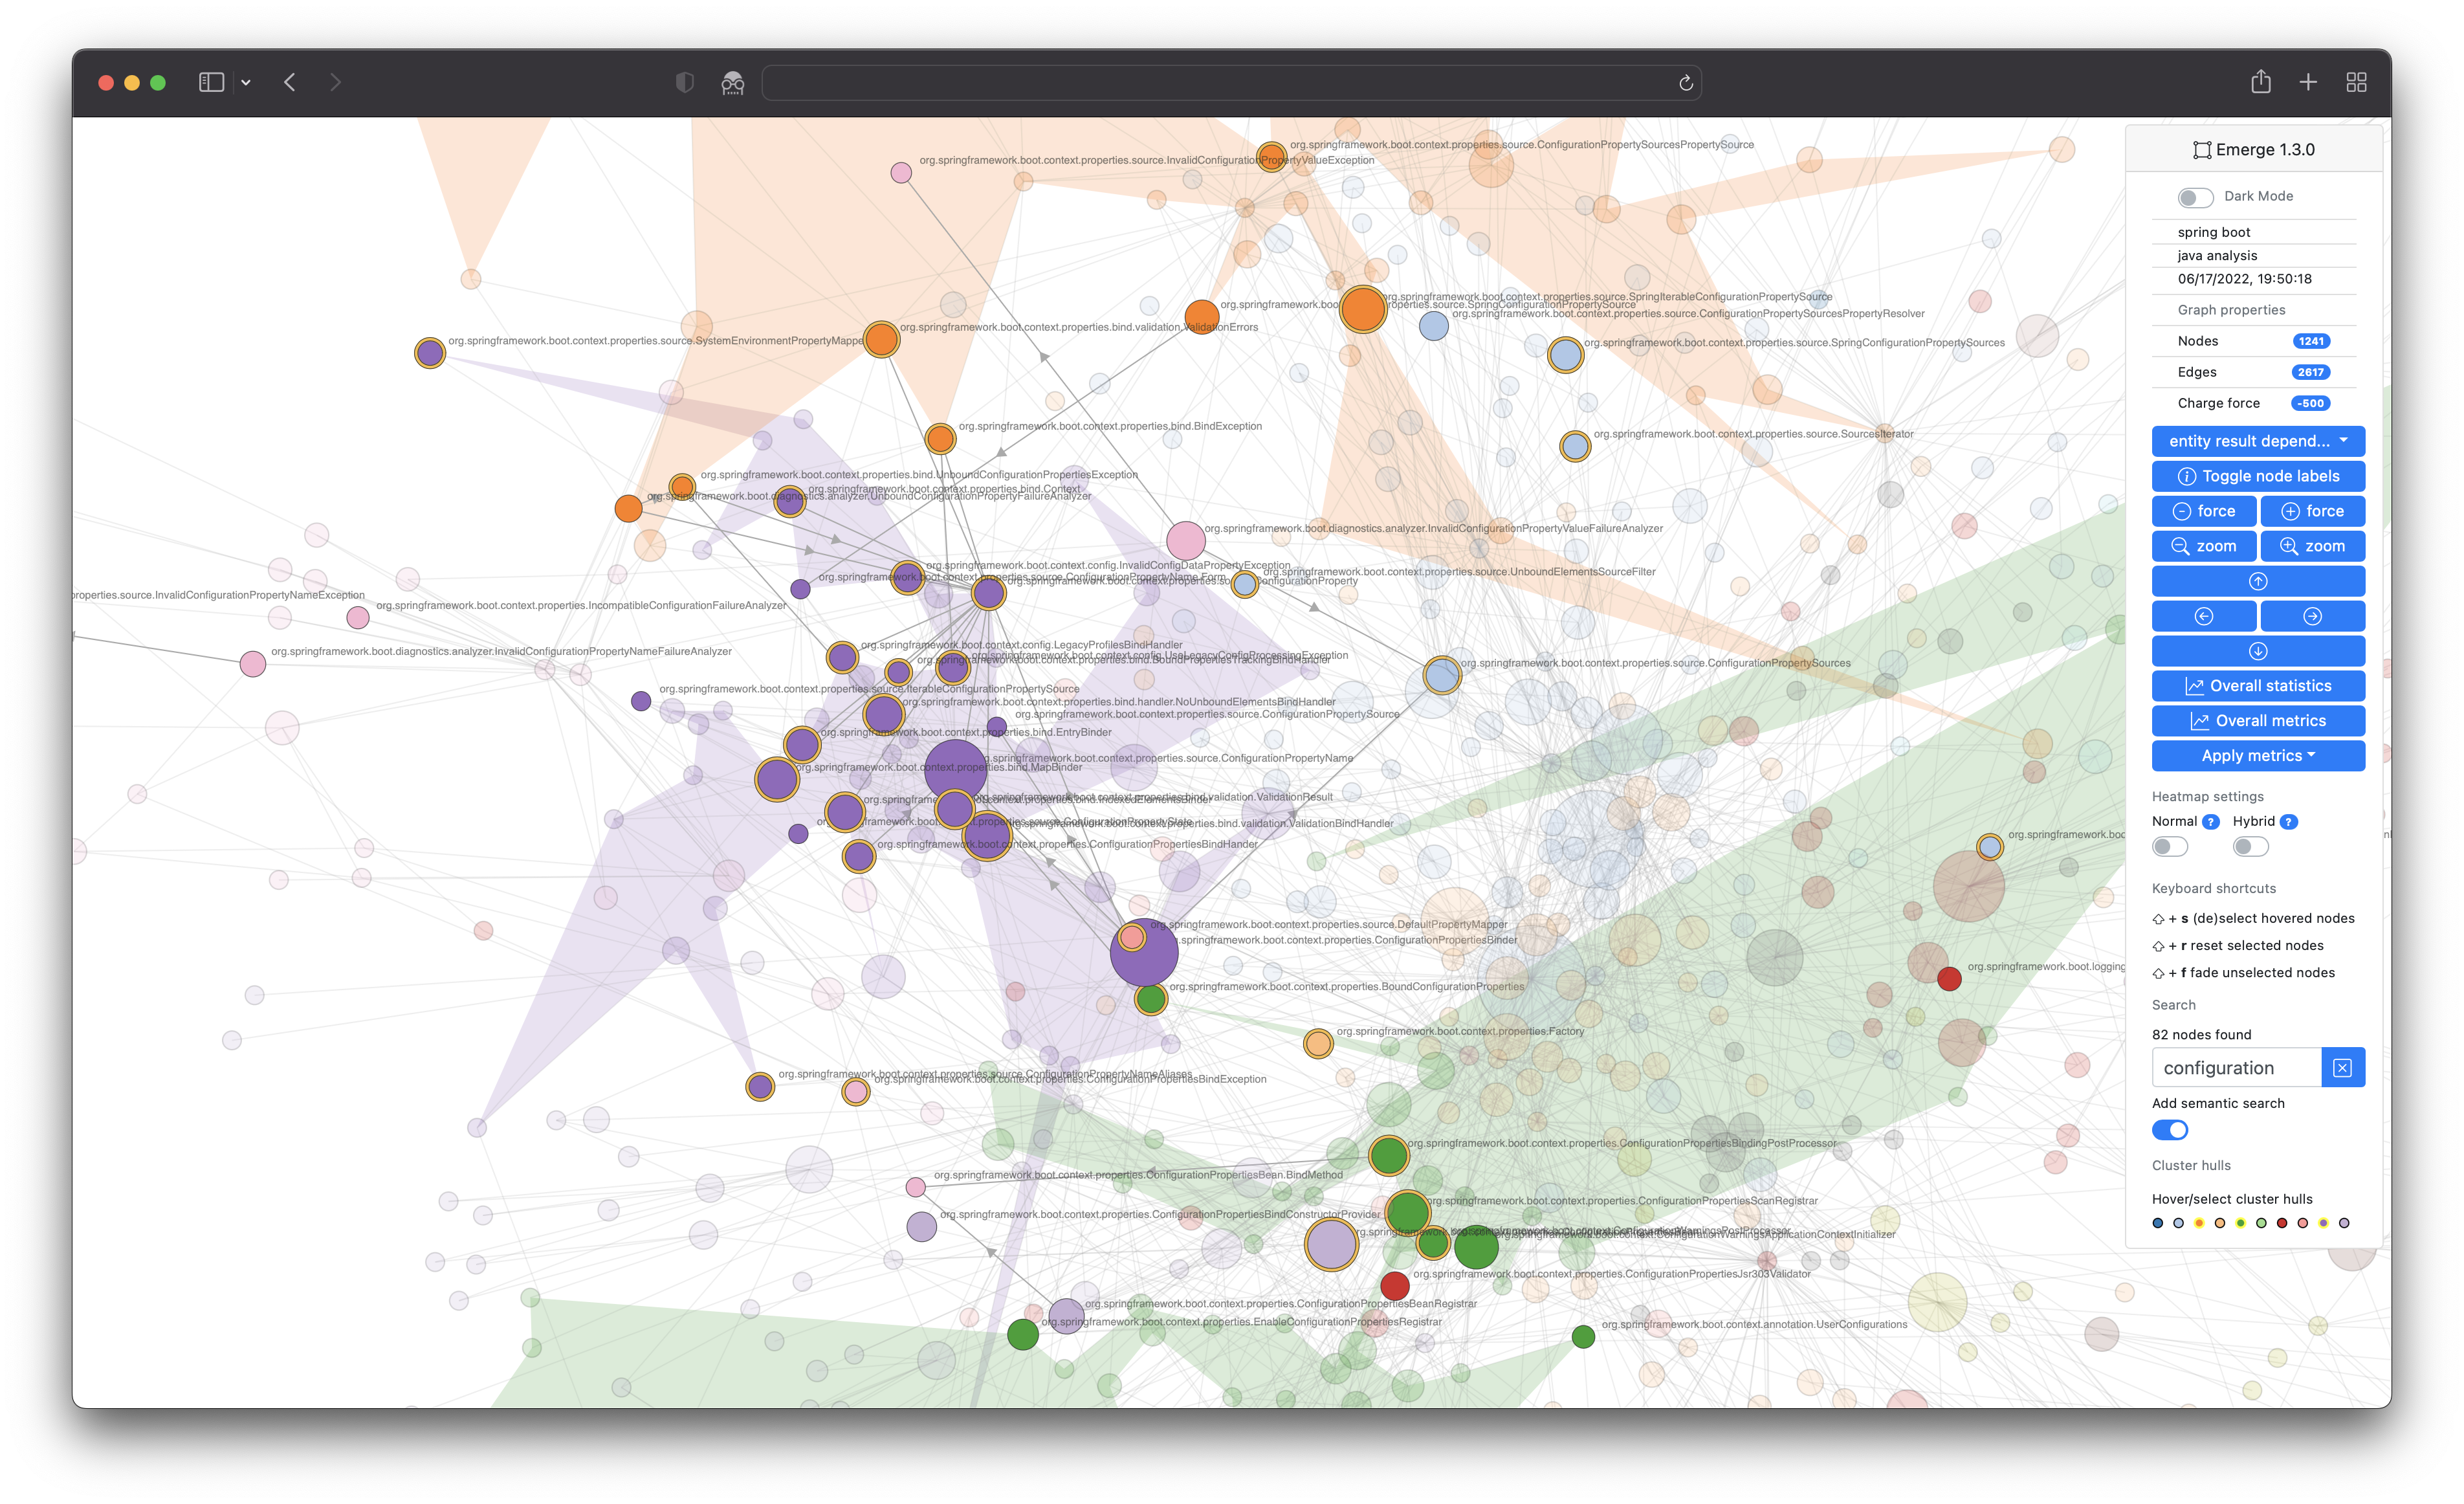
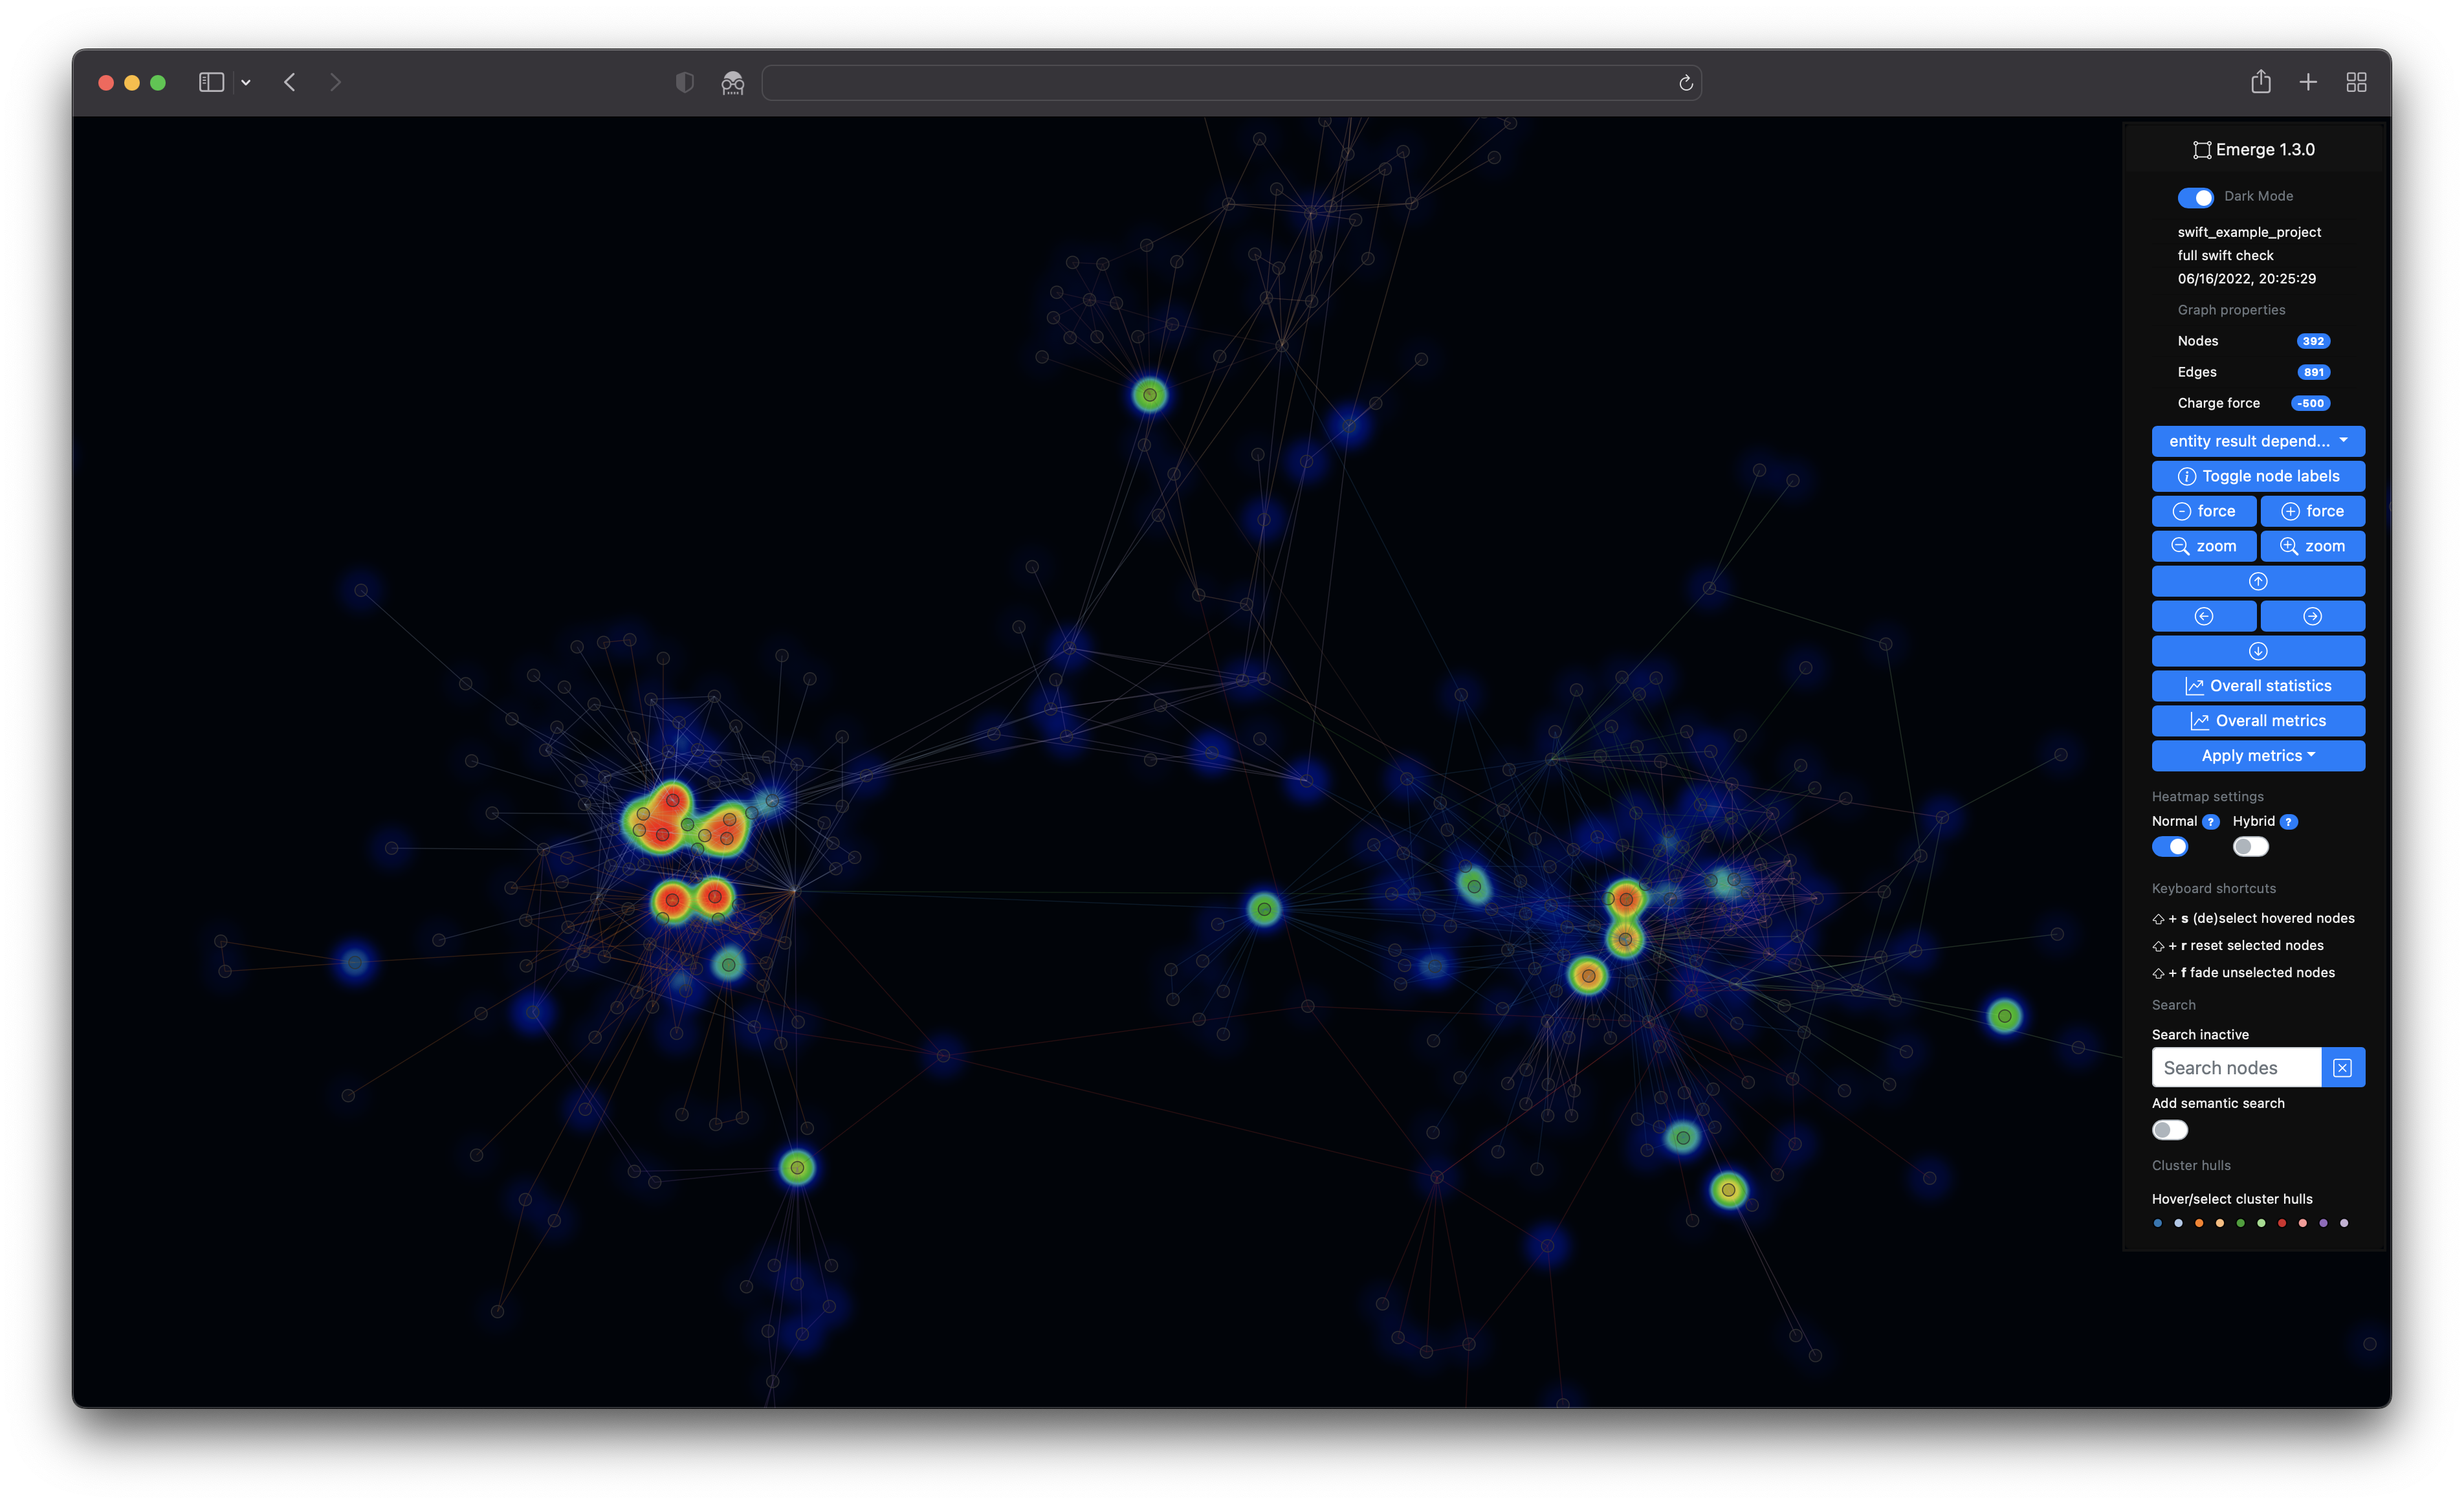
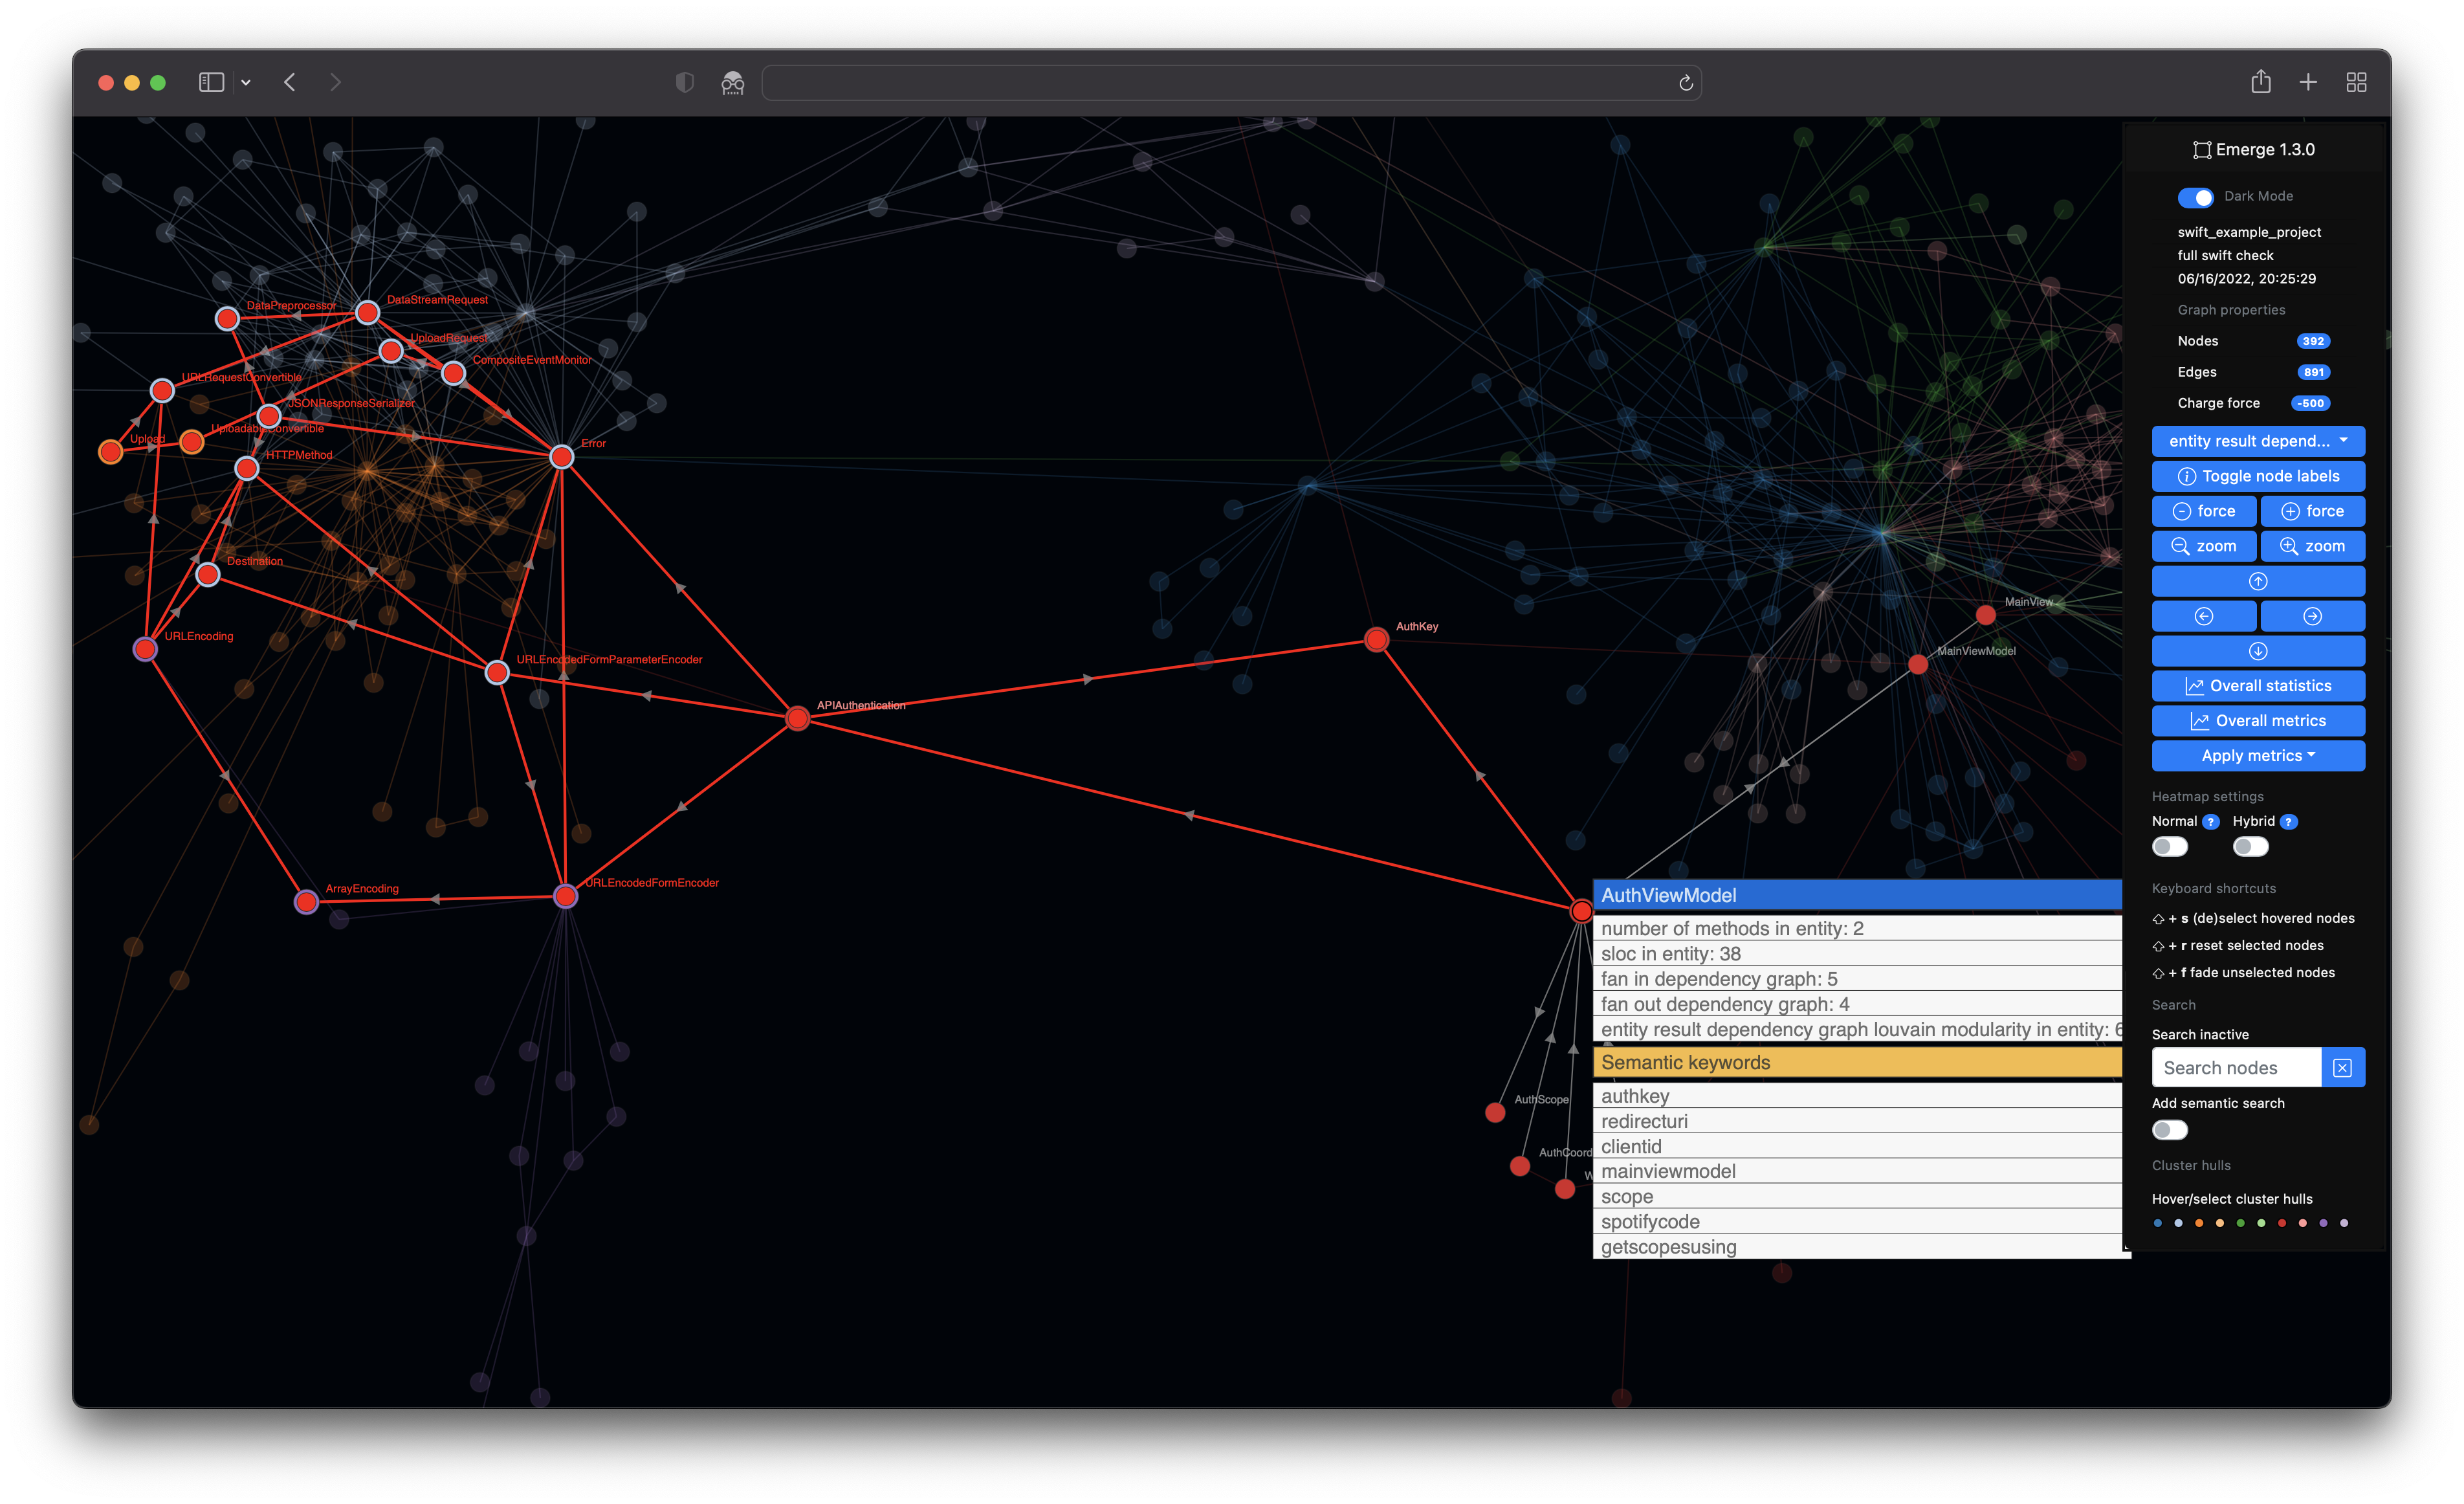
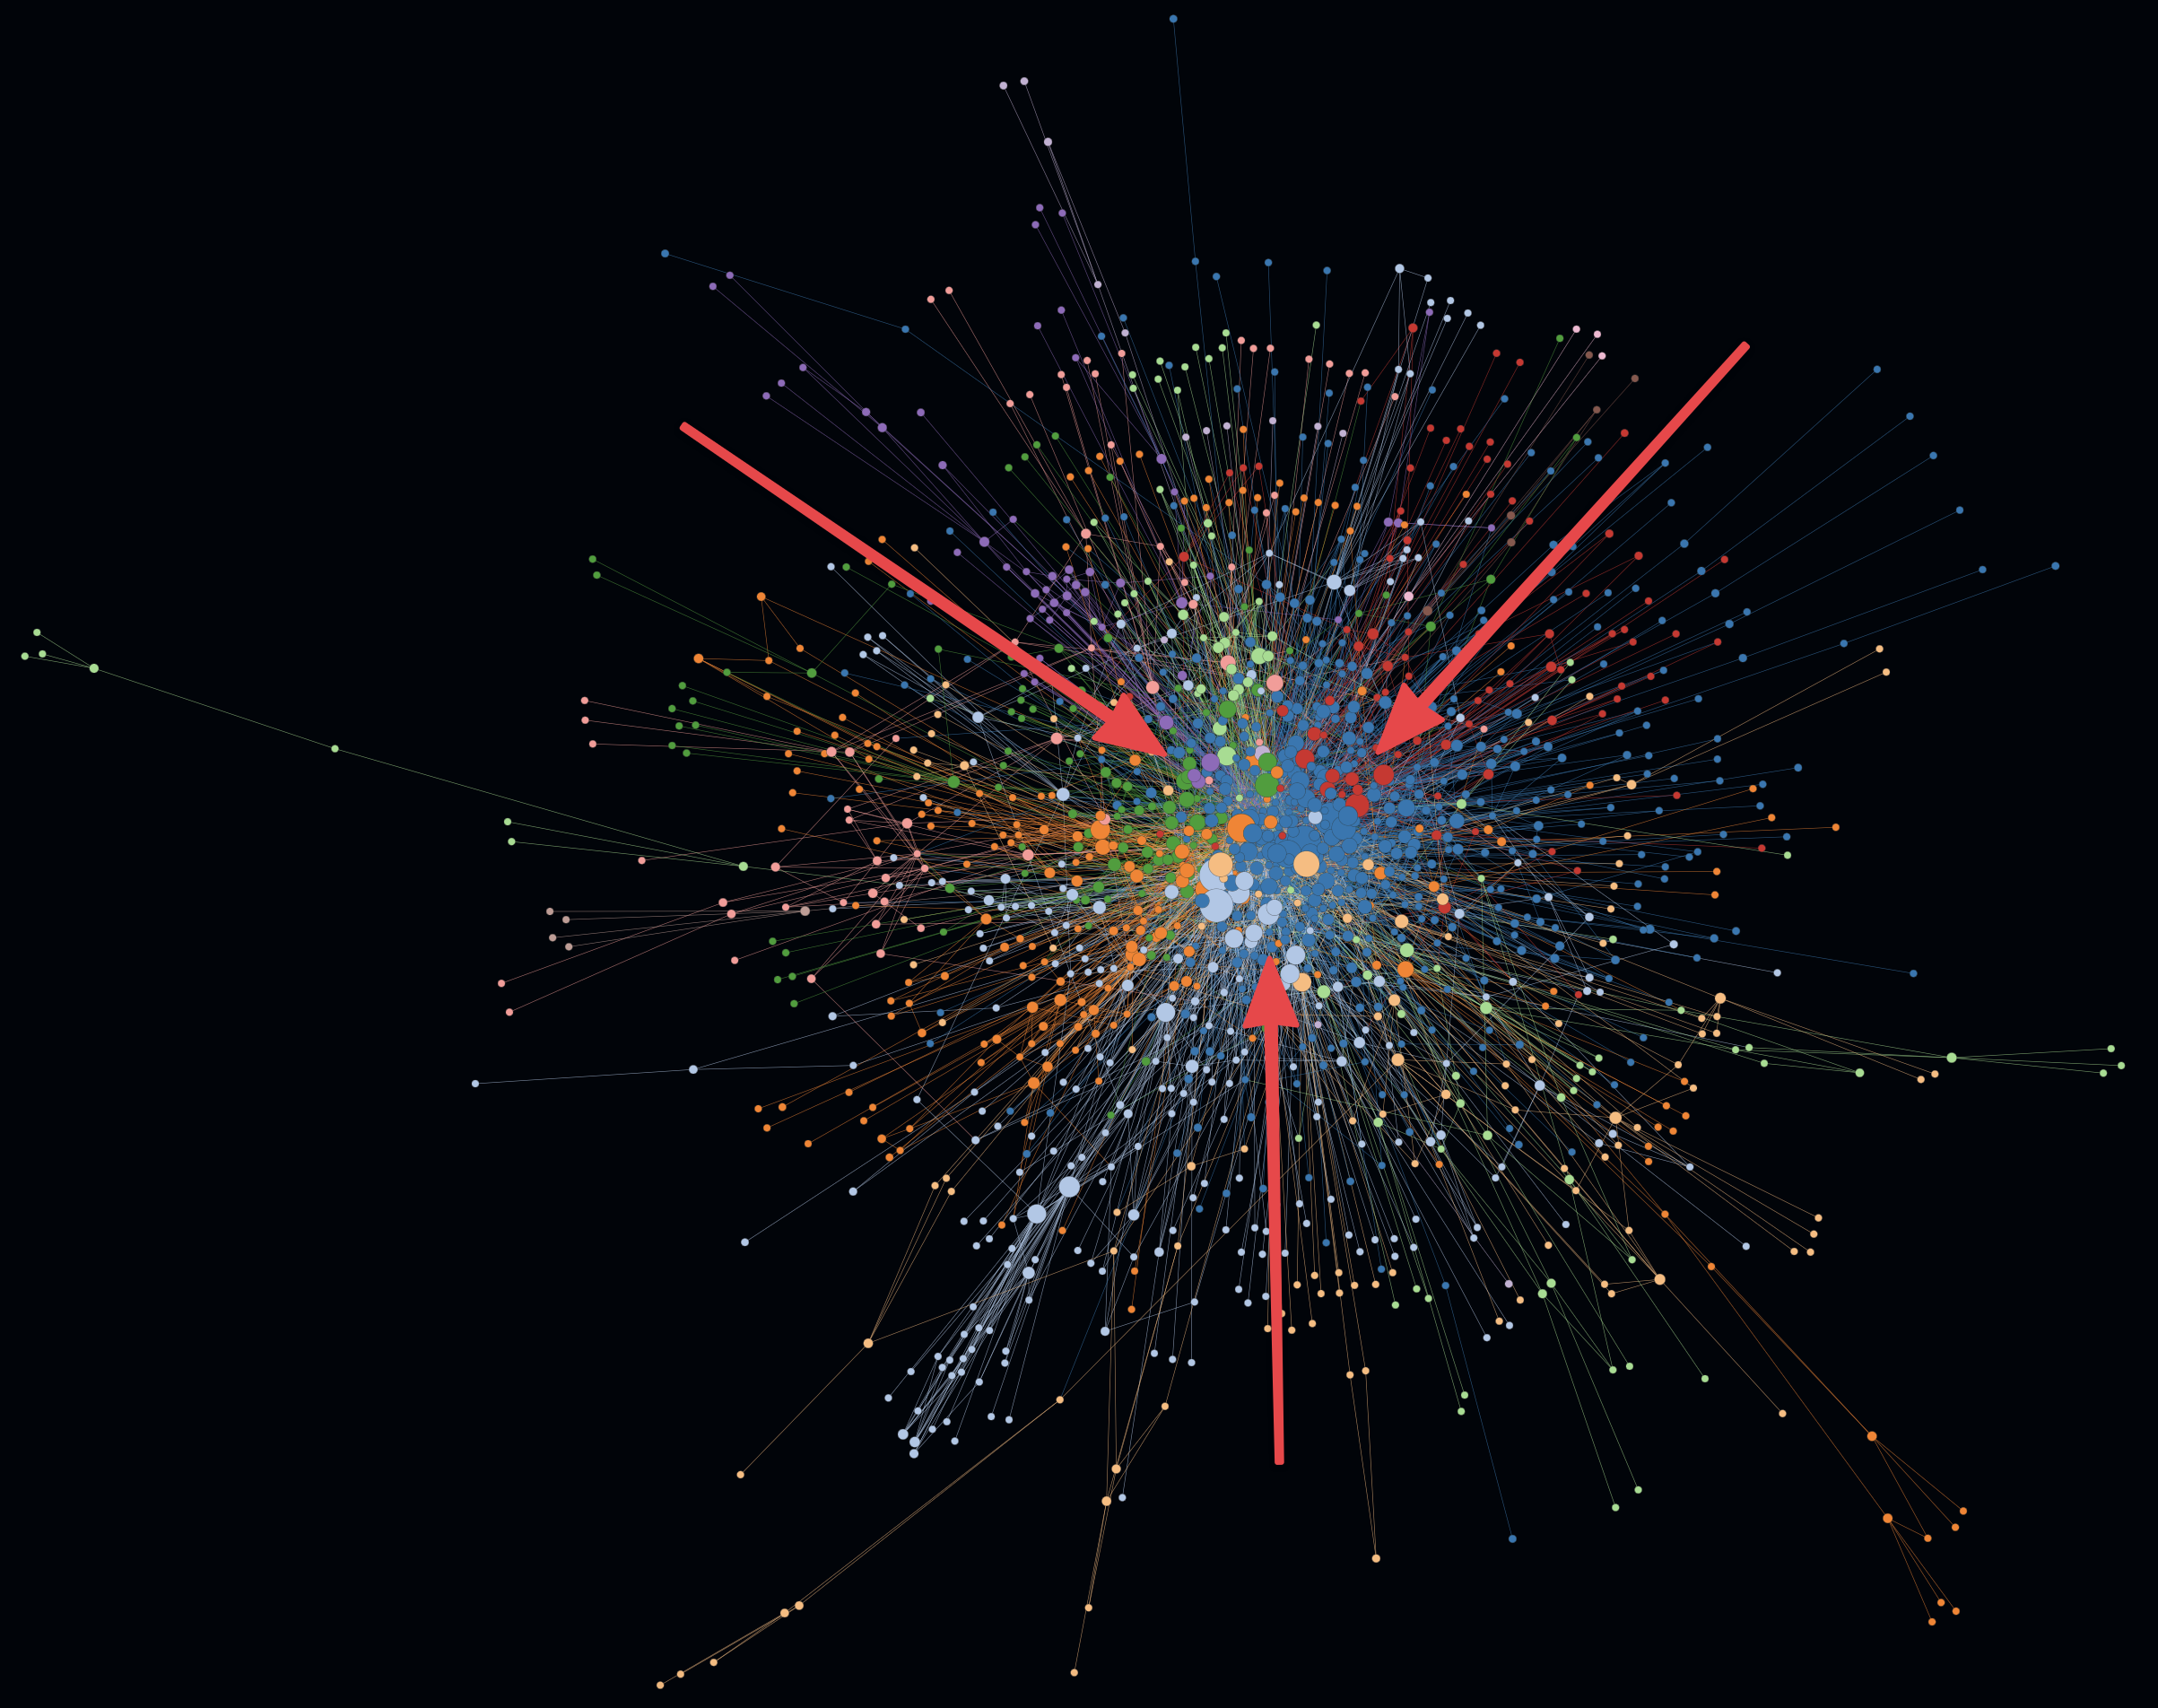
Emerge (or emerge-viz) is a code analysis tool to gather insights about source code structure, metrics, dependencies and complexity of software projects. You can use it to scan the source code of a project, calculate metric results and statistics, map the source code to graph structures (e.g. a dependency graph or a filesystem graph), export the results in other file formats and even create an interactive web application for further exploration. Emerge currently has scanning support for the following languages: C, C++, Groovy, Java, JavaScript, TypeScript, Kotlin, ObjC, Ruby, Swift, Python, Go. The structure, coloring and clustering is calculated and based on the idea of combining a force-directed graph simulation and Louvain modularity. emerge is mainly written in Python 3 and is tested on macOS, linux and modern web browsers (i.e. latest Safari, Chrome, Firefox, Edge).
emerge (/ɪˈməːdʒ/)
- to appear by coming out of something or out from behind something
- to become known, especially as a result of examining something or asking questions about it
The main goal of this project is to create a free/ open source tool, that can easily be used by anyone with interest in software development, architecture, metrics and visualization to gather more insights about those topics. It should facilitate/ support getting a better understanding of a given software project by using an exploratory approach.
- File scan support for the following languages:
C,C++,Groovy,Java,JavaScript,TypeScript,Kotlin,ObjC,Ruby,Swift,Python - Basic entity scan/extraction (e.g. classes) for the following languages:
Groovy,Java,Kotlin,Swift - Basic implementation of the following software metrics: SLOC, Number of Methods, Fan-In/Fan-Out, Modularity (Louvain)
- Infer meaning by feature/semantic keyword extraction based on term frequency-inverse document frequency
- Logging support with configurable log levels
- Configuration support based on YAML syntax to configure multiple/specific analyses
- Create a language/project configuration directly from an included configuration template
- Export of scan results/ metrics/ statistics for the following formats/ outputs
- File scan
- Dependency graph
- Entity scan
- Dependency graph
- Inheritance graph
- Complete graph (composition of dependency and inheritance graph)
- Includes the extraction of
SwiftUIandComposabledeclarative UI entities
- A Filesystem graph that shows the project filesystem hierarchy as a graph
- GraphML
- Graphviz DOT format
- JavaScript format suited for a D3 force graph simulation
- Interactive HTML/ web application for interactive, exploratory analysis and data visualization of your project based on graph structures
- HTML app is based on Bootstrap
- Force-directed graph simulation by D3
- The node colors are based on Louvain modularity with a bit of post-processing to make the graph coloring more deterministic and stable
- Fast full-screen UI rendering on HTML canvas
- Visualization of files, entities and given metrics
- Dark mode support
- Visual live search (OR'ed with multiple search terms) of entities
- The option to include a semantic search based on term frequency-inverse document frequency
- Selection and highlighting of individual nodes
- Concave hull visualization of single clusters
- Heatmap visualization support of potentially harmful nodes based on a SLOC/Fan-Out score
- Display of cluster metrics to facilitate comparability
- Interactivity given by translation, zooming, dragging and hovering over nodes
- Tabular console output
- Tabular file output
- JSON file output
- File scan
Basically there are two ways to install emerge. If you're familiar with pip (a virtual environment by using pyenv, virtualenv and virtualenvwrapper is recommended, but not needed) you can simply install the latest version of emerge with the following few steps.
The recommended way would be to use a virtual env, you can do this by using the following example:
pyenv install 3.10.0
pyenv virtualenv 3.10.0 venv-3.10.0
pyenv activate venv-3.10.0
You can simply install emerge by using pip.
On Ubuntu 20.04+ pleaase make sure that the packages graphviz and graphviz-dev are installed, i.e.
apt-get install graphviz graphviz-dev
Either install as new package with:
pip install emerge-viz
or if it's already installed, just update with:
pip install -U emerge-viz
and then simply execute it like this:
(emerge) user@host ~ % emerge
usage: emerge [-h] [-c YAMLCONFIG] [-v] [-d] [-e] [-a LANGUAGE]

🔎 Welcome to emerge x.y.z (yyyy-mm-dd hh:mm:ss)

options:
  -h, --help            show this help message and exit
  -c YAMLCONFIG, --config YAMLCONFIG
                        set yaml config file
  -v, --verbose         set logging level to INFO
  -d, --debug           set logging level to DEBUG
  -e, --error           set logging level to ERROR
  -a LANGUAGE, --add-config LANGUAGE
                        add a new config from a template, where LANGUAGE is one of [JAVA, SWIFT, C, CPP, GROOVY, JAVASCRIPT,
                        TYPESCRIPT, KOTLIN, OBJC, RUBY, PY, GO]
You can create a simple project config adhoc from the command line and then simply adjust the necessary source/export paths
(emerge) user@host tmp % pwd
/Users/user1/tmp
(emerge) user@host tmp % emerge -a java
✅ created config file from template: /Users/user1/tmp/java-template.yaml
and then simply adjust the necessary paths (analyses/source_directory and export/directory):
(emerge) user@host tmp % cat java-template.yaml
---
project_name: java_project_example
loglevel: info
analyses:
- analysis_name: full java check
  source_directory: /Users/user1/emerge/project/source
  only_permit_languages:
  - java
  only_permit_file_extensions:
  - .java
  file_scan:
  - number_of_methods
  - source_lines_of_code
  - dependency_graph
  - fan_in_out
  - louvain_modularity
  - tfidf
  entity_scan:
  - dependency_graph
  - source_lines_of_code
  - number_of_methods
  - fan_in_out
  - louvain_modularity
  - tfidf
  export:
  - directory: /Users/user1/emerge/project/export
  - graphml
  - dot
  - json
  - tabular_file
  - tabular_console_overall
  - d3
(emerge) user@host tmp %
After this you can simply start a scan by
(emerge) user@host tmp % emerge -c java-template.yaml
2021-12-04 21:18:15   analysis I 👉 starting to analyze java_project_example
2021-12-04 21:18:15   analysis I ⏩ performing analysis 1/1: full java check
2021-12-04 21:18:15   analysis I 👉 starting to create filesystem graph in full java check
2021-12-04 21:18:15   analysis I ⏩ starting scan at directory: ...
...
...
...
2021-12-04 21:18:27   analysis I ✅ all your generated/exported data can be found here: /Users/user1/tmp/java
2021-12-04 21:18:27   analysis I ✅ copy the following path to your browser and start your web app: 👉 file:///Users/user1/tmp/java/html/emerge.html
2021-12-04 21:18:27   analysis I ✅ total runtime of analysis: 00:00:10 + 154 ms
Now just copy the above mentioned file:// path to any modern web browser and interactively expore your configured codebase 😉
You can clone this repository and install it by following this instruction:
git clone https://github.com/glato/emerge.git
brew install graphviz
If you encounter the following error on an Apple silicon Mac
pygraphviz/graphviz_wrap.c:2711:10: fatal error: 'graphviz/cgraph.h' file not found
      #include "graphviz/cgraph.h"
               ^~~~~~~~~~~~~~~~~~~
      1 error generated.
you need to run the following command once to update the pygraphviz include directories for the new homebrew environment
pip install --global-option=build_ext --global-option="-I$(brew --prefix graphviz)/include/" --global-option="-L$(brew --prefix graphviz)/lib/" pygraphvizSee the issue in context here.
Check of you have the latest Python 3 installed on your macOS. I recommend installing/using Python 3 from Homebrew. Create a Python 3 virtual environment (optionally within the project structure)
cd emerge
pip3 install virtualenv
virtualenv -p python3 venv
Install required packages and create a Python 3 virtual environment (optionally within the project structure)
apt-get install python3-venv python3-dev graphviz graphviz-dev
cd emerge
python3 -m venv venv
source venv/bin/activate
Install all required dependencies for the project with pip
pip install -r requirements.txt
Install the wheel package, after that install all required dependencies for the project with pip
pip install wheel
pip install -r requirements.txt
Execute the following from the cloned project root:
python -m unittest discover -v -s ./emerge -p "test_*.py"
otherwise execute the script run_tests.py:
python run_tests.py
If you got in any trouble executing the tests, check this woraround.
(emerge) user@host emerge % python emerge.py
usage: emerge.py [-h] [-c YAMLCONFIG] [-v] [-d] [-e] [-a LANGUAGE]

🔎 Welcome to emerge x.y.z (yyyy-mm-dd hh:mm:ss)

options:
  -h, --help            show this help message and exit
  -c YAMLCONFIG, --config YAMLCONFIG
                        set yaml config file
  -v, --verbose         set logging level to INFO
  -d, --debug           set logging level to DEBUG
  -e, --error           set logging level to ERROR
  -a LANGUAGE, --add-config LANGUAGE
                        add a new config from a template, where LANGUAGE is one of [JAVA, SWIFT, C, CPP, GROOVY, JAVASCRIPT,
                        TYPESCRIPT, KOTLIN, OBJC, RUBY, PY, GO]
Let's quickly try to run emerge on its own codebase
python emerge.py -c configs/emerge.yaml
This should produce a similar output:
...   analysis I 👉 starting to analyze emerge
...   analysis I ⏩ performing analysis 1/1: self-check
...   analysis I 👉 starting to create filesystem graph in self-check
...   analysis I ⏩ starting scan at directory: .
...   ...
...   analysis I 👉 the following statistics were collected in self-check
+-------------------------------------+-------------------+
|                      statistic name | value             |
+-------------------------------------+-------------------+
|                    scanning_runtime | 00:00:00 + 61 ms  |
|                       scanned_files | 32                |
|                       skipped_files | 176               |
|                        parsing_hits | 313               |
|                      parsing_misses | 141               |
|              extracted_file_results | 32                |
|       file_results_creation_runtime | 00:00:00 + 538 ms |
|    number-of-methods-metric-runtime | 00:00:00 + 4 ms   |
| source-lines-of-code-metric-runtime | 00:00:00 + 11 ms  |
|   louvain-modularity-metric-runtime | 00:00:00 + 161 ms |
|           fan-in-out-metric-runtime | 00:00:00 + 4 ms   |
|                       total_runtime | 00:00:00 + 786 ms |
+-------------------------------------+-------------------+
...   analysis I 👉 the following overall metrics were collected in self-check
+----------------------------------------------+----------------------------+
|                                  metric name | value                      |
+----------------------------------------------+----------------------------+
|                avg-number-of-methods-in-file | 13.0                       |
|                             avg-sloc-in-file | 151.41                     |
|                          total-sloc-in-files | 4845                       |
|         louvain-communities-dependency-graph | 3                          |
|          louvain-modularity-dependency-graph | 0.21                       |
| louvain-biggest-communities-dependency-graph | 0.49, 0.46, 0.05, 0.0, 0.0 |
|                  avg-fan-in-dependency-graph | 5.55                       |
|                 avg-fan-out-dependency-graph | 5.55                       |
|                  max-fan-in-dependency-graph | 29                         |
|             max-fan-in-name-dependency-graph | typing                     |
|                 max-fan-out-dependency-graph | 19                         |
|            max-fan-out-name-dependency-graph | emerge/appear.py           |
+----------------------------------------------+----------------------------+
...   analysis I ✅ all your generated/exported data can be found here: /Users/user1/tmp/python
...   analysis I ✅ copy the following path to your browser and start your web app: 👉 file:///Users/user1/tmp/python/html/emerge.html
...   analysis I ✅ total runtime of analysis: 00:00:00 + 786 ms
Now just copy the above mentioned file:// path to any modern web browser and interactively expore the emerge codebase 😉
- ℹ️ Hovering over a node and pressing ⬆️ +
sto select and highlight or deselect a specific node - ℹ️ Resetting the currently active node selection by pressing ⬆️ +
r - ℹ️ Fading all unselected nodes to have a more highlighted visualization of you currenty selected nodes by pressing ⬆️ +
f
And now let's make this more interesting ...
If you wand to use emerge on other projects, you can simple copy or customize one of the existing configuration templates from the emerge/configs directory.
For a quick run, it should be enough to adjust source_directory, directory in export.
---
project_name: c-example-project
loglevel: info
analyses:
- analysis_name: check_c_files
  source_directory: /Users/user1/emerge/project/source/github/linux-5.8.5/crypto
  only_permit_languages:
  - c
  only_permit_file_extensions:
  - .c
  - .h
  ignore_dependencies_containing:
  - string.h
  ignore_dependencies_matching:
  - ^test_(.*)\.h$
  file_scan:
  - number_of_methods
  - source_lines_of_code
  - dependency_graph
  - louvain_modularity
  - fan_in_out
  - tfidf
  export:
  - directory: /Users/user1/emerge/project/export
  - graphml
  - dot
  - json
  - tabular_file
  - tabular_console_overall
- d3After customizing a present config (e.g. config/c-template.yaml) or creating your own, just run emerge again with this new config
python emerge.py -c configs/c-template.yaml
After the scan, your scan output (including your interactive web app) can be found at the directory that you created and set in the config parameter export -> directory, as seen in the logs above.
A full YAML configuration that contains both file and entity scan has the following format:
---
project_name: java_project_example
loglevel: info
analyses:
- analysis_name: check_java_files_and_classes
  source_directory: /Users/user1/emerge/project/source
  only_permit_languages:
  - java
  only_permit_file_extensions:
  - .java
  ignore_dependencies_containing:
  - java.util
  file_scan:
  - number_of_methods
  - source_lines_of_code
  - dependency_graph
  - fan_in_out
  - louvain_modularity
  - tfidf
  entity_scan:
  - dependency_graph
  - source_lines_of_code
  - number_of_methods
  - fan_in_out
  - louvain_modularity
  - tfidf
  export:
  - directory: /Users/user1/emerge/project/export
  - graphml
  - dot
  - json
  - tabular_file
  - tabular_console_overall
  - d3
Sometimes it can make sense to exclude platform-usual dependencies or dependencies which do not contribute much to the understanding of a project. A good starting point for e.g. an Android project could the following ignore_dependencies_containing section:
ignore_dependencies_containing:
  - android
  - java
  - javax
or for an iOS project the following ignore_entities_containing section often makes sense e.g. to not consider SwiftUI previews for the graph output:
ignore_entities_containing:
  - _Previews
The yaml configuration is basically defined at the following levels:
| key | value/ description |
|---|---|
project_name |
a project name for all analyses, scans and exports |
loglevel |
set a loglevel: error (silent, only errors), info (includes error) gives you basic logs about control flow, debug (includes info) will produce a lot of debug logs |
analyses |
an array of analyses that can be configured individually, thus a project can contain one to many analyses. |
| key | value/ description |
|---|---|
analysis_name |
a specific analysis name |
source_directory |
the source directory where the recursive file scan should start |
ignore_files_containing |
exclude file names from the scan that contain the given substrings |
ignore_directories_containing |
exclude directory names from the scan that contain the given substrings |
only_permit_languages |
possible values include: java, kotlin, objc, swift, ruby, groovy, javascript, c - explicitly prevents any other language from scanning besides the one you set here |
only_permit_file_extensions |
explicitly permit the following file extensions you set here, e.g. .java |
only_permit_files_matching_absolute_path |
only the following list of absolute file paths is permitted for the file scan, e.g. [/Users/user1/source/file1.java]. The files should follow source_directory |
ignore_dependencies_containing |
ignore every dependency included in this list of substrings, e.g. java.util |
ignore_dependencies_matching |
ignore every dependency matching any of the regular expressions in this list of substrings, e.g. ^java\.util\. |
ignore_entities_containing |
ignore every entity included in this list of substrings, e.g. NotRelevantClass |
ignore_entities_matching |
ignore every entity matching any of the regular expressions in this list of substrings, e.g. ^Test |
import_aliases |
define a list of import aliases, i.e. replace substrings within a full dependency path, e.g. "@foo": src/foo will replace any @foo alias by src/foo |
override_resolve_dependencies |
if supported by the language parser, force every dependency in this list to be resolved |
override_do_not_resolve_dependencies |
if supported by the language parser, force every dependency in this list NOT to be resolved (i.e. treated as a global dependency) |
file_scan |
perform a file scan, contains the metrics that should be applied on every source file |
entity_scan |
perform an entity scan, contains the metrics that should be applied on every entity (e.g. on every class) |
export |
contains any export formats that should be created as output |
appconfig |
contains any configurable app config parameters |
| key | value/ description |
|---|---|
dependency_graph |
create a dependency graph structure based on source files, additional metrics will be added to the graph nodes |
source_lines_of_code |
apply a source lines of code metric to every file, create an overall metric |
number_of_methods |
apply a number of methods metric to every file, create an overall metric |
fan_in_out |
apply a fan in/ fan out graph metric to every file, create an overall metric |
louvain_modularity |
apply a louvain modularity metric to every file, create an overall metric |
tfidf |
apply a tfidf metric to every file and extract relevant semantic keywords |
| key | value/ description |
|---|---|
dependency_graph |
create a dependency graph structure based on extracted entities from files, additional metrics will be added to the graph nodes |
inheritance_graph |
create an inheritance graph structure based on extracted entities from files, additional metrics will be added to the graph nodes |
complete_graph |
create a complete graph structure (union of dependency/ inheritance graph) based on extracted entities from files, additional metrics will be added to the graph nodes |
source_lines_of_code |
apply a source lines of code metric to every entity, create an overall metric |
number_of_methods |
apply a number of methods metric to every entity, create an overall metric |
fan_in_out |
apply a fan in/ fan out graph metric to every entity, create an overall metric |
louvain_modularity |
apply a louvain modularity metric to every entity, create an overall metric |
tfidf |
apply a tfidf metric to every entity and extract relevant semantic keywords |
| key | value/ description |
|---|---|
directory |
the output directory for all specified export formats |
graphml |
create a graphML file that contains the graph structure and metric results mapped to the nodes of the graph |
tabular_file |
create a tabular formatted text file that contains every metric and statistic result |
tabular_console |
print a tabular formatted output to console that contains every metric and statistic result |
tabular_console_overall |
print a tabular formatted output to console that contains only overall metric and statistic results |
json |
create a JSON file that contains every metric and statistic result |
dot |
create a DOT file that contains the graph structure and metric results mapped to the nodes of the graph |
d3 |
create a Bootstrap/D3 web application in the subfolder force-graph-html for further visual and interactive/ exploratory analysis |
| key | value/ description |
|---|---|
radius_fan_out |
node radius multiplication factor for the fan-out metric, default: 0.1 |
radius_fan_in |
node radius multiplication factor for the fan-in metric, default: 0.1 |
radius_louvain |
node radius multiplication factor for the louvain metric, default: 0.02 |
radius_sloc |
node radius multiplication factor for the sloc metric, default: 0.005 |
radius_number_of_methods |
node radius multiplication factor for the number of methods metric, default: 0.05 |
heatmap_sloc_active |
should the sloc metric be included in the heatmap score calculation? default: true |
heatmap_fan_out_active |
should the fan-out metric be included in the heatmap score calculation? default: true |
heatmap_sloc_weight |
weight factor of the sloc metric within the heatmap score calculation, default: 1.5 |
heatmap_fan_out_weight |
weight factor of the fan-out metric within the heatmap score calculation, default: 1.7 |
heatmap_score_base |
min score threshold for the heatmap color mapping, default: 10 |
heatmap_score_limit |
max score threshold for the heatmap color mapping, default: 300 |
Emerge supports the following file extensions and scan types per language, whereas a file_scan simply calculates metrics and maps nodes within graph structures to scanned files and an entity_scan tries to extract more fine-grained entities from files e.g. classes or structs.
| File extension | Language parser | Files | Entities |
|---|---|---|---|
.java |
Java | ✅ | ✅ |
.swift |
Swift | ✅ | ✅ |
.c / .h |
C | ✅ | ❌ |
.cpp / .h |
C++ | ✅ | ❌ |
.groovy |
Groovy | ✅ | ✅ |
.js / .jsx |
JavaScript | ✅ | ❌ |
.ts / .tsx |
TypeScript | ✅ | ❌ |
.k |
Kotlin | ✅ | ✅ |
.m / .h |
Objective-C | ✅ | ❌ |
.rb |
Ruby | ✅ | ❌ |
.py |
Python | ✅ | ❌ |
.go |
Go | ✅ | ❌ |
The interpretation of such graphs can often be very subjective and project dependent. The following examples should help to recognize certain patterns through indicators and hints.
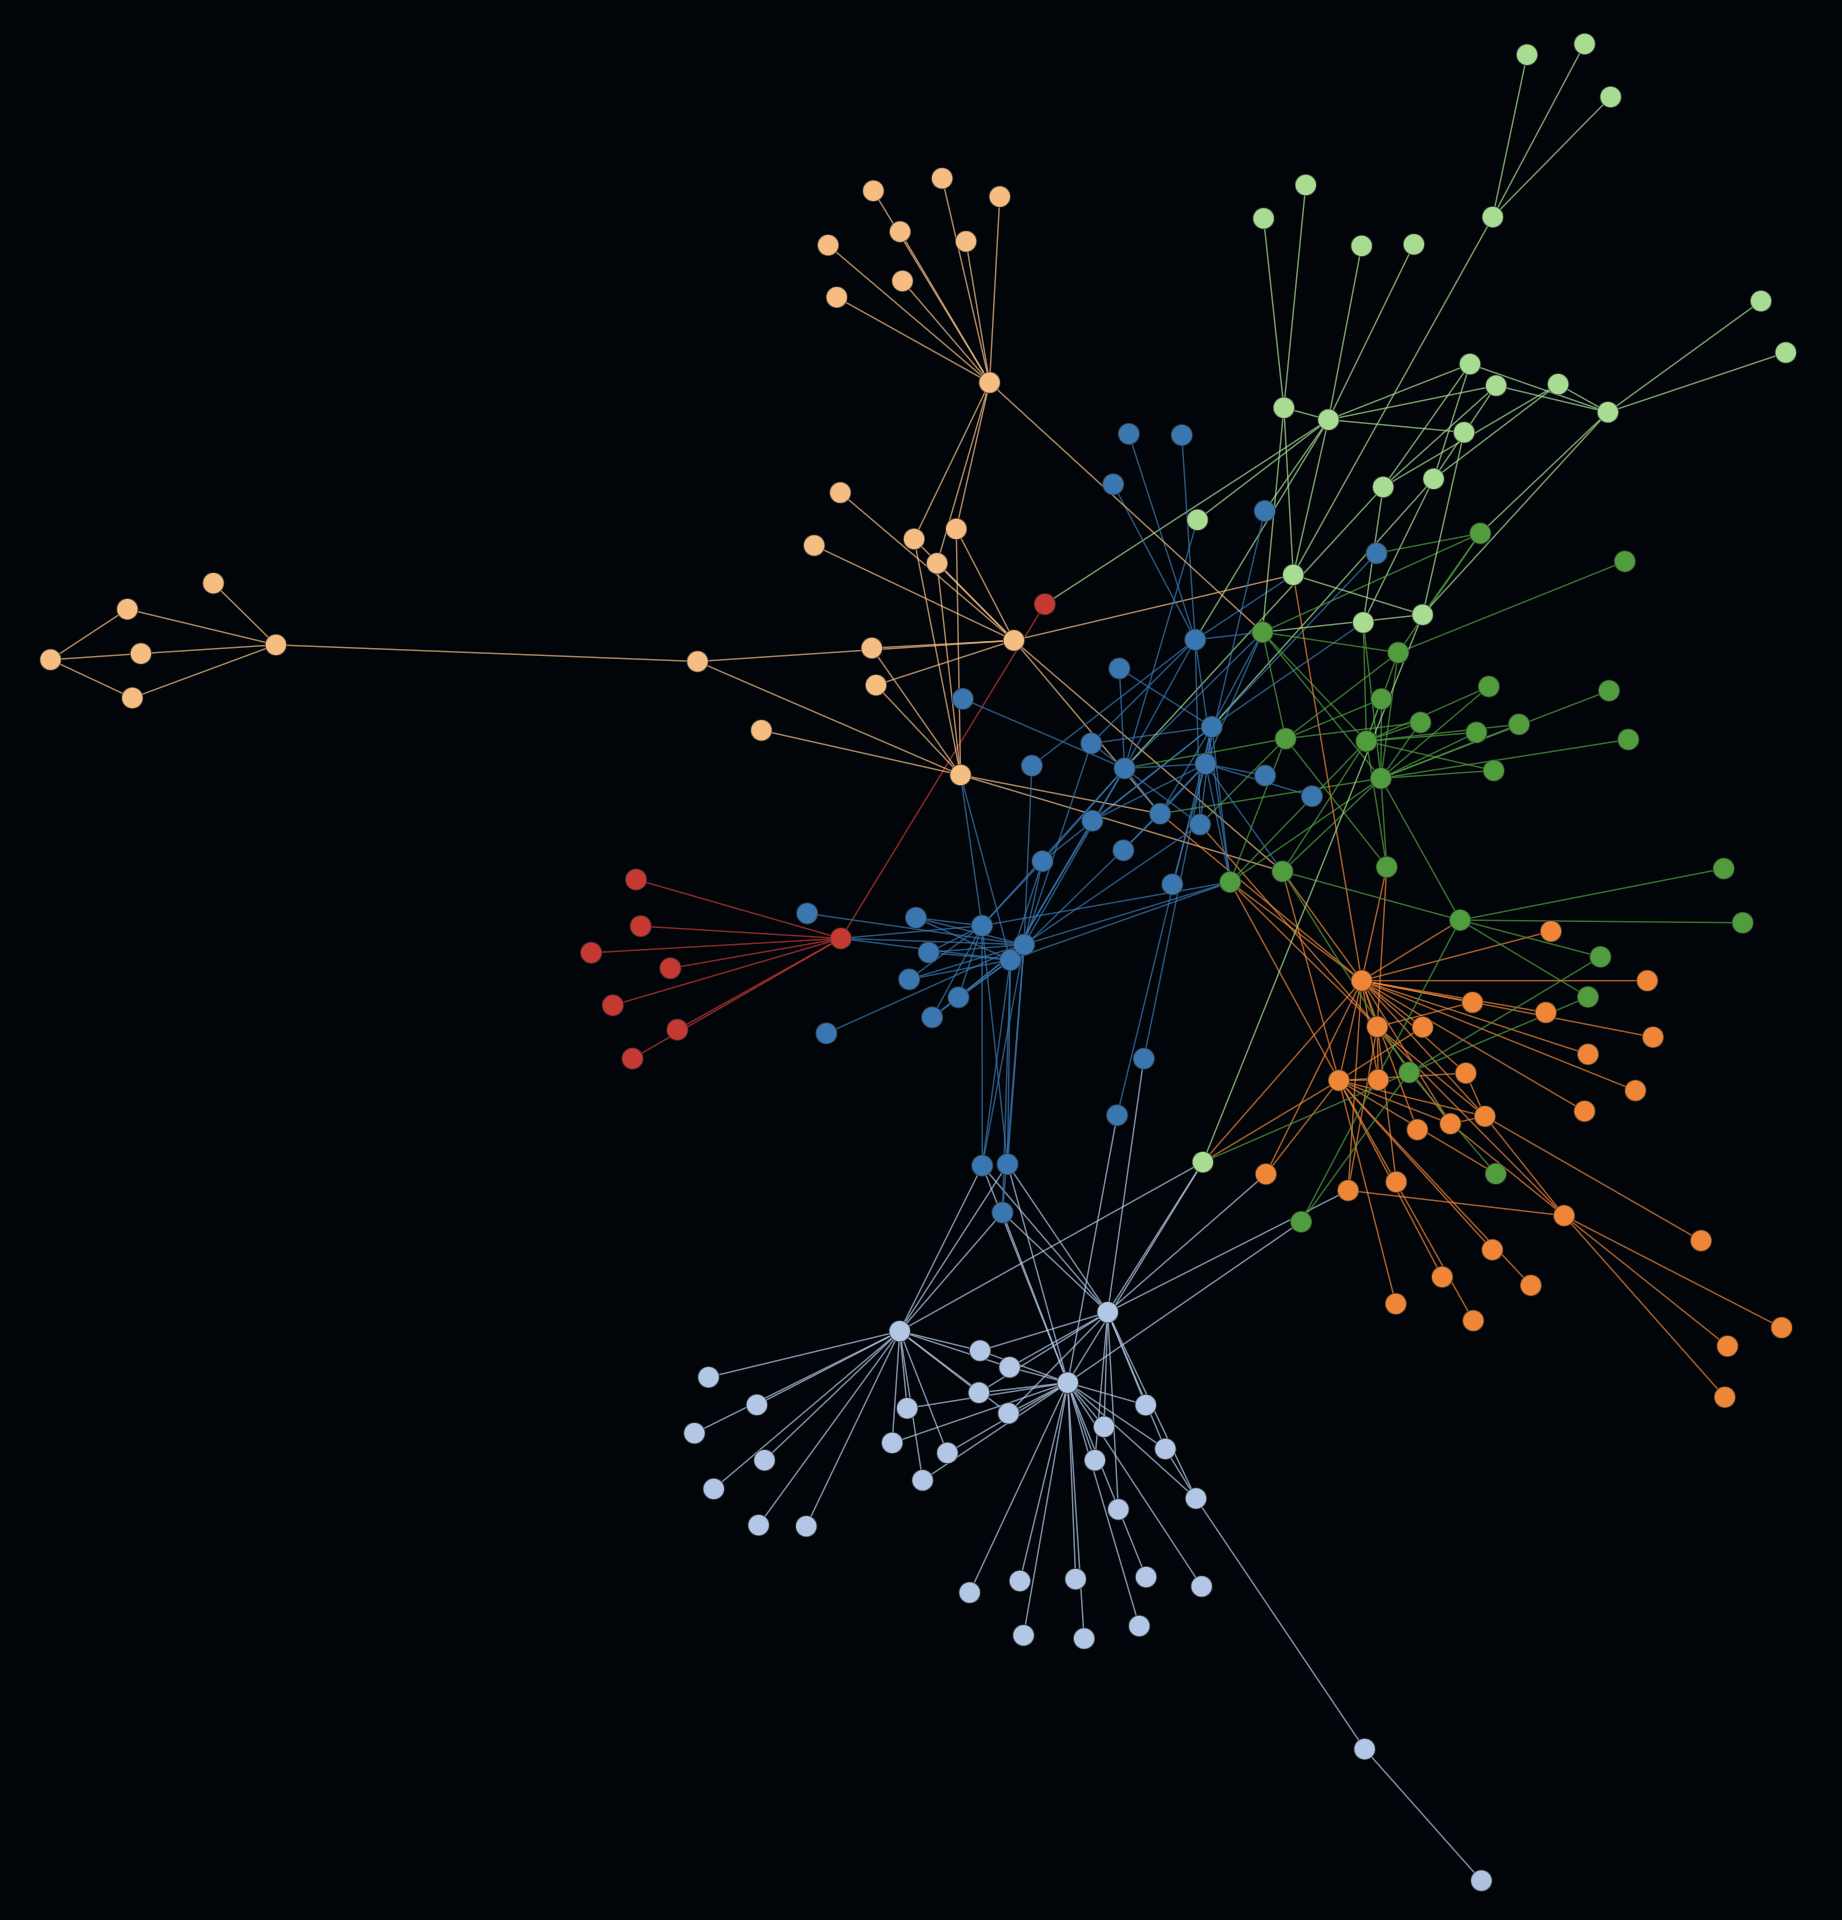
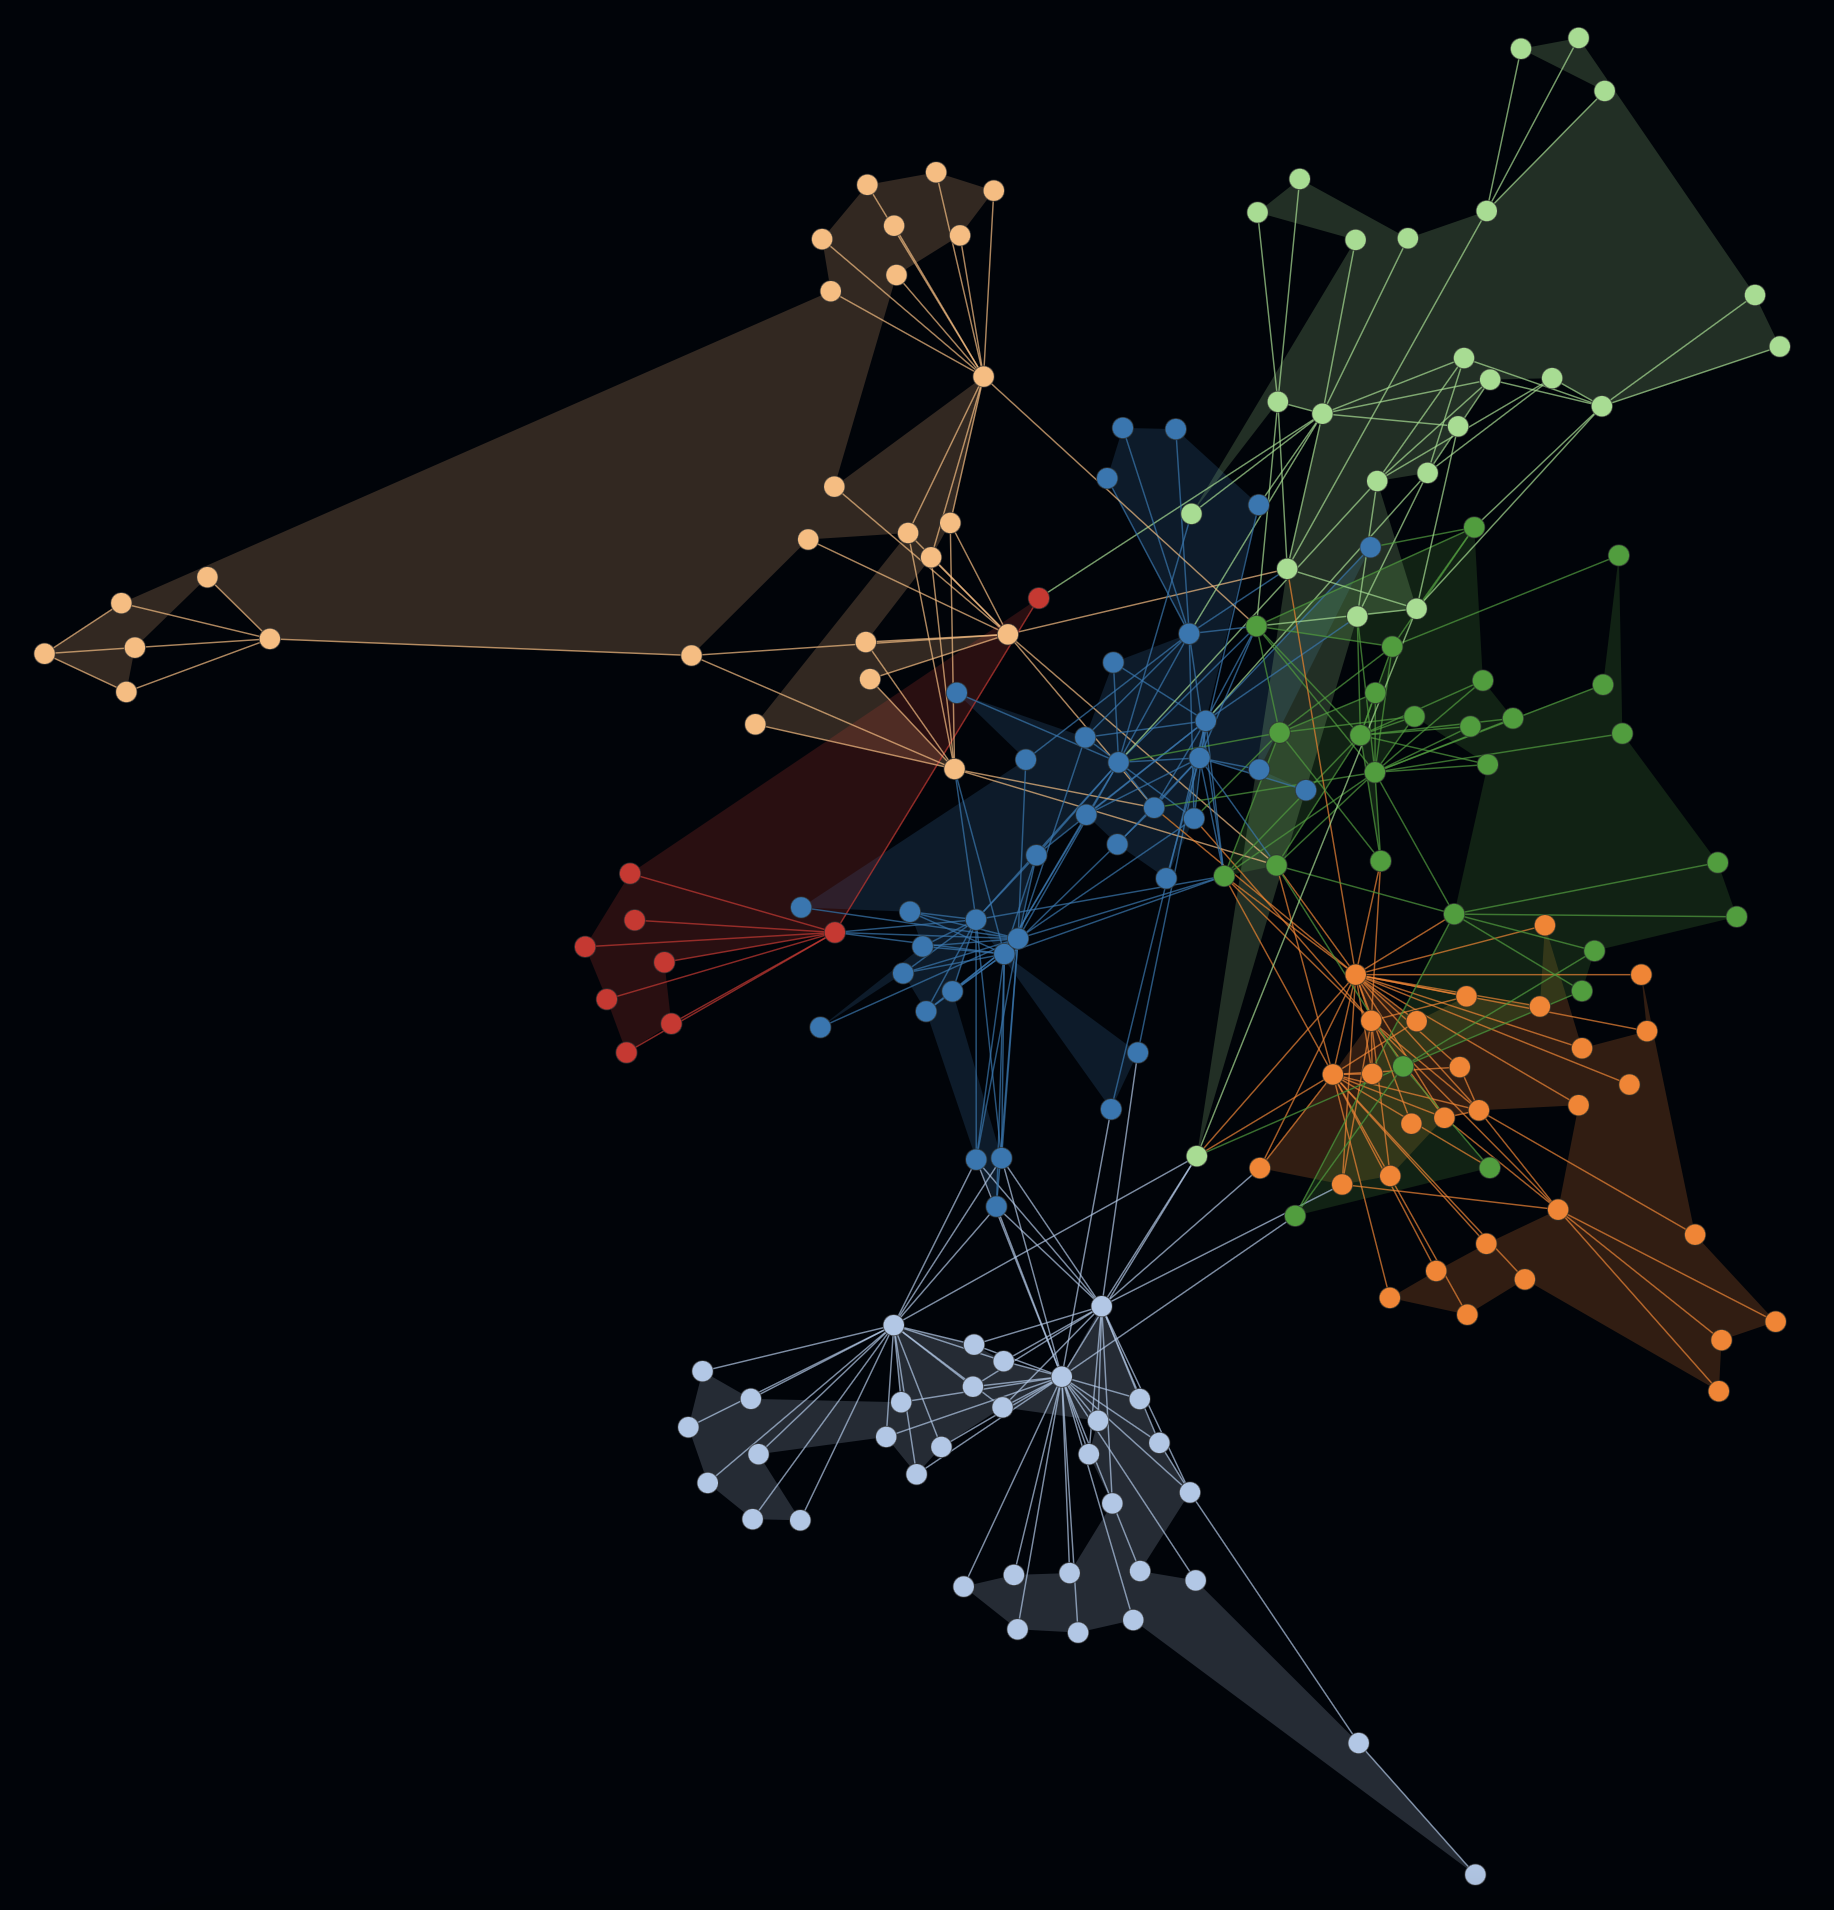
The magic of uncovering modularity lies in applying a community detection algorithm e.g. Louvain optimization to a force-directed graph, so that both distances and coloring influence the result. The following example includes several indicators for a modular codebase.
-
In the first example on the left you can spot multiple coherent colored clusters which show a low coupling by a certain distance (= generated by the force-directed graph).
-
In the second example on the right the same graph is rendered with activated cluster hulls. On this example the hulls show minimal to no overlapping. Such hints can be indicators for a good software architecture e.g. in terms of modularity, abstraction and well defined interfaces.
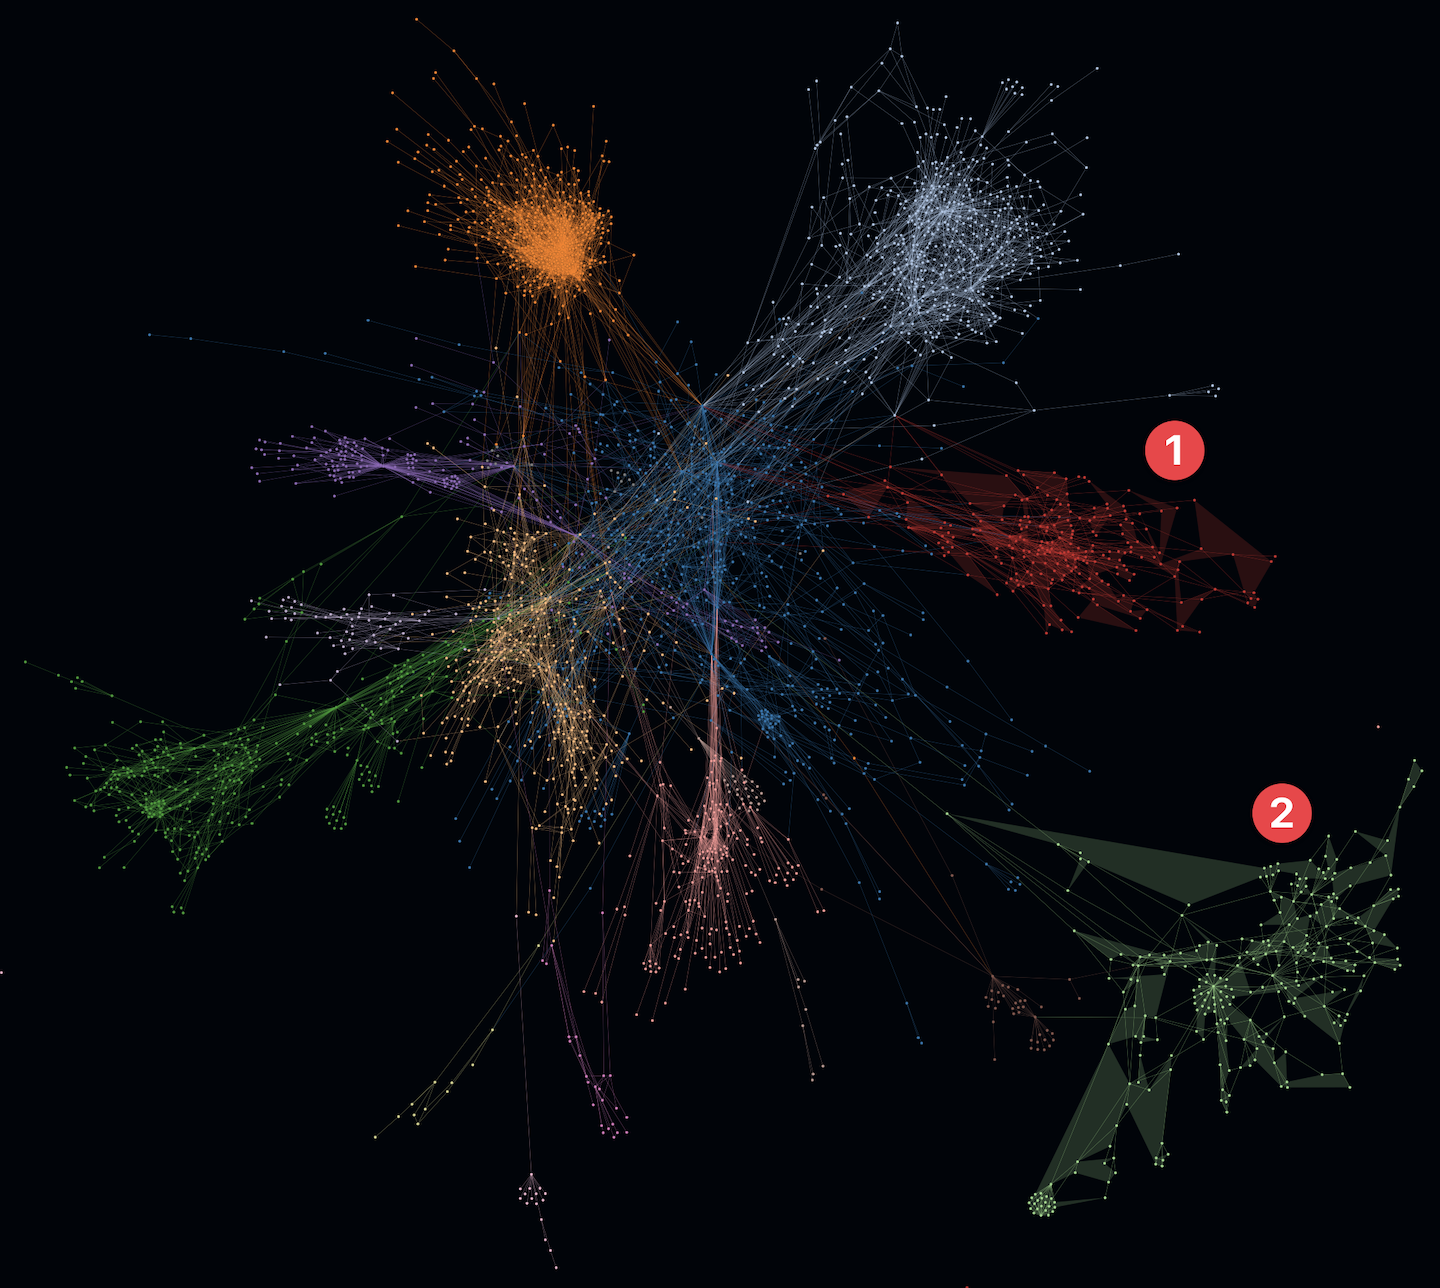
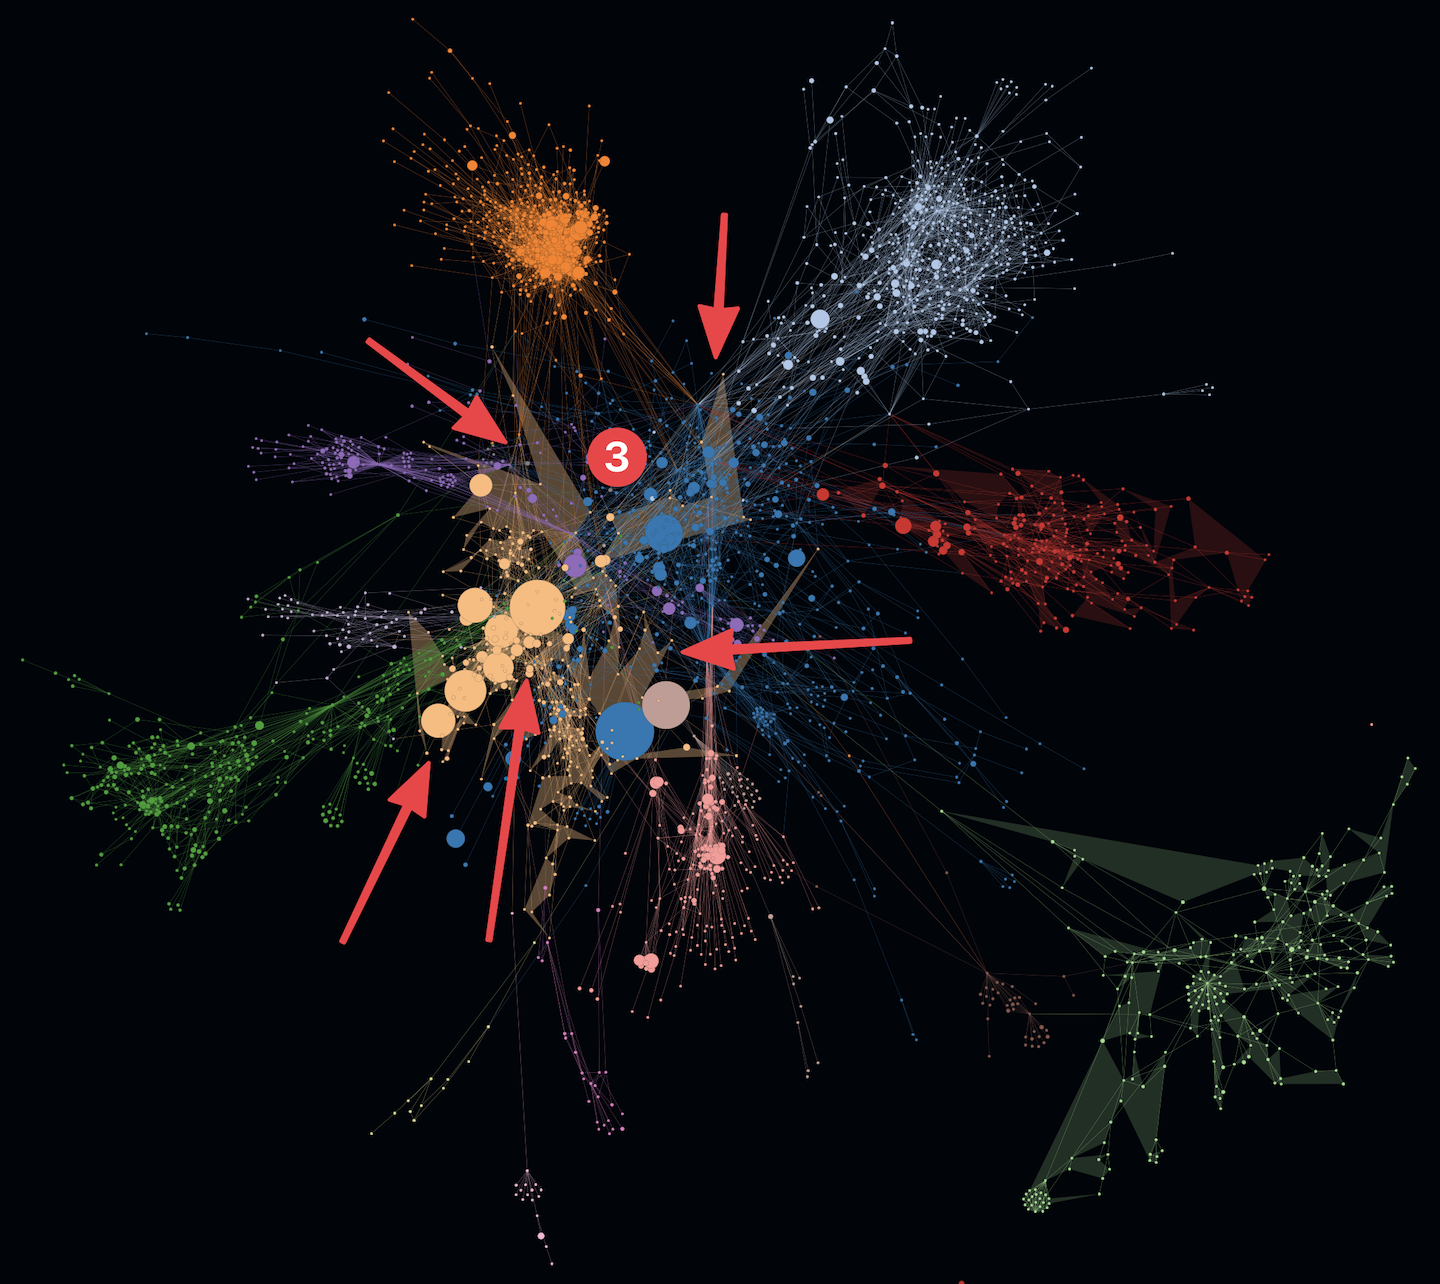
- In the following example on the left you can see structures with increased modularity e.g. cluster 1 and 2.
- At the same time you can see another cluster 3 that shows increased overlappings with other clusters. In addition to that an active SLOC metric even shows some huge entities (e.g. classes) which could indicate code smells like god classes. Such code smells like increased coupling and god classes may indicate increased maintenace efforts and error-proneness.
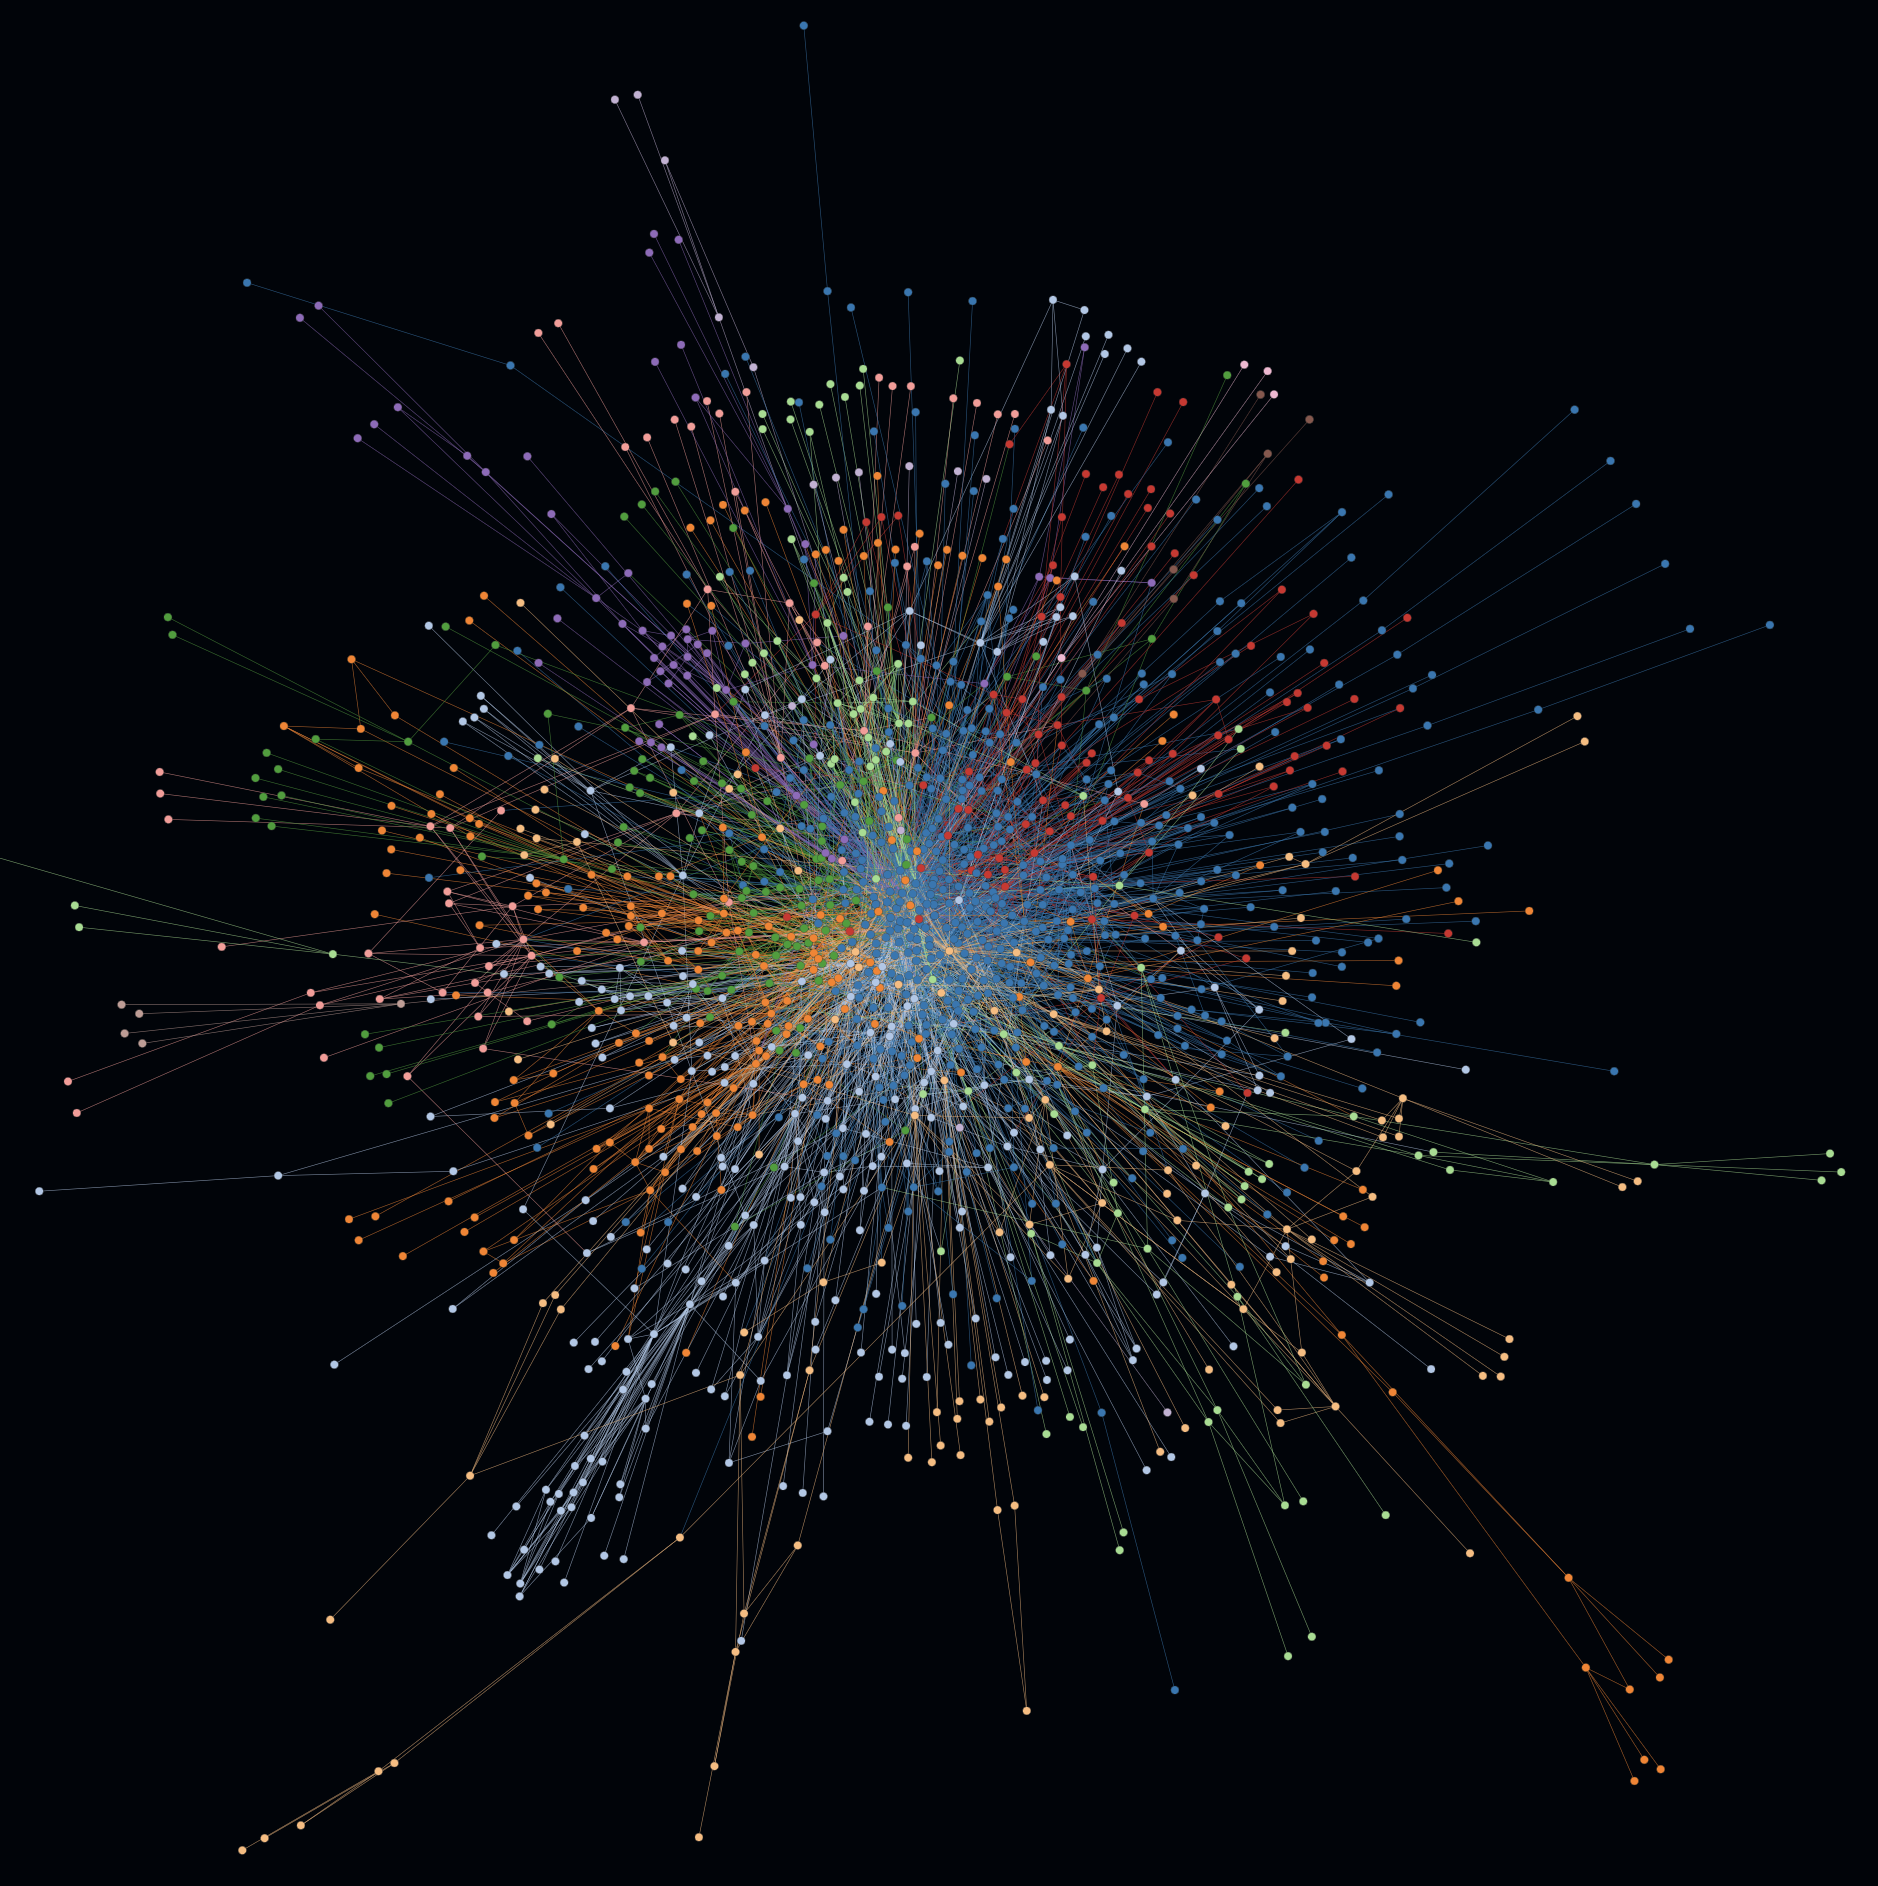
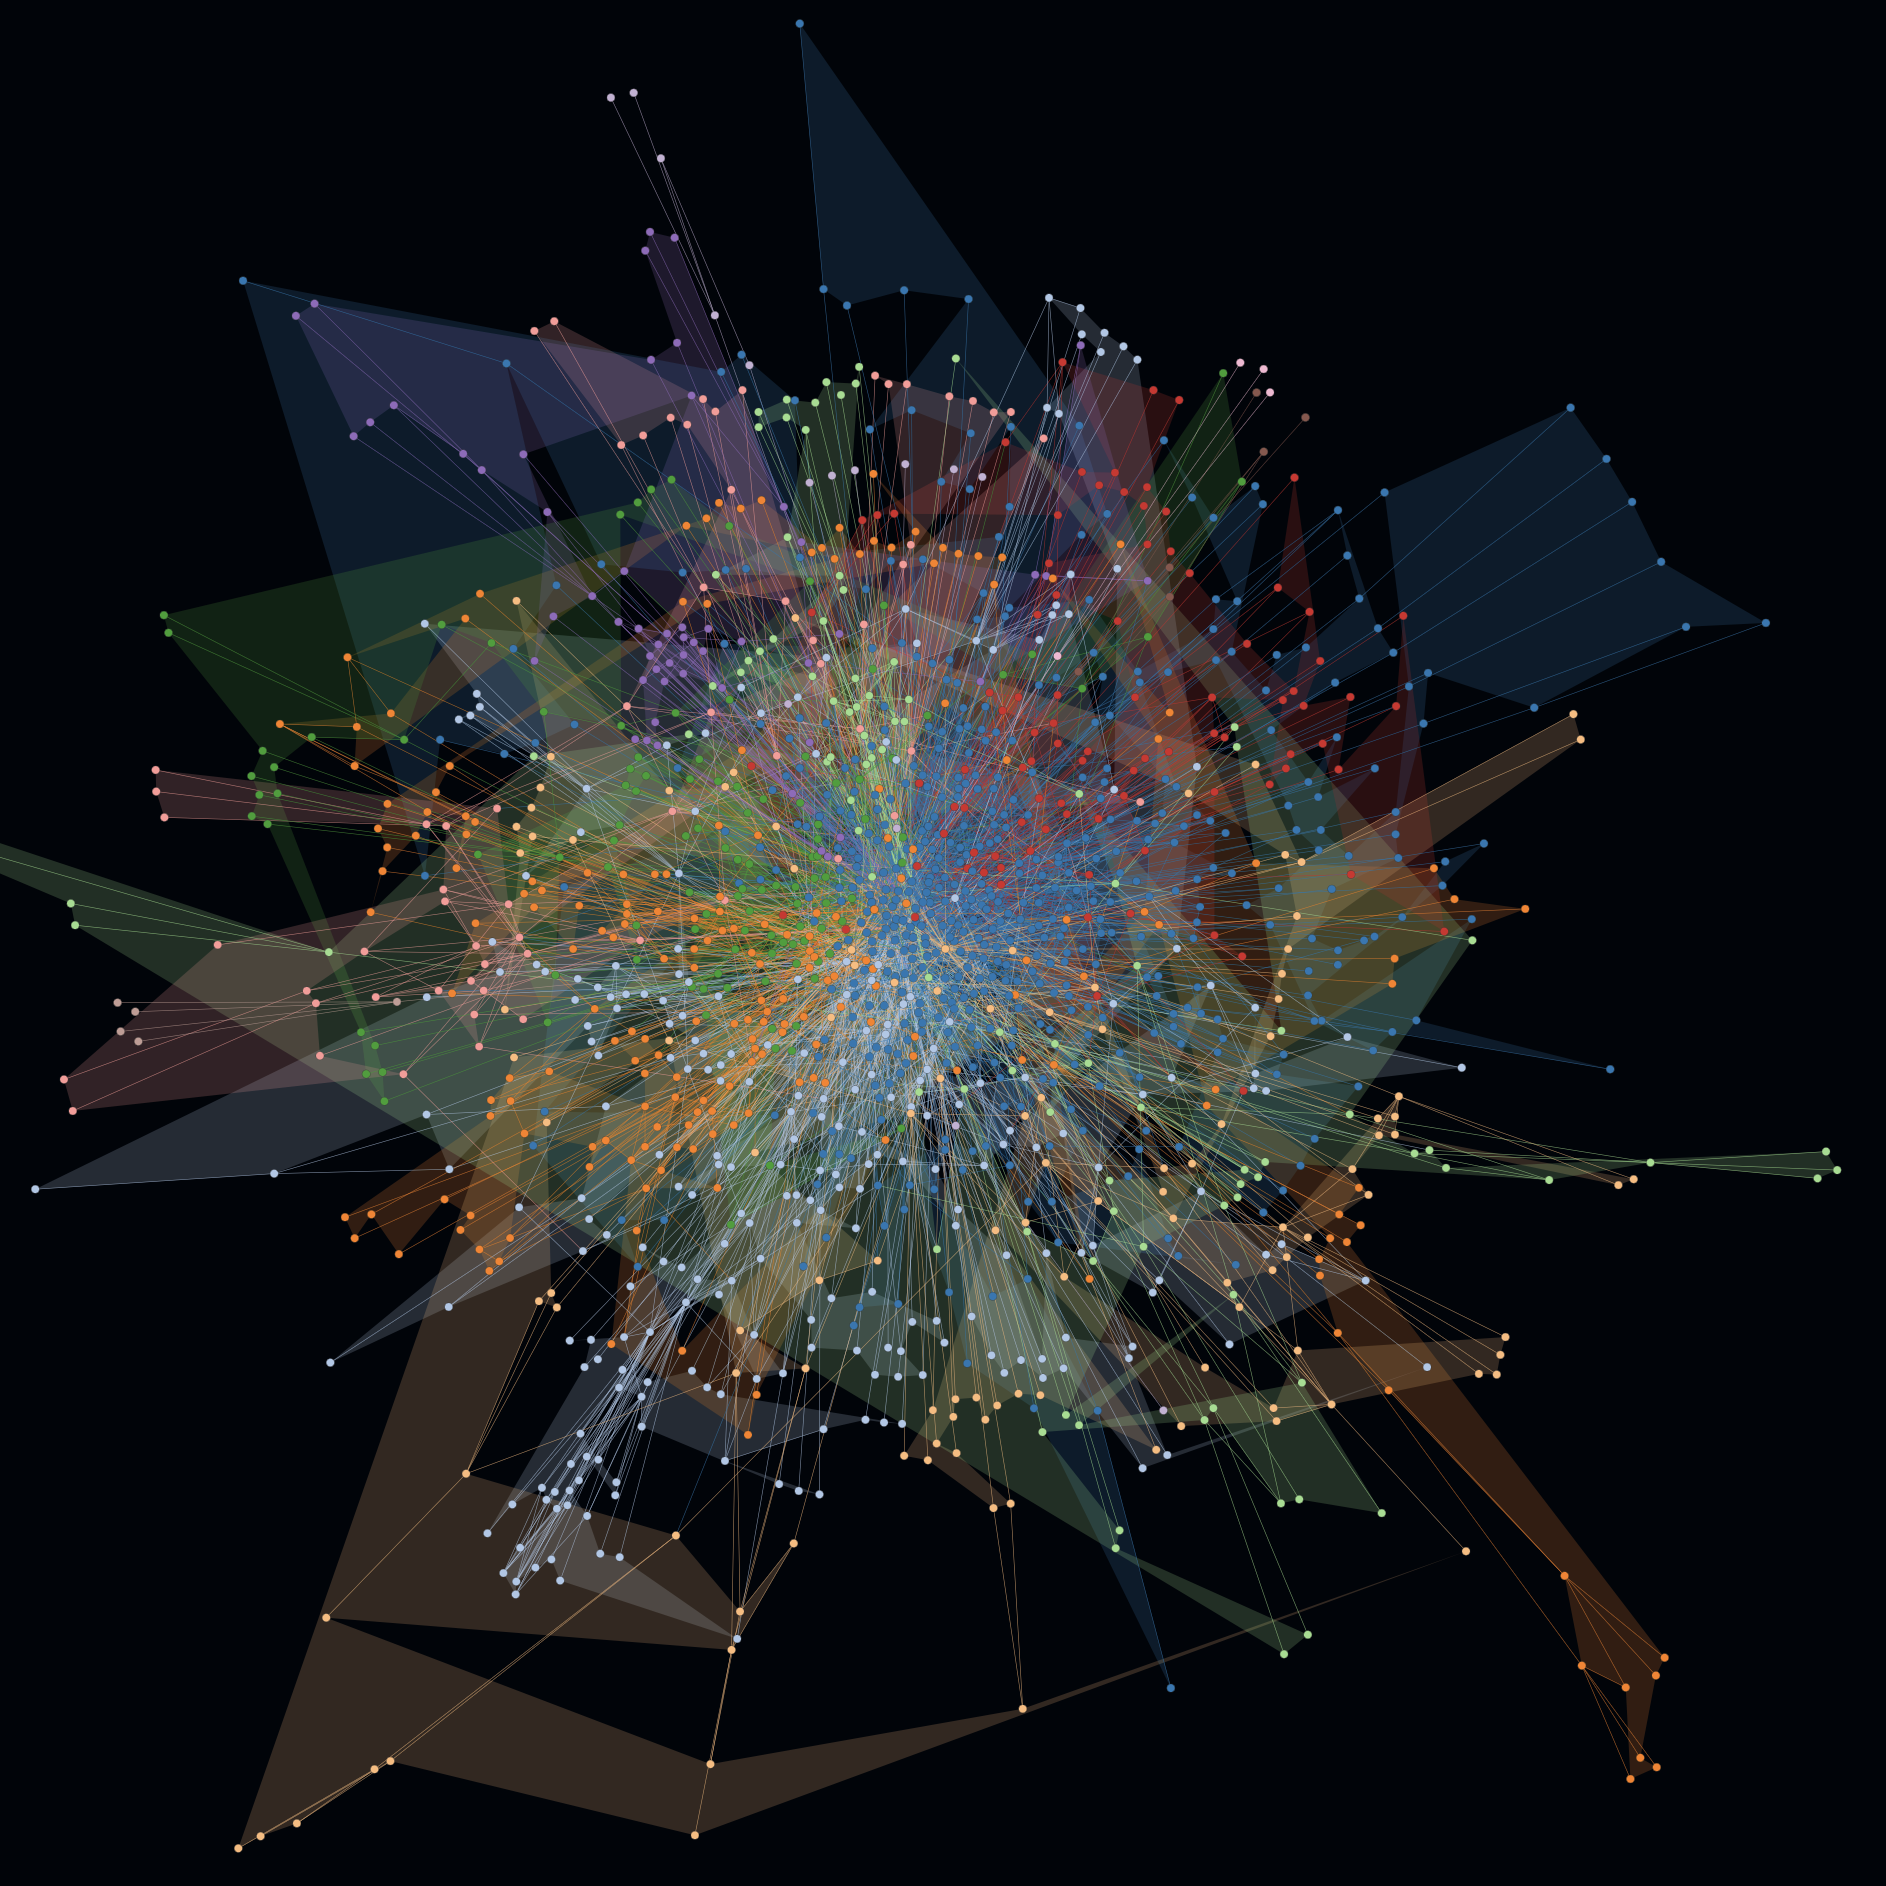
"A BIG BALL OF MUD is haphazardly structured, sprawling, sloppy, duct-tape and bailing wire, spaghetti code jungle" (B. Foote, J. Yoder, 1997). This kind of graph often represents a less optimal architecture. To verify this kind of spaghetti code jungle, one can simply enable hull rendering for all clusters to finally determine: there is only one big cluster after all.
Sometimes it can help to better understand the complexity of a software architecture if irrelevant dependencies are ignored.
- Besides being shocked to see the Big Ball of Mud with irrelevant dependencies like java.lang, java.util or any third party dependencies that does not directly belong to a project ...
- ... you can remove irrelevant dependencies configuratively with the key
ignore_dependencies_containing(orignore_dependencies_matchingif you prefer regular expressions). With a comparatively activated fan-out metric, one recognizes more scattering, some distant hub nodes and clearer clusters. All of these are possible clues to the real (= often more understandable) architecture underneath.
- Parsing of further entity types for more languages is planned for further development. Contributions are very welcome ❤️
- Everyone is invited to contribute to this project, whether the contribution is related with development, testing, bug reporting or any other support. I would appreciate any help. See Contributing and Credits for further details.


