Exploratory RNA-Seq data collection and k-means clustering analysis.
Clone this repository to your local machine, then install using Python.
Alternatively, simply clone and then run your scripts within the cloned folder.
git clone https://github.com/shanedrabing/rna-seeker.git
cd rna_seeker
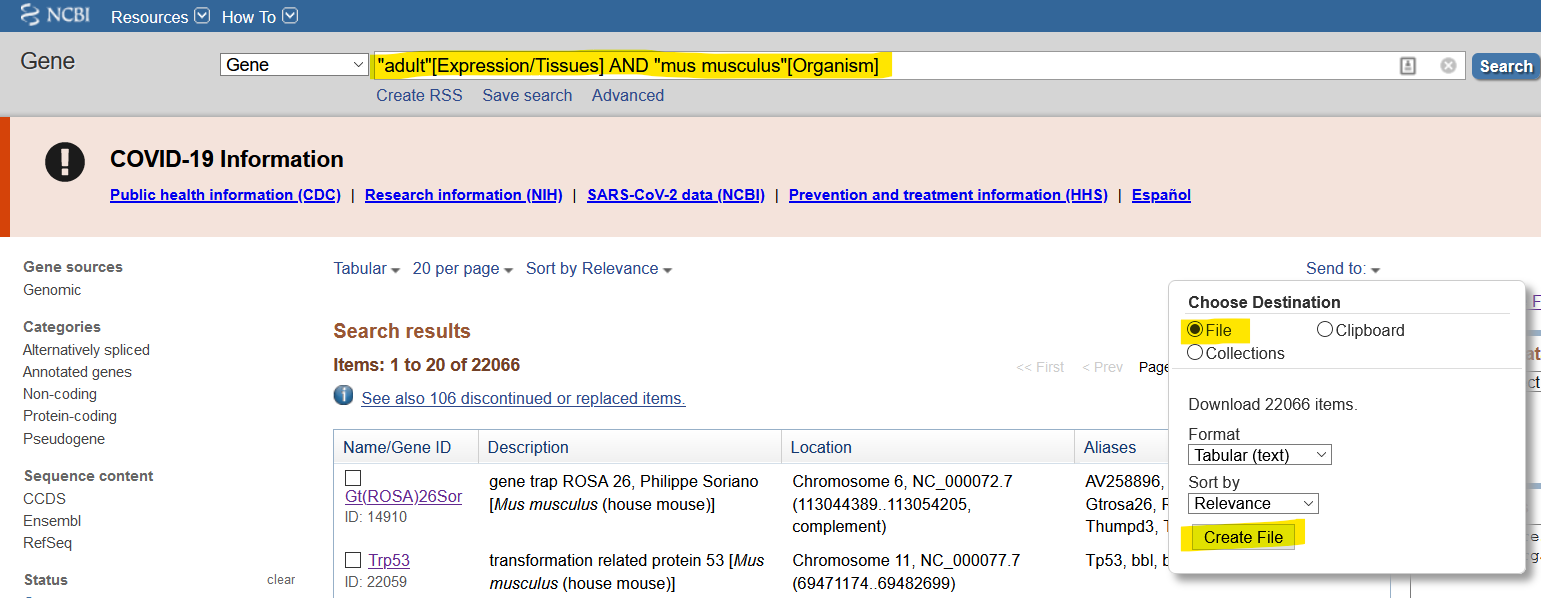
python setup.py installThis program takes exported search results from NCBI Gene (here is an example search) as input, as seen below:
Ideally, the search is species-specific and includes something to filter the results to make sure it has expression-related information. In the above example, I use the keyword "adult" which appears in many tissues types for the house mouse.
Check out data/mus_musculus_exp.txt as an example of the exported results.
Now that we have a search results tabular file, let's use a simple Python
script to perform all three procedures (retrieve, clean, analyze) of the
RNA-Seeker package:
from rna_seeker.core import retrieve, clean, analyze

# retrieve data from NCBI Gene
retrieve(inp_fname="mus_musculus_exp.txt",
         out_fname="raw.csv",
         include=lambda x: x["Symbol"].startswith("Zfp"))

# clean up the raw data
clean(inp_fname="raw.csv",
      out_fname="clean.csv")

# k-means clustering of cleaned data
analyze(inp_fname="clean.csv",
        out_fname="k3_rpkm.csv",
        plt_fname="k3_rpkm.jpg")
Notice that, besides providing necessary filenames, we use an anonymous
function as a value for the include parameter of the retrieve function.
Imagine that x is a dictionary representing any given row of the
data/mus_musculus_exp.txt file. In this example,
we make sure that any given row's symbol (name) starts with "Zfp", for
"Zinc-finger protein." So, our function will now only go fetch the information
of genes that match that criteria.
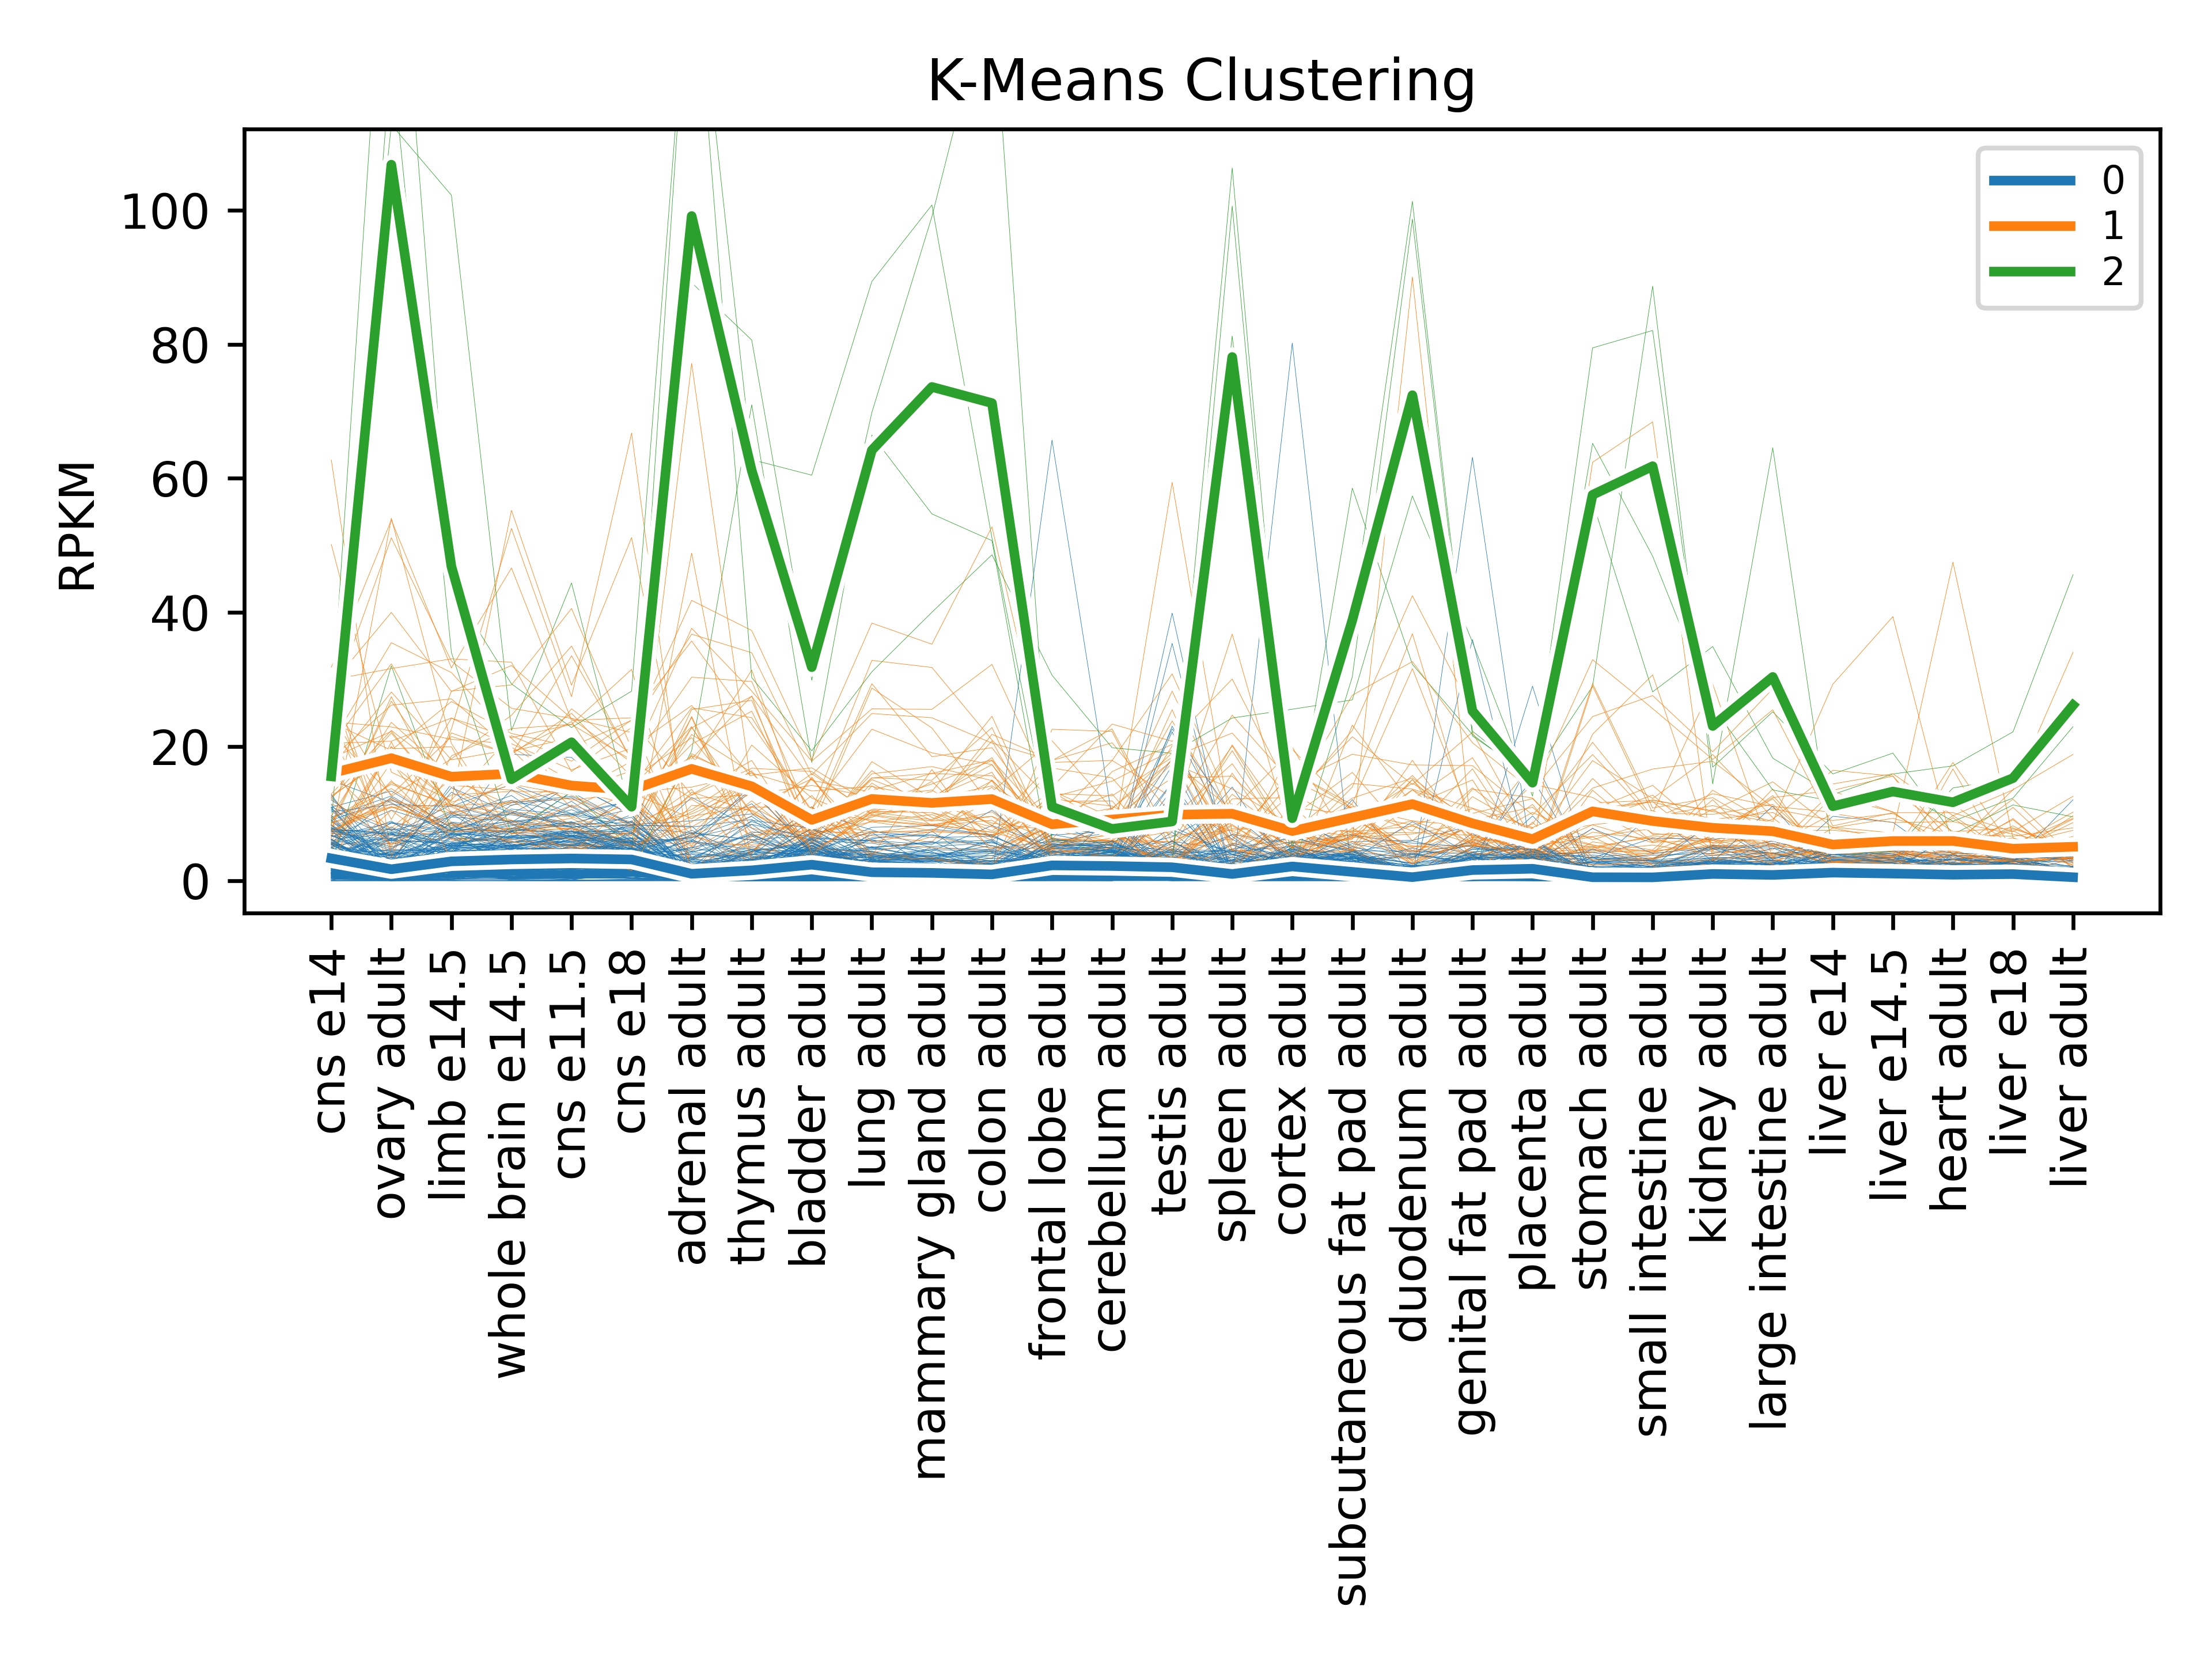
By default, the analyze function runs k-means clustering with a k value of
3 and no scaling. Here is an example plot of the default analyze function.
The above graph tells us more about how genes cluster together in terms of the amount of expression. The green line is high expression, orange is medium, and blue is low. The associated CSV file will assign genes to these clusters, so we can determine which genes have high expression, for instance:
ID,NAME,GROUP,ASSIGNMENT,URL
[...]
12192,Zfp36l1,2,'adrenal adult|bladder adult|cns e11.5|colon adult|cortex adult|duodenum adult|frontal lobe adult|genital fat pad adult|heart adult|kidney adult|large intestine adult|limb e14.5|liver adult|liver e14|liver e14.5|liver e18|lung adult|mammary gland adult|ovary adult|placenta adult|small intestine adult|spleen adult|stomach adult|subcutaneous fat pad adult|thymus adult',https://www.ncbi.nlm.nih.gov/gene/12192
12193,Zfp36l2,2,'adrenal adult|bladder adult|cns e11.5|colon adult|cortex adult|duodenum adult|frontal lobe adult|genital fat pad adult|heart adult|kidney adult|large intestine adult|limb e14.5|liver adult|liver e14|liver e14.5|liver e18|lung adult|mammary gland adult|ovary adult|placenta adult|small intestine adult|spleen adult|stomach adult|subcutaneous fat pad adult|thymus adult',https://www.ncbi.nlm.nih.gov/gene/12193
22695,Zfp36,2,'adrenal adult|bladder adult|cns e11.5|colon adult|cortex adult|duodenum adult|frontal lobe adult|genital fat pad adult|heart adult|kidney adult|large intestine adult|limb e14.5|liver adult|liver e14|liver e14.5|liver e18|lung adult|mammary gland adult|ovary adult|placenta adult|small intestine adult|spleen adult|stomach adult|subcutaneous fat pad adult|thymus adult',https://www.ncbi.nlm.nih.gov/gene/22695
244216,Zfp771,2,'adrenal adult|bladder adult|cns e11.5|colon adult|cortex adult|duodenum adult|frontal lobe adult|genital fat pad adult|heart adult|kidney adult|large intestine adult|limb e14.5|liver adult|liver e14|liver e14.5|liver e18|lung adult|mammary gland adult|ovary adult|placenta adult|small intestine adult|spleen adult|stomach adult|subcutaneous fat pad adult|thymus adult',https://www.ncbi.nlm.nih.gov/gene/244216
We can get different results from the clustering algorithm if we change the k
value and scaling parameter, like so:
# k-means clustering, scaled by Z-score
analyze(inp_fname="clean.csv",
        out_fname="k6_zscore.csv",
        plt_fname="k6_zscore.jpg",
        k=6, scaling="zscore")
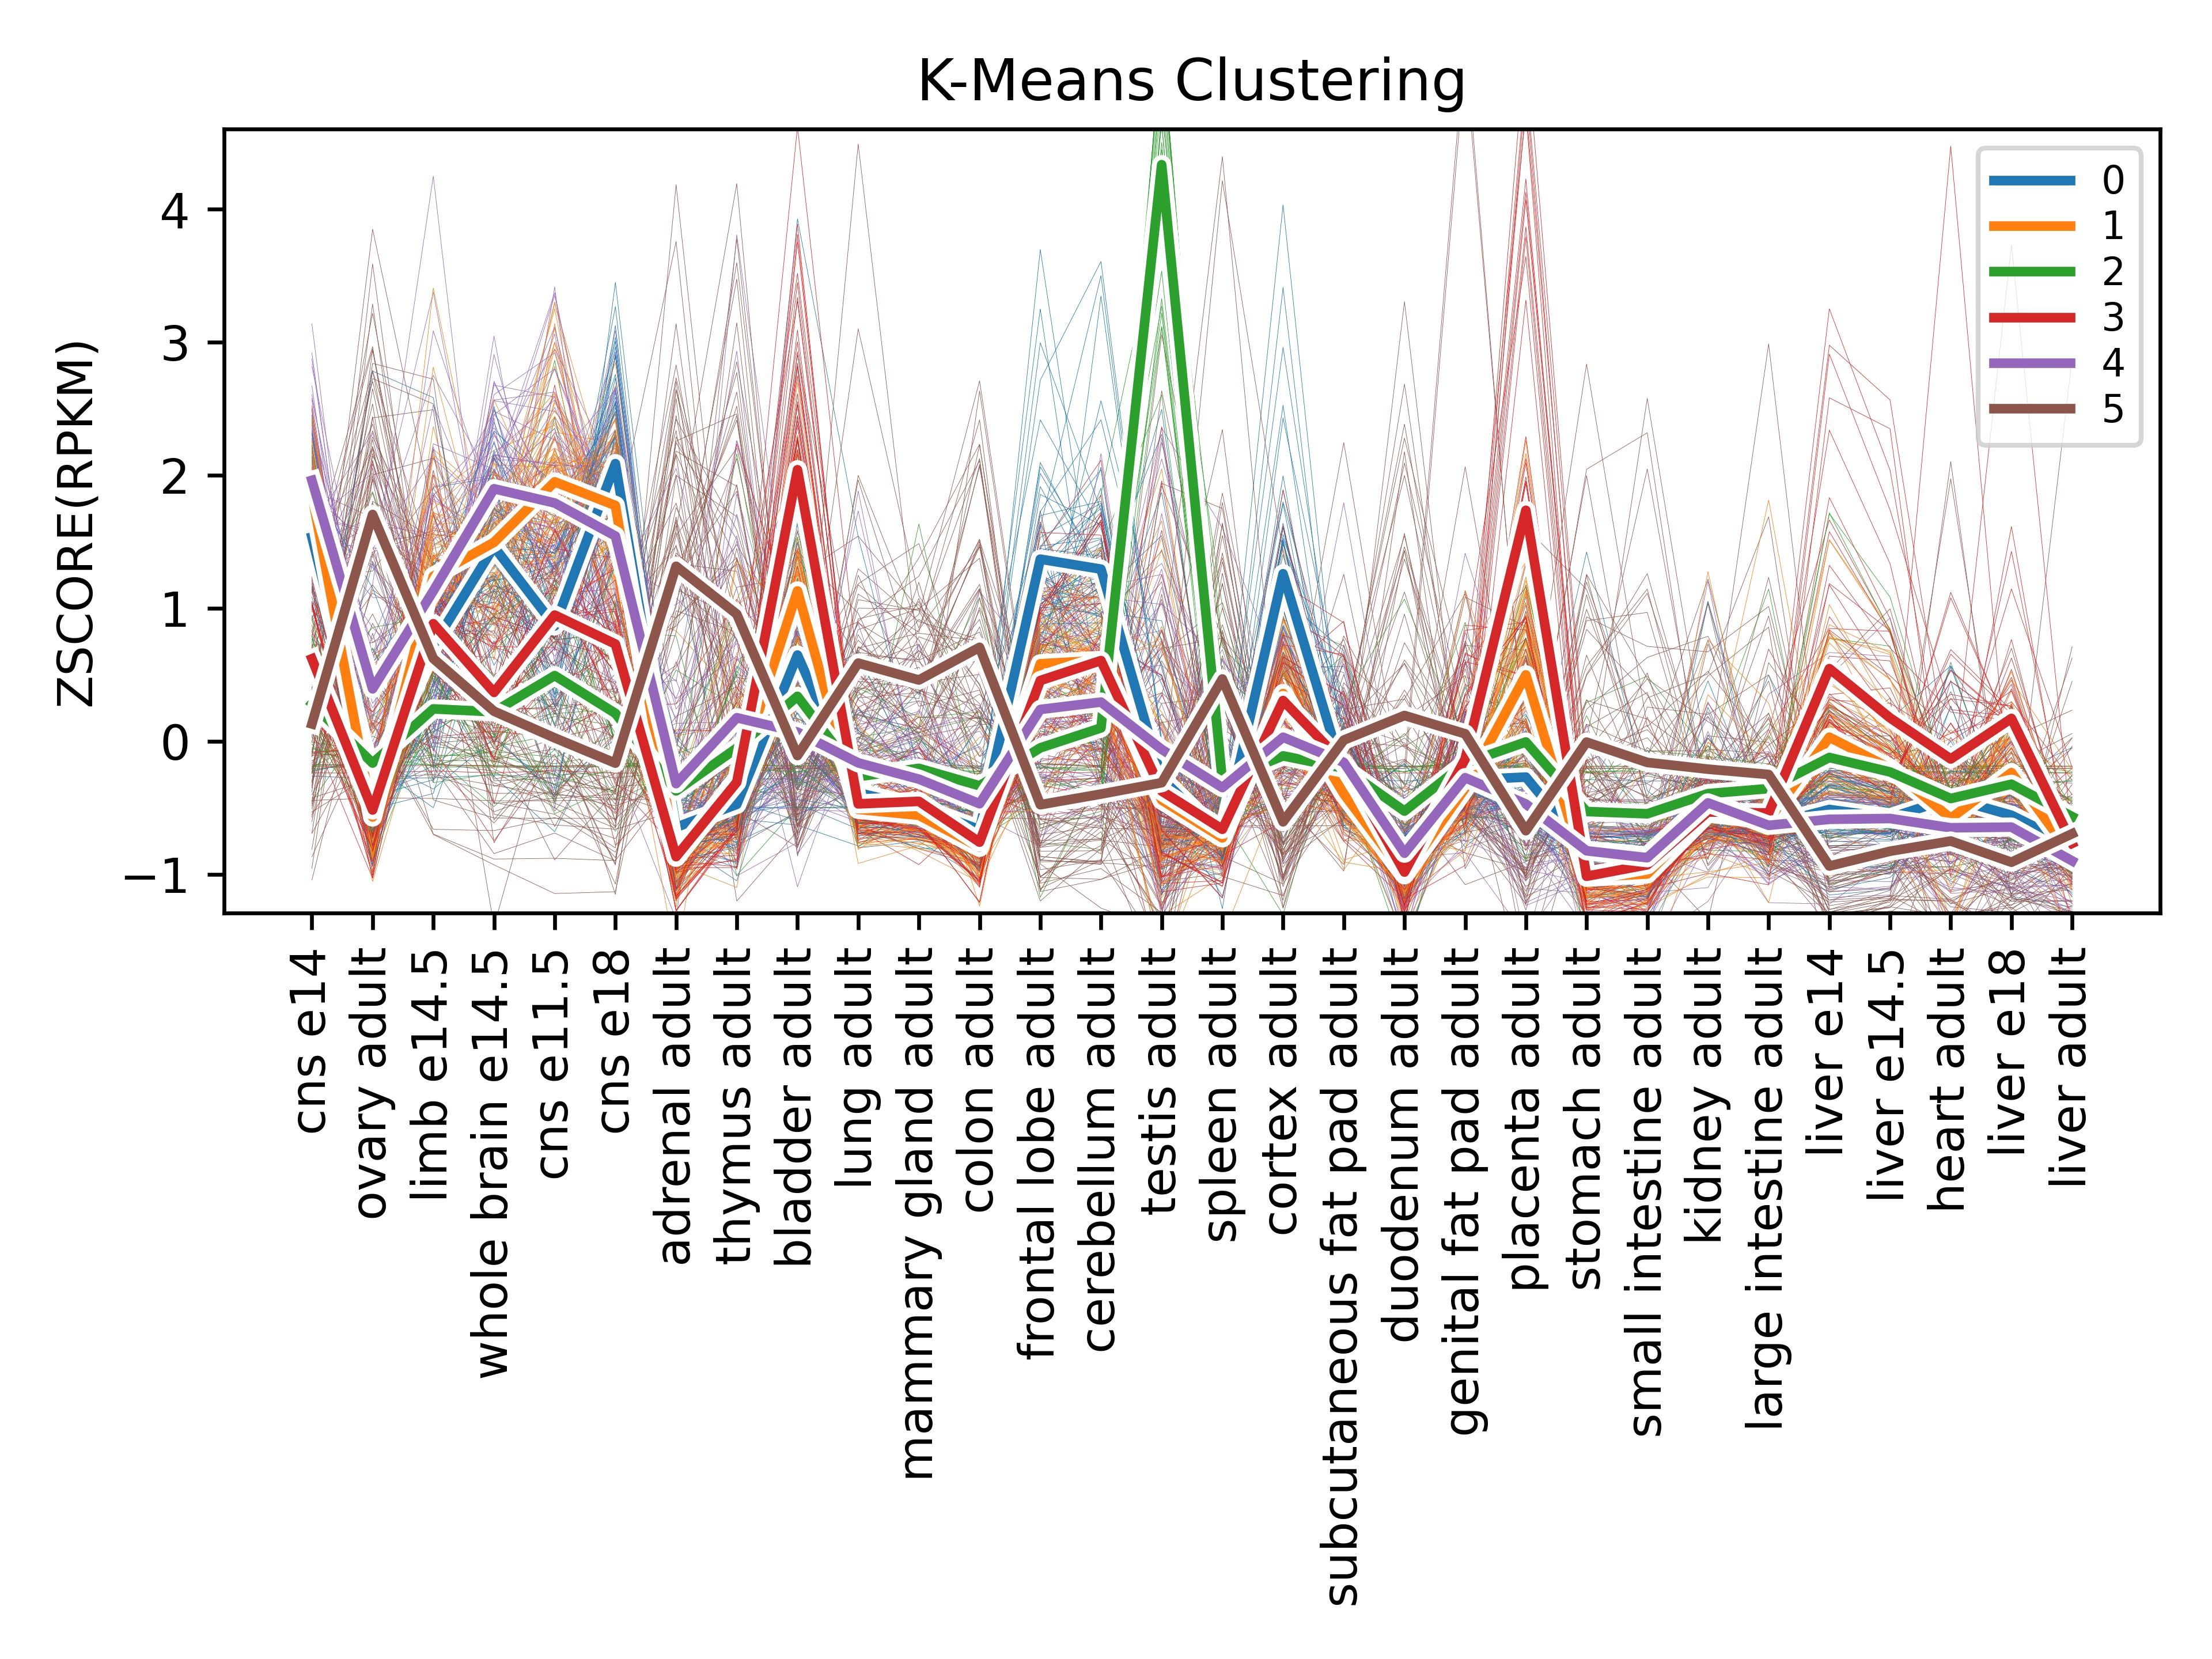
And now we get results like this:
The above graph tells us more about how genes cluster together in terms of the profile of the tissues they are expressed in. So, for instance, it appears the green line has very high expression in the testis. Let's take a look at that cluster in the associated CSV file to find out what genes are expressed in the testis:
ID,NAME,GROUP,ASSIGNMENT,URL
[...]
22646,Zfp105,2,'liver adult|testis adult',https://www.ncbi.nlm.nih.gov/gene/22646
22654,Zfp13,2,'liver adult|testis adult',https://www.ncbi.nlm.nih.gov/gene/22654
22694,Zfp35,2,'liver adult|testis adult',https://www.ncbi.nlm.nih.gov/gene/22694
22696,Zfp37,2,'liver adult|testis adult',https://www.ncbi.nlm.nih.gov/gene/22696
22698,Zfp39,2,'liver adult|testis adult',https://www.ncbi.nlm.nih.gov/gene/22698
29813,Zfp385a,2,'liver adult|testis adult',https://www.ncbi.nlm.nih.gov/gene/29813
65020,Zfp110,2,'liver adult|testis adult',https://www.ncbi.nlm.nih.gov/gene/65020
66758,Zfp474,2,'liver adult|testis adult',https://www.ncbi.nlm.nih.gov/gene/66758
68271,Zfp85os,2,'liver adult|testis adult',https://www.ncbi.nlm.nih.gov/gene/68271
72020,Zfp654,2,'liver adult|testis adult',https://www.ncbi.nlm.nih.gov/gene/72020
74400,Zfp819,2,'liver adult|testis adult',https://www.ncbi.nlm.nih.gov/gene/74400
75424,Zfp820,2,'liver adult|testis adult',https://www.ncbi.nlm.nih.gov/gene/75424
98403,Zfp451,2,'liver adult|testis adult',https://www.ncbi.nlm.nih.gov/gene/98403
101197,Zfp956,2,'liver adult|testis adult',https://www.ncbi.nlm.nih.gov/gene/101197
105590,Zfp957,2,'liver adult|testis adult',https://www.ncbi.nlm.nih.gov/gene/105590
109910,Zfp91,2,'liver adult|testis adult',https://www.ncbi.nlm.nih.gov/gene/109910
228913,Zfp217,2,'liver adult|testis adult',https://www.ncbi.nlm.nih.gov/gene/228913
232976,Zfp574,2,'liver adult|testis adult',https://www.ncbi.nlm.nih.gov/gene/232976
233905,Zfp646,2,'liver adult|testis adult',https://www.ncbi.nlm.nih.gov/gene/233905
240186,Zfp438,2,'liver adult|testis adult',https://www.ncbi.nlm.nih.gov/gene/240186
278304,Zfp385c,2,'liver adult|testis adult',https://www.ncbi.nlm.nih.gov/gene/278304
338354,Zfp780b,2,'liver adult|testis adult',https://www.ncbi.nlm.nih.gov/gene/338354
433791,Zfp992,2,'liver adult|testis adult',https://www.ncbi.nlm.nih.gov/gene/433791
545938,Zfp607a,2,'liver adult|testis adult',https://www.ncbi.nlm.nih.gov/gene/545938
666528,Zfp541,2,'liver adult|testis adult',https://www.ncbi.nlm.nih.gov/gene/666528
100038371,Zfp389,2,'liver adult|testis adult',https://www.ncbi.nlm.nih.gov/gene/100038371
100416830,Zfp572,2,'liver adult|testis adult',https://www.ncbi.nlm.nih.gov/gene/100416830
100503000,Zfp993,2,'liver adult|testis adult',https://www.ncbi.nlm.nih.gov/gene/100503000
[...]
It should be stated that tweaking the clustering algorithm is more of an art than a science, and the results are more interpretive than empirical. Have fun exploring the transcriptome!
This program is not robust. You will experience errors and poor traceback information currently. I need to make the program able to handle more erroneous inputs, like empty files or not finding proper keys while retrieving information.


