This code depends on the Python 3.8+ and the MatPlotLib library to generate graphs.
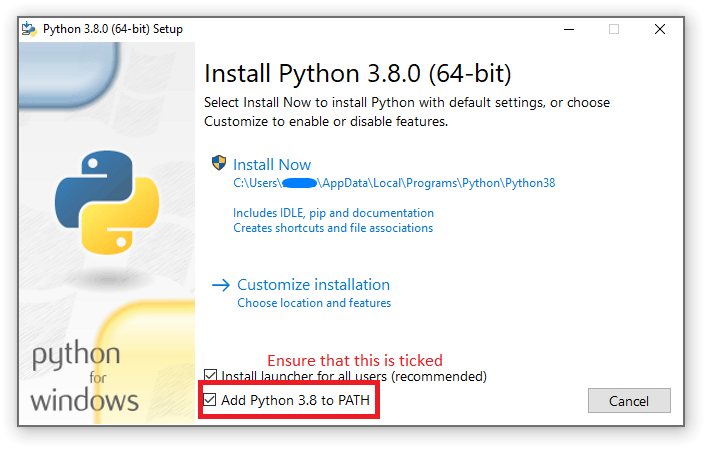
Install python for your operating system from https://www.python.org/downloads/. Ensure that Python is added to path when installing on Windows as shown in the image below.
 |
|---|
| Check the option to Add to path |
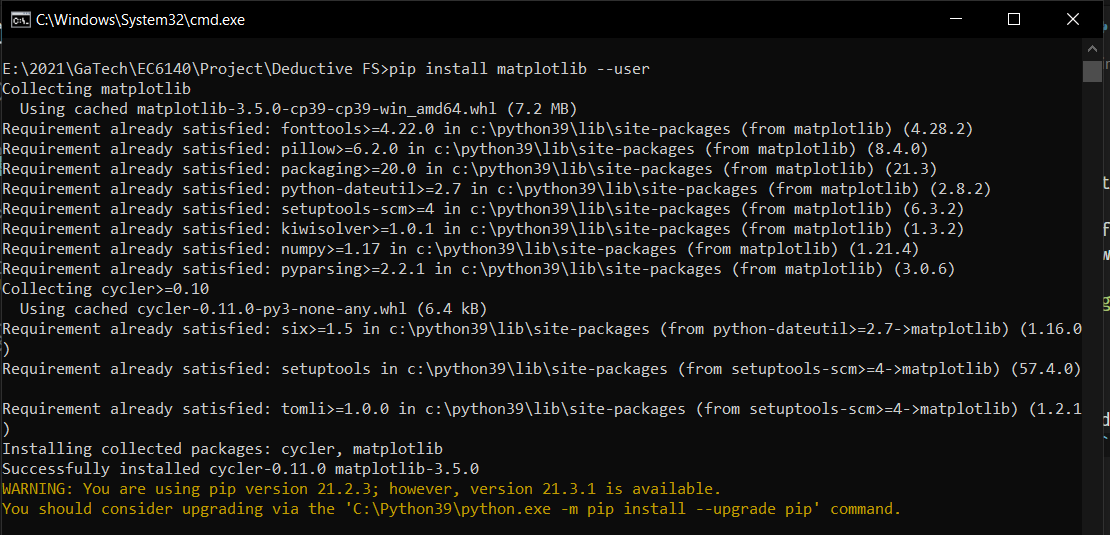
Then launch command prompt (Open Start and Search for Command prompt), and install matplotlib by running pip install matplotlib --user
 |
|---|
| Install matplotlib |
All commands will be ran in command prompt.
input_vectors.txt file
1110101
To only see the outputs for a given input vector which is store in the "input_vectors" file for a circuit names s27.txt in the files folder relative to the deductive.py file, run the following
python deductive.py --cktfile files/s27.txt --ip_vectors input_vectors
Expected output
Good Simulation output 1001
Circuit: files/s27.txt   Input vector: 1 1 1 0 1 0 1
 |
|---|
| Running only output simulator |
To check all faults that a vector can catch for a circuit s27.txt --
The input_vectors.txt file is as below
1110101
Run the following command
python deductive.py --cktfile files/s27.txt --ip_vectors input_vectors.txt --allfaults
Expected output
Circuit: files/s27.txt   Input vector: 1 1 1 0 1 0 1
  1 stuck at 0
  3 stuck at 0
  5 stuck at 0
  7 stuck at 0
  9 stuck at 1
 11 stuck at 1
 12 stuck at 0
 13 stuck at 0
Write the faults in a faultFile.txt like this
1 0
2 1
3 0
4 1
7 0
Run
python deductive.py --cktfile files/s27.txt --ip_vectors input_vectors --faultfile faultFile.txt
Output
Good Simulation output 1001
Circuit: files/s27.txt   Input vector: 1 1 1 0 1 0 1
  1 stuck at 0
  3 stuck at 0
  7 stuck at 0
python deductive.py --cktfile files/s349f_2.txt --randomvectors --allfaults --coverage 0.91
Output
