Warning
This package is still under critical development and validation. Please use and interpret results with caution.
# install devtools
install.packages("devtools")

# install charisma from GitHub
remotes::install_github("shawntschwartz/charisma")Important
Please use the issues tab (https://github.com/shawntschwartz/charisma/issues) to file any bugs or suggestions.
Note
Apologies in advance, I have yet to write complete documentation for the core functions. -s-
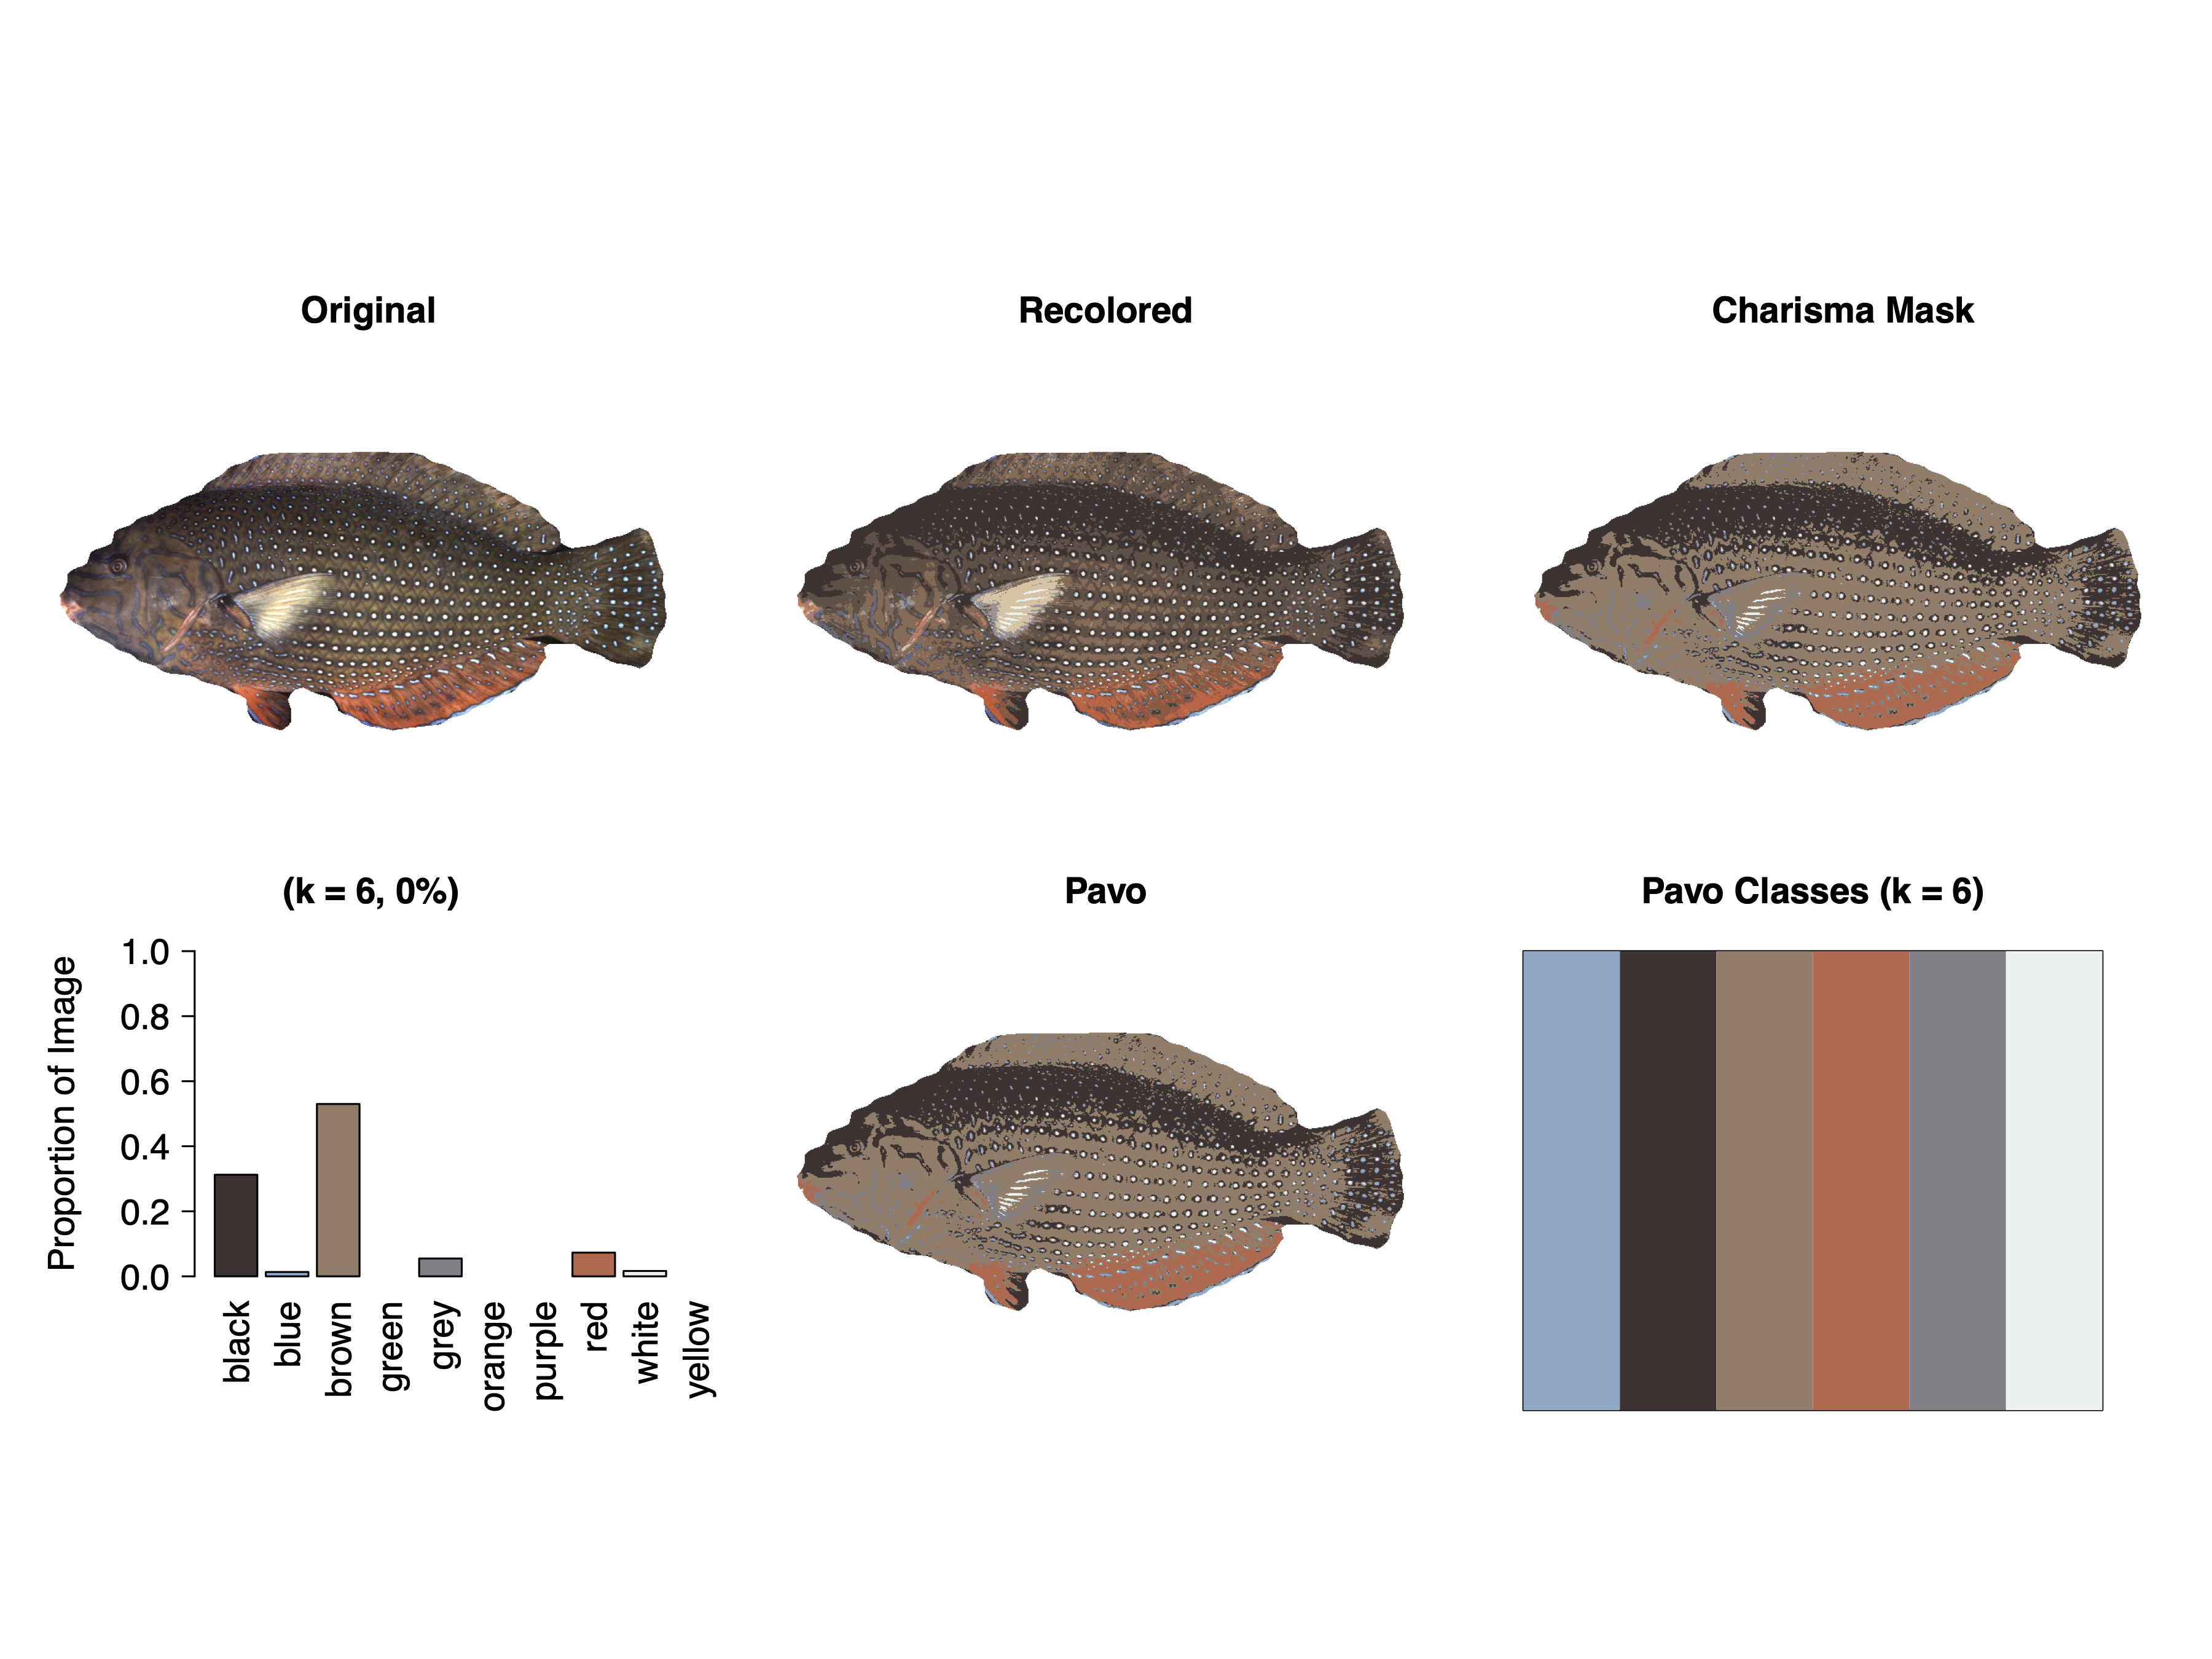
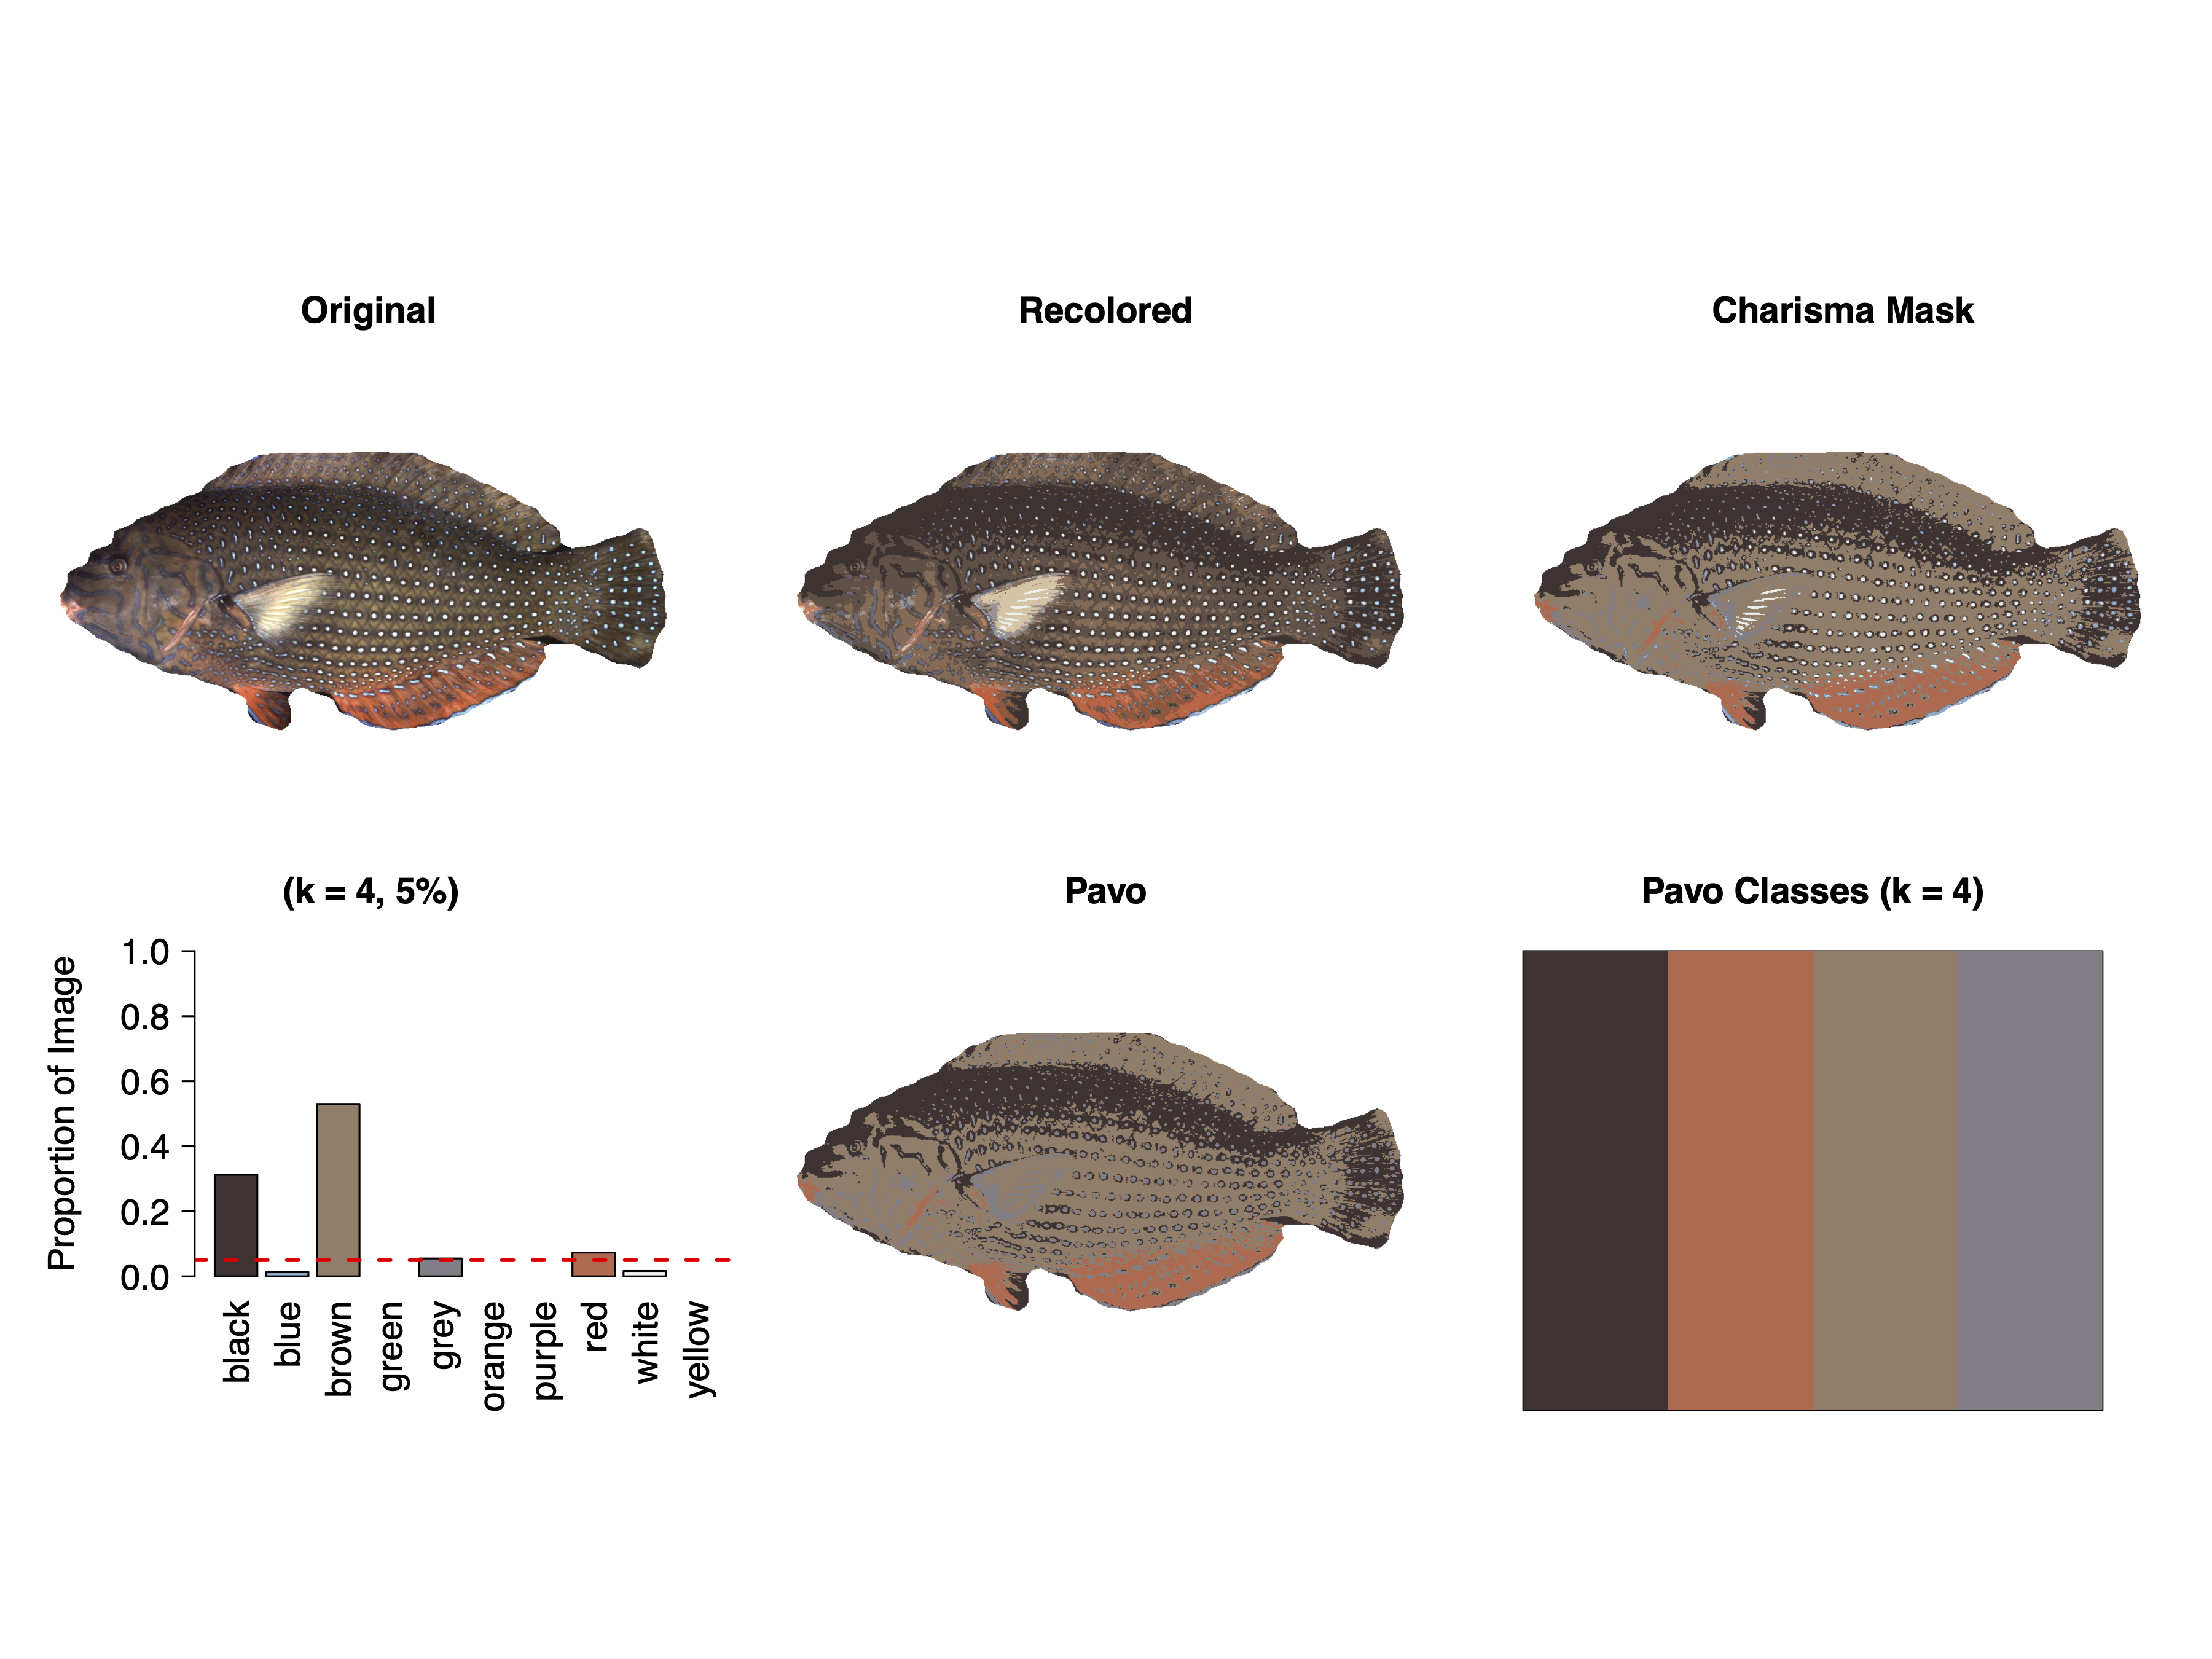
Below is an example use of the primary charisma() function. The resulting charisma object returned by the charisma() function includes all relevant data which can be mined as needed. In addition to the discrete color category labels output by charisma, it also includes the outputs of color pattern geometry statistics computed with pavo.
logdir = ... argument will force charisma() to save both a timestamped .RDS file (of the returned charisma object), as well as a timestamped .pdf file which contains the output of running plot(...) on the resulting charisma object.
✅ Because each saved object is stored with all relevant data (as well as the history of any color merge/replacement operations performed during an interactive session), the charisma pipeline is fully reproducible. See the charisma2() function to be able to step through (and edit) any previously run charisma object.
# load the charisma package
library(charisma)

# settings
color_prop_thresh <- 0.0 # 0 allows *any* prop of colors to be considered
use_interactive_mode <- T # interrupt each img with manual intervention

# define input/output paths
out_dir <- file.path("~", "Documents", "charisma_outputs")

# example of running an "interactive" charisma session on a single image
img <- system.file("extdata", "Anampses_caeruleopunctatus.png",
                   package = "charisma")

c_img <- charisma(img,
                  threshold = color_prop_thresh,
                  auto.drop = T,
                  interactive = use_interactive_mode,
                  plot = F,
                  logdir = out_dir)

# visualize output in the RStudio Viewer:
#  fyi -- since we set a logdir above, we've already automatically saved out
#  this same plot to that directory (so this is just to see it again in RStudio)
plot(c_img)

# modify which aspects are shown in the plot by turning `plot.all` to FALSE
#  and then turning on whatever components you'd like to show up in the plot
plot(c_img, plot.all = F, plot.original = T, plot.masked = T, plot.props = T)👋 Don't hesitate to reach out and chat! shawn.t.schwartz@gmail.com
> new_clut_validation_results <- charisma::validate(clut = my_new_clut)Parallelizing CLUT validation with 13 cores for 3682561 HSV color coordinates...
This may take a while, feel free to go grab a latte!
Total elapsed time for parallelization: 2.98 minutes
All HSV color coordinates classified! ==> Color LUT validation passed ✅
Parallelizing CLUT validation with 13 cores for 3682561 HSV color coordinates...
This may take a while, feel free to go grab a latte!
Total elapsed time for parallelization: 2.98 minutes

Error: missing color classifications for 5,000
HSV color coordinates ==> CLUT validation failed ⛔
See returned output for the HSV coordinates that failed.

