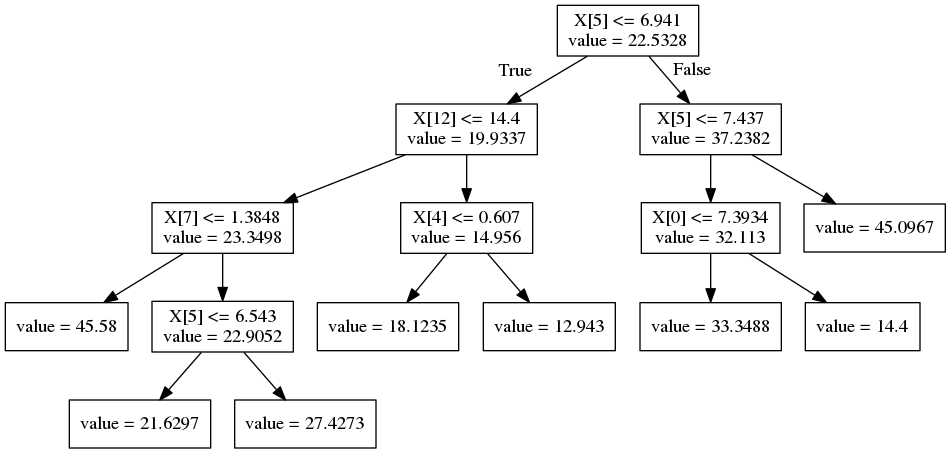
this is post-prune tree code for scikit-learn 0.18.0 sklearn post-prune tree software for using n_leaves methods Prunes the tree to obtain the optimal subtree with n_leaves leaves
=======
step0: cd ./src
step1: cython _tree_prune.pyx
step2: python setup.py build
setp3: copy the files of _tree_prune.cpython-35m-x86_64-linux-gnu.so and tree_prune.py to ../python3.5/site-packages/sklearn/tree
=======
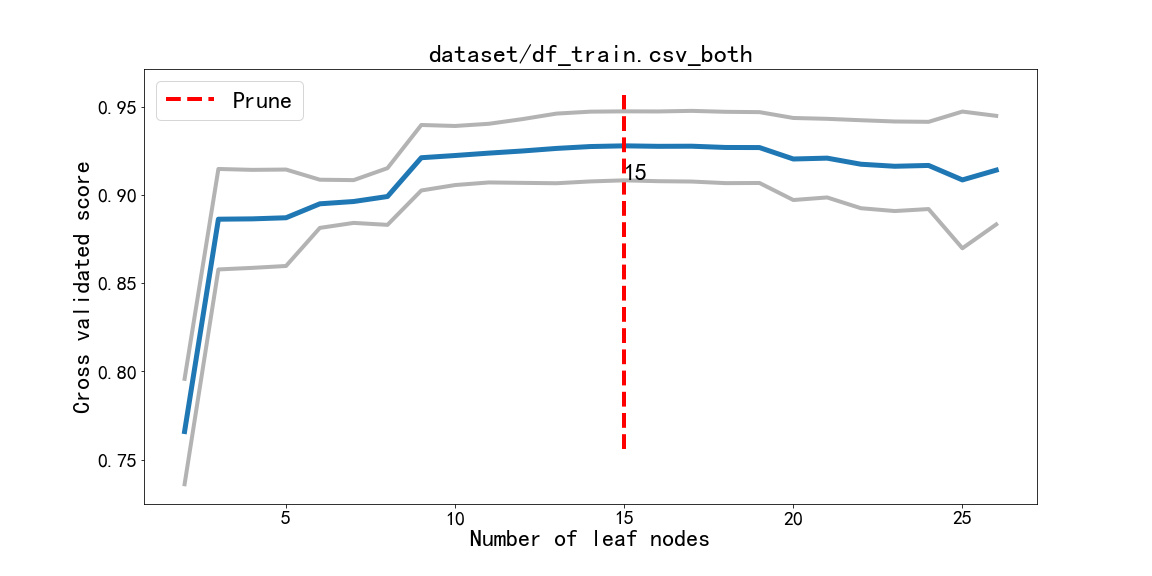
Pruning by the best leaf nodes in the cross-validations:

A common approach to get the best possible tree is to grow a huge tree (for
instance with max_depth=8) and then prune it to an optimum size. As well as
providing a prune method for both :class:DecisionTreeRegressor and
:class:DecisionTreeClassifier, the function prune_path is useful
to find what the optimum size is for a tree.
The prune method just takes as argument the number of leaves the fitted tree should have (an int)::
>>> from sklearn.datasets import load_boston
>>> from sklearn.tree import tree_prune as tree
>>> boston = load_boston()
>>> clf = tree.DecisionTreeRegressor(max_depth=8)
>>> clf = clf.fit(boston.data, boston.target)
>>> clf = clf.prune(8)
In order to find the optimal number of leaves we can use cross validated scores on the data::
>>> from sklearn.datasets import load_boston
>>> from sklearn.tree import tree_prune as tree
>>> boston = load_boston()
>>> clf = tree.DecisionTreeRegressor(max_depth=8)
>>> scores = tree.prune_path(clf, boston.data, boston.target,
...    max_n_leaves=20, n_iterations=10, random_state=0)
In order to plot the scores one can use the following function::
def plot_pruned_path(scores, with_std=True):
    """Plots the cross validated scores versus the number of leaves of trees"""
    import matplotlib.pyplot as plt
    scores = list(scores)
    means = np.array([np.mean(s) for s in scores])
    stds = np.array([np.std(s) for s in scores]) / np.sqrt(len(scores[1]))

    x = range(len(scores) + 1, 1, -1)

    plt.plot(x, means)
    if with_std:
        plt.plot(x, means + 2 * stds, lw=1, c='0.7')
        plt.plot(x, means - 2 * stds, lw=1, c='0.7')

    plt.xlabel('Number of leaves')
    plt.ylabel('Cross validated score')
usage the fuction:
boston = load_boston()
clf = tree.DecisionTreeRegressor(max_depth=8)

#Compute the cross validated scores
scores = tree.prune_path(clf,
                         boston.data,
		     boston.target,
                         max_n_leaves=20,
                         n_iterations=10,
                         random_state=0)

plot_pruned_path(scores)
>>> from sklearn.datasets import load_boston
>>> from sklearn.tree import tree_prune as tree
>>> import pydotplus
>>> from IPython.display import Image
>>> from copy import deepcopy


>>> #pre-prune
>>> boston = load_boston()
>>> clf = tree.DecisionTreeRegressor(max_depth=8)
>>> clf.fit(boston.data,boston.target)
>>> dot_data = tree.export_graphviz(clf,
>>>                                 out_file=None,
>>>                                 feature_names=boston.feature_names
>>>                                 )
>>> graph = pydotplus.graph_from_dot_data(dot_data)
>>> Image(graph.create_png())
>>> tree.get_max_depth(clf)


>>> #post-prune
>>> clf = clf.prune(8)
>>> tree.get_max_depth(clf)
>>> dot_data = tree.export_graphviz(clf,out_file=None, feature_names=boston.feature_names)
>>> graph = pydotplus.graph_from_dot_data(dot_data)
>>> Image(graph.create_png())


>>> clf = tree.DecisionTreeRegressor(max_depth=8)
>>> clf.fit(boston.data,boston.target)
>>> clf1 = deepcopy(clf)
>>> tree.get_max_depth(clf1.prune(10))


>>> for i in range(200,0,-10):
>>>     clf1 = deepcopy(clf)
>>>     print(tree.get_max_depth(clf1.prune(i)))

