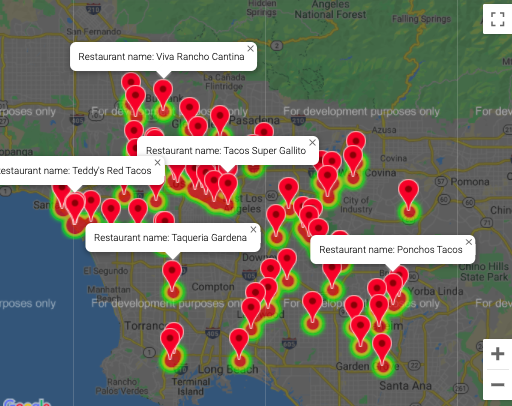
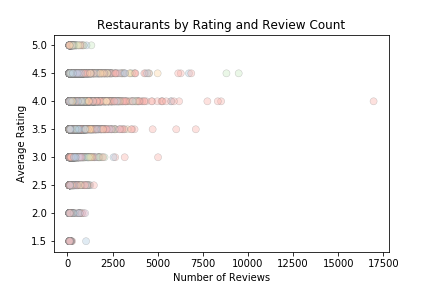
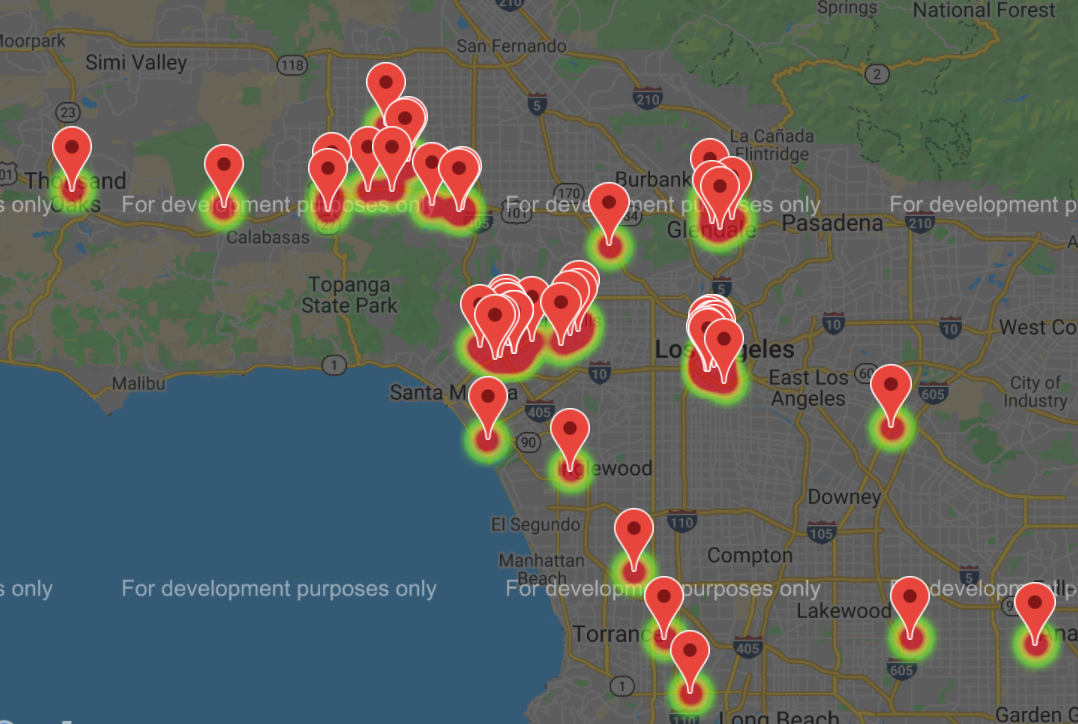
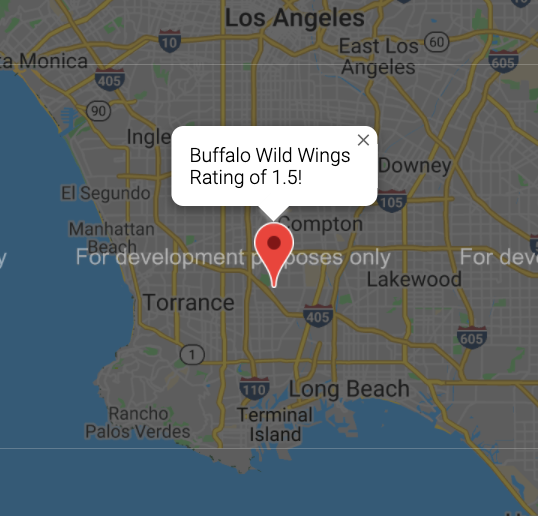
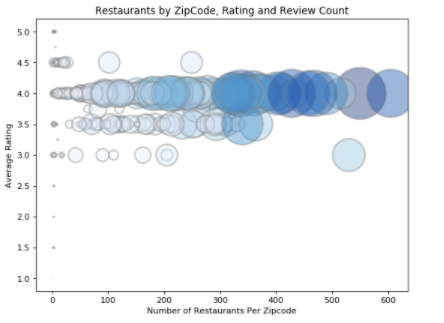
How many stars is a restaurant in LA likely to get? Which cuisine types have the biggest fan base and what areas tend to have the worst rated eateries? Data provides answers and this project explores the relationship between location, reviews and number of ratings for various cuisine types within Los Angeles.
Munging, expunging, normalization and plotting extracted data using Python programming in coordination with the Yelp API to produce analysis and visualization. Website page illuminating findings and providing an interactive map is in the link below.
Click on this link to see deployment.
Python Pandas Gmaps Plotly Graph Matplotlib HTML and CSS
Data is dependent on what was retrieved from Yelp which does limit the amount of data developers can access and may not be a comprehensive reflection of all Los Angeles establishments. This being said, the number of data points is well above 20k and likely provides a large enough sampling to statistically represent the Los Angeles, California market.
Inside of the docs folder are images, HTML and CSS files for the linked page which explaining findings. The link is above and also in the "About" section of this page.
- All csv files used for analysis are in 'csv' folder.
- Initial csv file named: 'la_clean.csv' was generated utilizing the Yelp API. The repository for that project is here: LA Restaurants Yelp API, and the findings from that repository are deployed in an interactive map and the link is here: Los Angeles Restaurants Map.
- Jupyter .ipynb files in 'noteook' directory clean the data and produce the visualizations.
- folders as described above
- readme.md
- Readme images are in in docs folder
